Methods in Spatial Research Spring 2021
Making a Basic Webmap
This tutorial is an introduction to making web maps using Mapbox GL JS. This is a recent javascript library that uses WebGL to render interactive maps from vector tiles (as opposed to raster tiles) created with Mapbox Studio. Data for these maps comes from OpenStreetMap.
This tutorial will introduce you to the basic setup and what it feels like to develop for a web browser, how to add datasets, and then how to make those datasets interactive. This will be a very different approach than your experience thus far in QGIS, and it is much more prone to error given the number of new concepts and syntaxes involved. Brackets, commas, quotes, and colons… stay with it—it’s ok if you don’t understand what everything is doing at first.
Setup Prerequisites
To publish the web map you will create in this tutorial we will use GitHub. This website provides hosting for software development (a website is a kind of software…) version control using Git. Git is a system for tracking changes in software development. (You can think of it like a very sophisticated version of Microsoft Word’s track changes function, and in fact you can use it in this way for writing.) This tutorial will walk you through how to use Git with GitHub to track changes you make to your web map. However, it does not cover the mechanics of Git or GitHub.
Using GitHub will allow us to easily host our web maps online, however it requires a bit of set up.
At this stage, you should:
- create a GitHub account if you don’t already have one
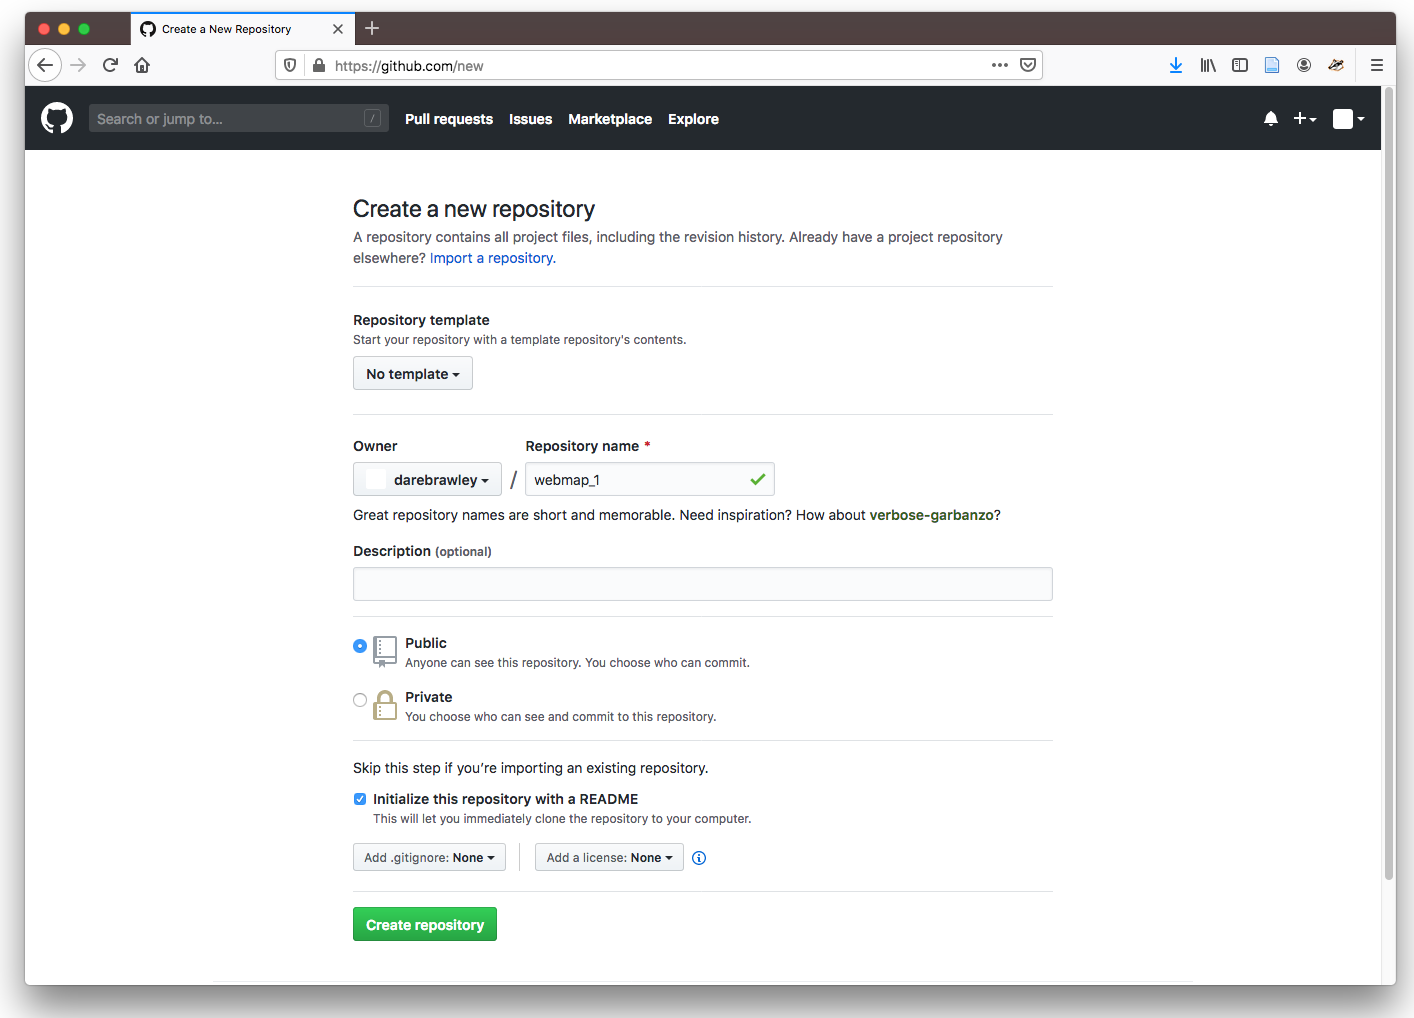
- create a new repository on GitHub
- from the Your Profile page in your newly created github account select Repositories
- select the green New button in the top right of the page
- name this repository
webmap_1 - select Initialize this repository with a README
- select Create Repository
- set up your repository as a GitHub page (a project site from scratch)
- from the new repository you’ve just created select Settings
- scroll down to GitHub Pages and select
Master Branchas the Source
- install Git.
- download and install the git version for your operating system. Follow the instructions of the installer.
- Note that if you’re using a Mac, this will just install the Git command-line program, which you can access through the Terminal app. On Windows, you’ll get the command-line Git plus a new Terminal-like app called Git Bash.
- use Git in the Terminal or Git Bash to clone the repository you created on github.
- On Mac open your terminal (Applications > Utilities > Terminal.app); on PC open Git Bash (Programs > Git > Git Bash, or search for it in the start menu).
- and learned how to navigate;
- navigate to the folder where you would like to create your web map.
- set up git, type the following in your terminal/git bash:
git config --global user.name 'Your Name'
git config --global user.email 'email@wherever.com'(this email should match the one you used to set up Github) - cloned a local copy of your repository to your computer using git.
- by typing:
git clone https://github.com/yourusername/webmap_1
- by typing:
Create empty files that will become your web map and commit your first changes, and push them to GitHub
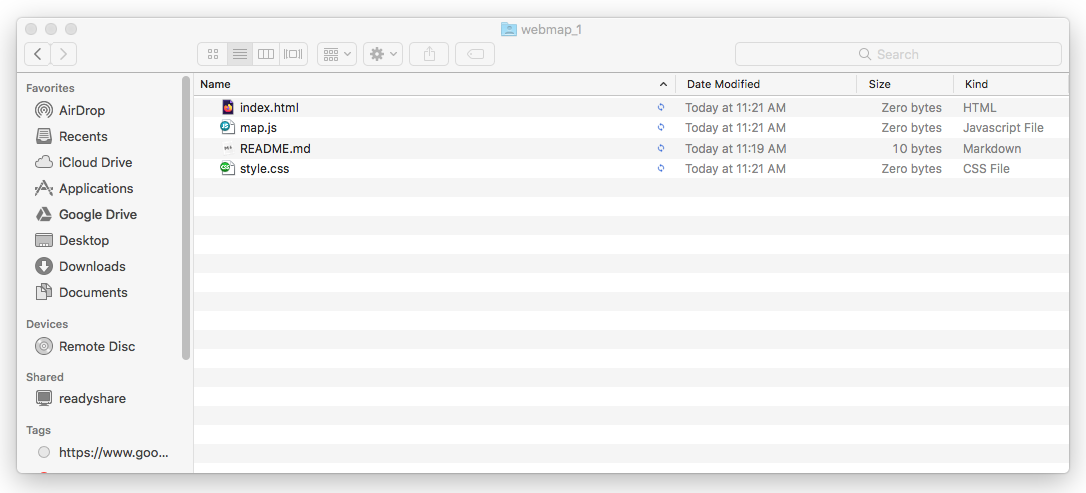
- open your text editor (VS Code is a good one) and create three empty files titled
index.html,style.css, andmap.js. Save them in yourwebmap_1folder. Yourwebmap_1folder should look like this:
- add the files you just created to your repository, to do this in your Terminal/Git Bash type:
git add index.html style.css map.js
- “commit” and “push” your changes:
- in Git Bash or Terminal type:
git commit -m 'initial import'and thengit push
- in Git Bash or Terminal type:
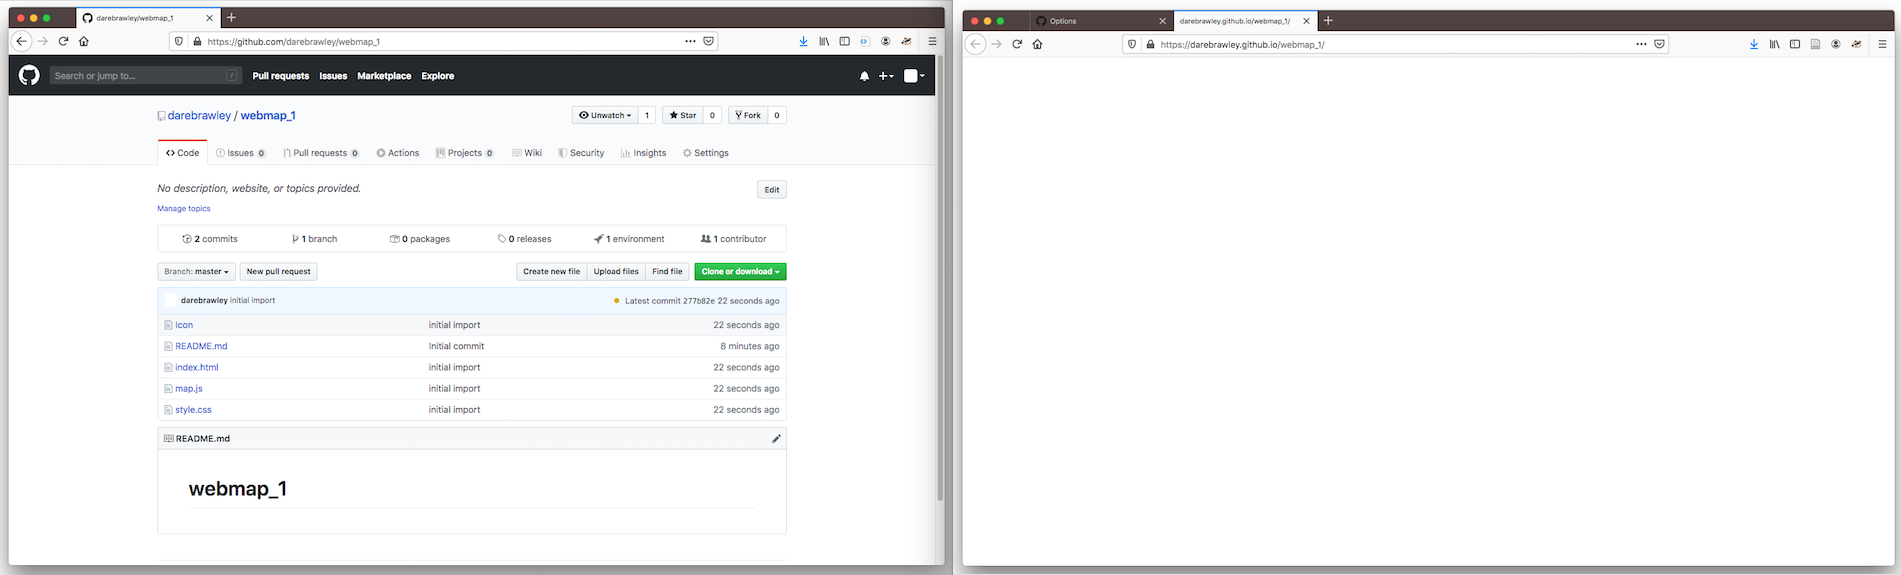
- view the result on your online github repository (the url should be
github.com/yourusername/webmap_1) github page (the url should beyourgithubusername.github.io/webmap_1but you can also find this in the settings of the repository you created on github). You should see something like this:
A web page
HTML is the structure of a web page, css is the style, and javascript is the functionality or the interaction. Each of these are contained in text files with the appropriate extension—and they each have entirely different syntax. When you are creating a website you are creating a series of linked files that your browser downloads and uses to construct the display. These files can also come from remote resources, such as in the case of javascript libraries or map tiles.
HTML is defined by a series of tags, which are either in the form <tag /> or <tag></tag>. A comment in HTML, which is simply a non-functional bit of text meant to explicate the code, is in the form <!-- comment -->. Reproduce the following in your index.html file using your text editor (you can copy and paste).
<!DOCTYPE html> <!-- let the browser know this is an HTML file -->

<html>      <!-- everything else is enclosed in html tags -->
<head>      <!-- the head is for metadata prior to building the page -->

    <!-- define the character set -->
    <meta charset='utf-8' />

    <!-- the title of the page which will show up in the browser bar -->
    <title>Map Test</title>

    <!-- discourage the browser from caching the page -->
    <meta http-equiv='Cache-Control' content='no-cache, no-store, must-revalidate' />
    <meta http-equiv='Pragma' content='no-cache' />
    <meta http-equiv='Expires' content='0' />

    <!-- tells mobile devices how to scale the page -->
    <meta name='viewport' content='initial-scale=1,maximum-scale=1,user-scalable=no' />

    <!-- stylesheet links -->
    <link href='https://api.tiles.mapbox.com/mapbox-gl-js/v0.50.0/mapbox-gl.css' rel='stylesheet' />
    <link href='style.css' rel='stylesheet' />

    <!-- javascript links -->
    <script src='https://api.tiles.mapbox.com/mapbox-gl-js/v0.50.0/mapbox-gl.js'></script>

</head>
<body>      <!-- visible structure of page begins here -->

    <!-- an element called 'map' -->
    <div id='map'></div>

    <!-- an element called 'info' -->
    <div id='info'></div>

    <!-- load additional javascript -->
    <script src='map.js'></script>

</body>
</html>
Notice that we are loading several files within this page (these are in the <link> and <script> tags). These include a css and javascript file from Mapbox, and our own css and javascript files. Some files need to be loaded in a particular order — the reason map.js is loaded within the body and not the head is that it must be loaded after the map and info elements have been created.
Likewise, put this into your style.css file:
body, html {
    margin: 0;
    padding: 0;
    font-family: monospace;
}

#map {
    position: absolute;
    top: 0;
    bottom: 0;
    width: 100%;
}

#info {
    position: absolute;
    top: 0;
    right: 0;
    margin: 10px 10px auto auto;    /* top right bottom left */
    padding: 5px;
    border: 2px solid #ddd;
    border-radius: 5px;
    font-size: 12px;
    text-align: center;
    color: #222;
    background: #fff;
}

img {
    width: 300px;
}
CSS, which stands for Cascading Style Sheets, defines the display properties for each HTML element — that is, how the page looks. At the moment, our page only has two elements, which you see defined here as #map and #info. We also have defined a default width for assets. Note that a comment in css is designated like /* comment */.
Next, copy the following text into your map.js:
console.log("Hello, world!")
Unlike HTML and css, javascript is a programming language. HTML and css give important information to the browser, but they are like blueprints, whereas javascript is more like a recipe. Javascript will be our focus for the web mapping exercises. We are going to stop short of covering all general programming fundamentals, but you will learn how the various elements function and how to modify code to suit your purposes.
console.log is a debug statement—it lets you write to the javascript console to keep track of what you’re doing, which is a very helpful tool.
At this point, we will create a local webserver so that we can view the webpage we just created.
Create a local development server using Python:
on Mac:
- Open Terminal, then test to see what version of Python your computer has installed by typing
python -V. Hit enter. - note whether your computer has python 2 or python 3 installed
on Windows:
- Open Command Prompt, then test to see what version of Python your computer has installed by typing
python -V. Hit enter.
If python is installed on your computer it will tell you which version is installed. Make a note of whether it is Python 2 or python 3.
If your command prompt/terminal instead says something like 'python' is not recognized as an internal or external command,
operable program or batch file. then you do not have Python installed and you will need to download it. Follow these instructions to download Python if it is not already installed.
Once you have successfully confirmed that you have python installed, we will use it to create a local server to view our website from.
Navigate to your webmap_1 folder from inside your Terminal or Command Prompt. To do this you will type cd followed by the path to your webmap folder. In my case this was:
$ cd Documents/webmap_1
Once you are inside your webmap_1 folder, type the appropriate command for your version of Python in Command Prompt or Terminal:
Python 3: python -m http.server
Python 2: python -m SimpleHTTPServer
After you hit enter your Terminal/Command Prompt should say something like: Serving HTTP on 0.0.0.0 port 8000 ...
Open your browser and navigate to: http://localhost:8000
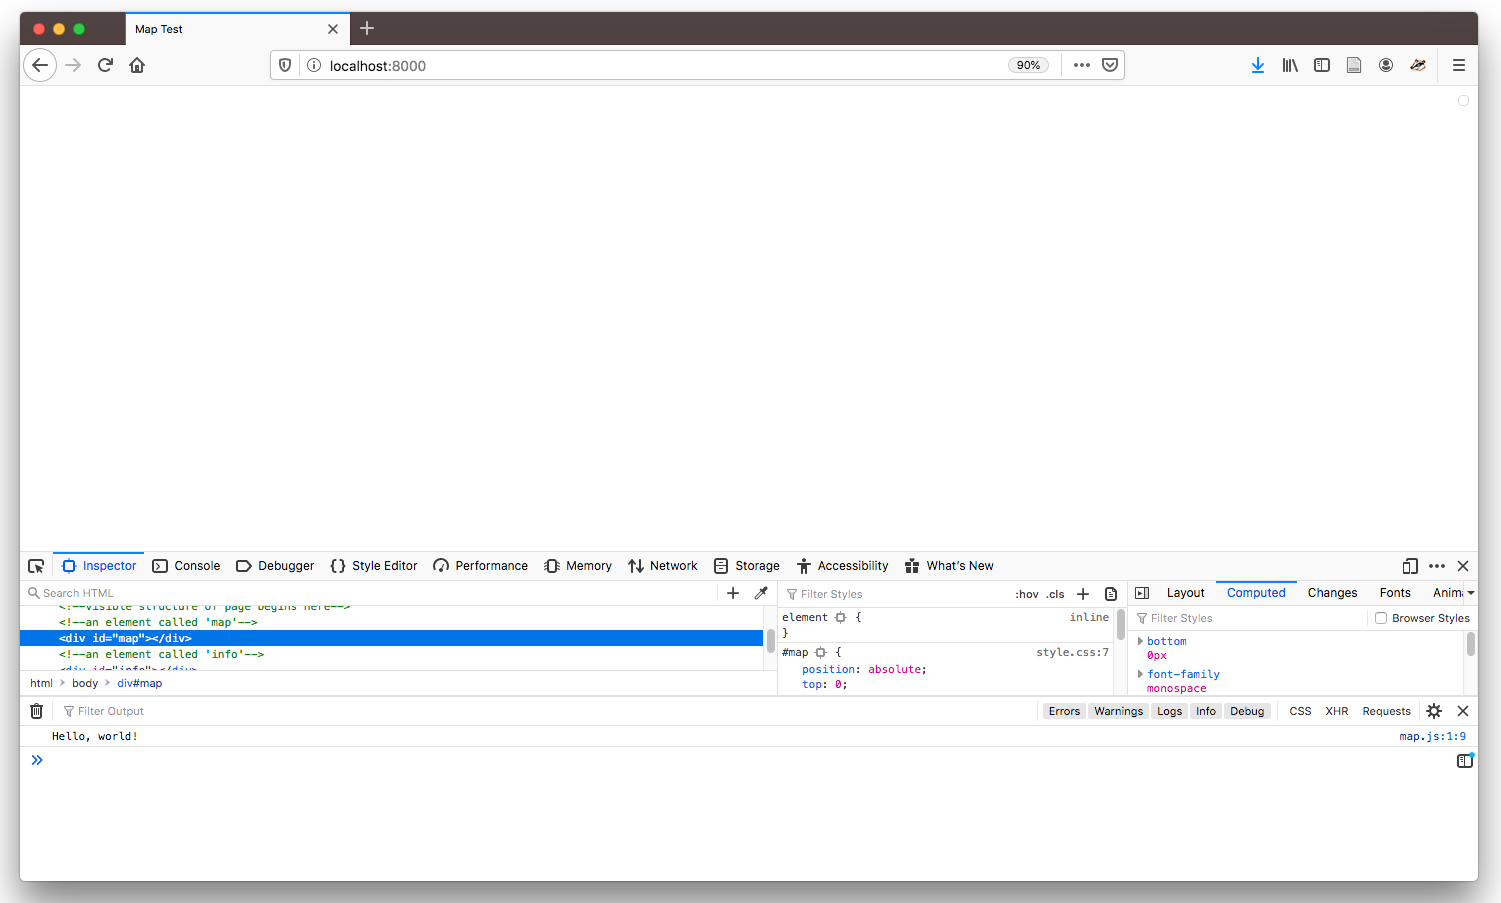
On the page itself you should see … nothing.
However, in your browser open View > Developer > JavaScript Console . You should see “Hello, world!” printed. This means that your map.js file has been successfully loaded and you are ready to start programming. If you see any error messages, check the format of your HTML and that the script tag which loads the Mapbox javascript are formatted correctly.
Basic Mapbox GL JavaScript
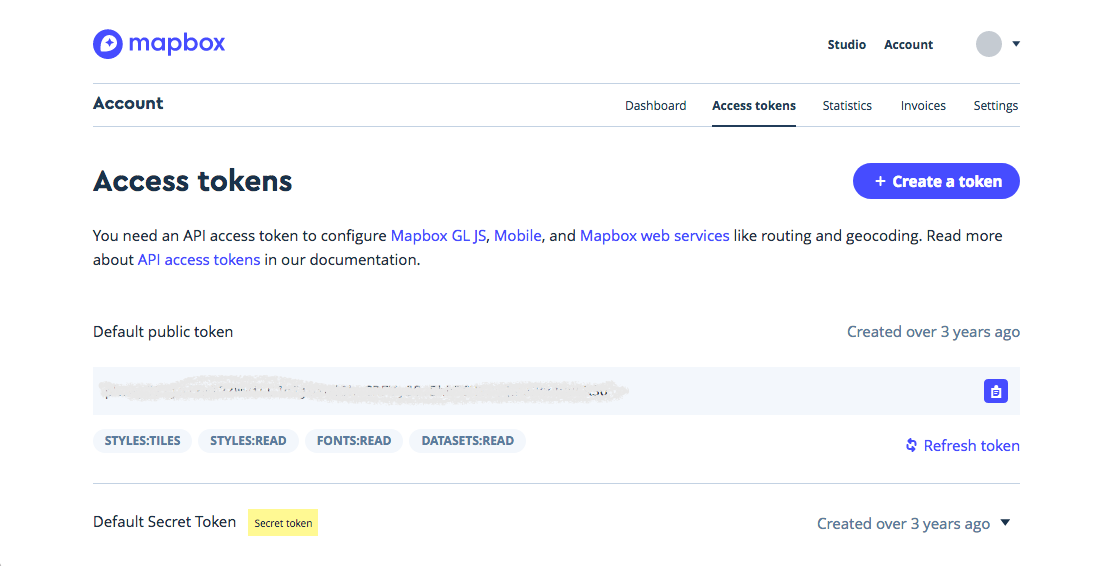
One more setup step: register a Mapbox account. Then find your “Default public token” under the “Access Tokens” tab, which you will use in your code.
To begin, replace the debug statement in your map.js file with the following (minus the comments, which in js are designated by a leading //):
'use strict'        // let the browser know we're serious

// debug statement letting us know the file is loaded
console.log('Loaded map.js')

// your mapbox token
mapboxgl.accessToken = 'YOUR TOKEN HERE BETWEEN THE QUOTES'
You might want to reload your page and check the console to make sure there are no errors—you should just see your debug statement. Now add this to the bottom of your js file:
var map = new mapboxgl.Map({
    container: 'map',
    style: 'mapbox://styles/mapbox/light-v9',
    center: [-73.93324, 40.80877],
    zoom: 14
});
Now we’re cooking with gas. If you reload, you should see a map of Harlem (Web Mercator Projection). Have some fun zooming around.
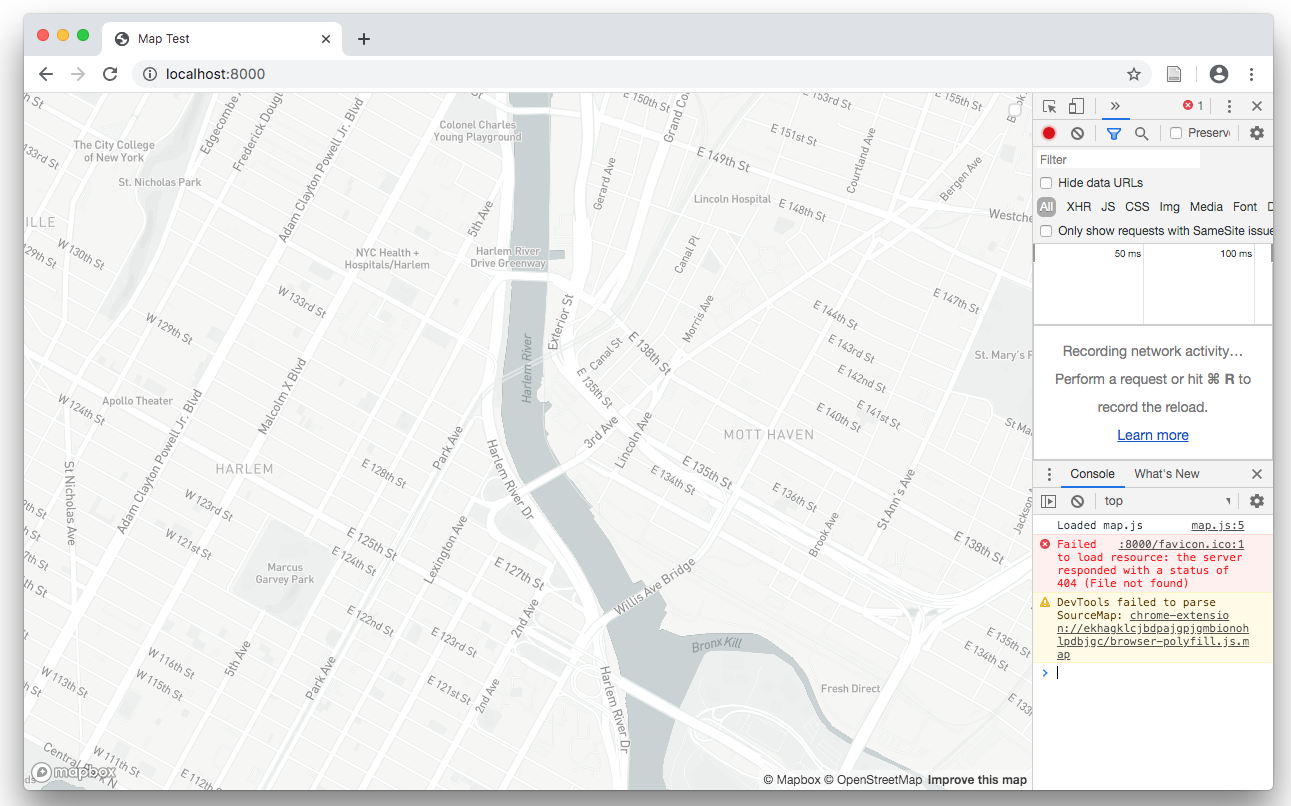
If you don’t see a map, make sure you’ve followed the syntax exactly, and check for errors in your console. When programming, one misplaced character can break the whole thing (watch your commas and brackets!). The block of code we just added creates a new variable map which is a new instance of the Map object provided by the Mapbox javascript file we loaded in our HTML. “map” is actually an arbitrary name—you can choose whatever you want. A Map object has several attributes that we can change: container lets it know the HTML element that will become the map (in this case also called map), style defines a data source for the base map, and center and zoom define the starting coordinates for the map. Change these for map and see what happens.
Other options for style:
style: 'mapbox://styles/mapbox/basic-v9',
style: 'mapbox://styles/mapbox/outdoors-v10',
style: 'mapbox://styles/mapbox/light-v9',
style: 'mapbox://styles/mapbox/dark-v9',
style: 'mapbox://styles/mapbox/satellite-v9',
style: 'mapbox://styles/mapbox/satellite-streets-v10',
style: 'mapbox://styles/mapbox/navigation-preview-day-v2',
style: 'mapbox://styles/mapbox/navigation-preview-night-v2',
style: 'mapbox://styles/mapbox/navigation-guidance-day-v2',
style: 'mapbox://styles/mapbox/navigation-guidance-night-v2',
style: 'mapbox://styles/brianhouse/cjn0u552b52kr2spdz6yhpqj4'
Notice how the last style here is attached to a user account. You can customize your own styles with Mapbox Studio. Once you create a style, you’ll just need to find your “Style URL” by clicking “Share & use” and then the “Use” tab and scrolling down.
There are many other attributes you can add to the Map object, which you can find here.
Adding geojson data:
Now that we have a working webpage and a map object we will add vector data to our map. First a layer with points and then one with polygons.
You can use the data you created in the previous tutorial here or any of the data we have used in other tutorials thus far this semester.
The data must be in geojson format and use the WGS84 geographic coordinate system.
Create a data folder within the directory you are using to create your web map (in our case within the webmap_1 folder).
Adding a geojson dataset of points to your map
Prepare the point dataset you wish to use, use QGIS to export your chosen data in a geojson format that uses the WGS84 geographic coordinate system if it does not already exist in this form.
Save the geojson file of points that you plan to use in the data folder you have just created.
The instructions below use the dataset of Harlem street trees that you were introduced to in tutorial 1 as an example. It is available in the class data folder.
To add your chosen point dataset to your map you will need to do three things:
- load the dataset into your map object
- create a new layer containing your geojson data and style it as you would like
- create a function that tells our map object to execute the two actions above when the webpage loads
First in your map.js file create a variable to hold the url where the dataset you are using is stored. Add this below were you defined your map variable.
var trees_url = "./data/nyc_harlemriverstreettrees_4326.geojson"
Next we will use an “object method” that modifies our map object in order to add our dataset onto the map when our webpage loads. Add the following code snippet below the variable you just created with the dataset you are using.
map.on('load',function(){
  // define a 'source' for your point dataset
  map.addSource('trees_data',{
    'type':'geojson',
    'data': "./data/nyc_harlemriverstreettrees_4326.geojson"
  });
  // add a new layer with your points
  map.addLayer({
    'id':'trees',
    'type':'circle',
    'source':'trees_data',
    'paint':{
      'circle-radius':4,
      'circle-color': '#349f27',
      'circle-opacity':0.7
    },
  })


});
A few things to note here:
map.on()is a method which listens for a specific type of event, in this case when the page loads (defined because we specified'load'). This method waits for whatever we have defined to happen and then executes the'function'we define. Here the function adds our datasource, and creates a new layer that shows our data.- with
map.addSourcewe have defined a new data source and have given it the name'trees_data' - the
'data'resides at the location we just defined with our variable'trees_url' - with
map.addLayerwe are defining a new layer that will get added to our map. We have defined the'id'to be'trees'. The'type'of the layer is'circle'. The'source'is the'trees_data'source we defined withadd.Sourceabove. And finally'paint'lets us define how our circles are drawn.
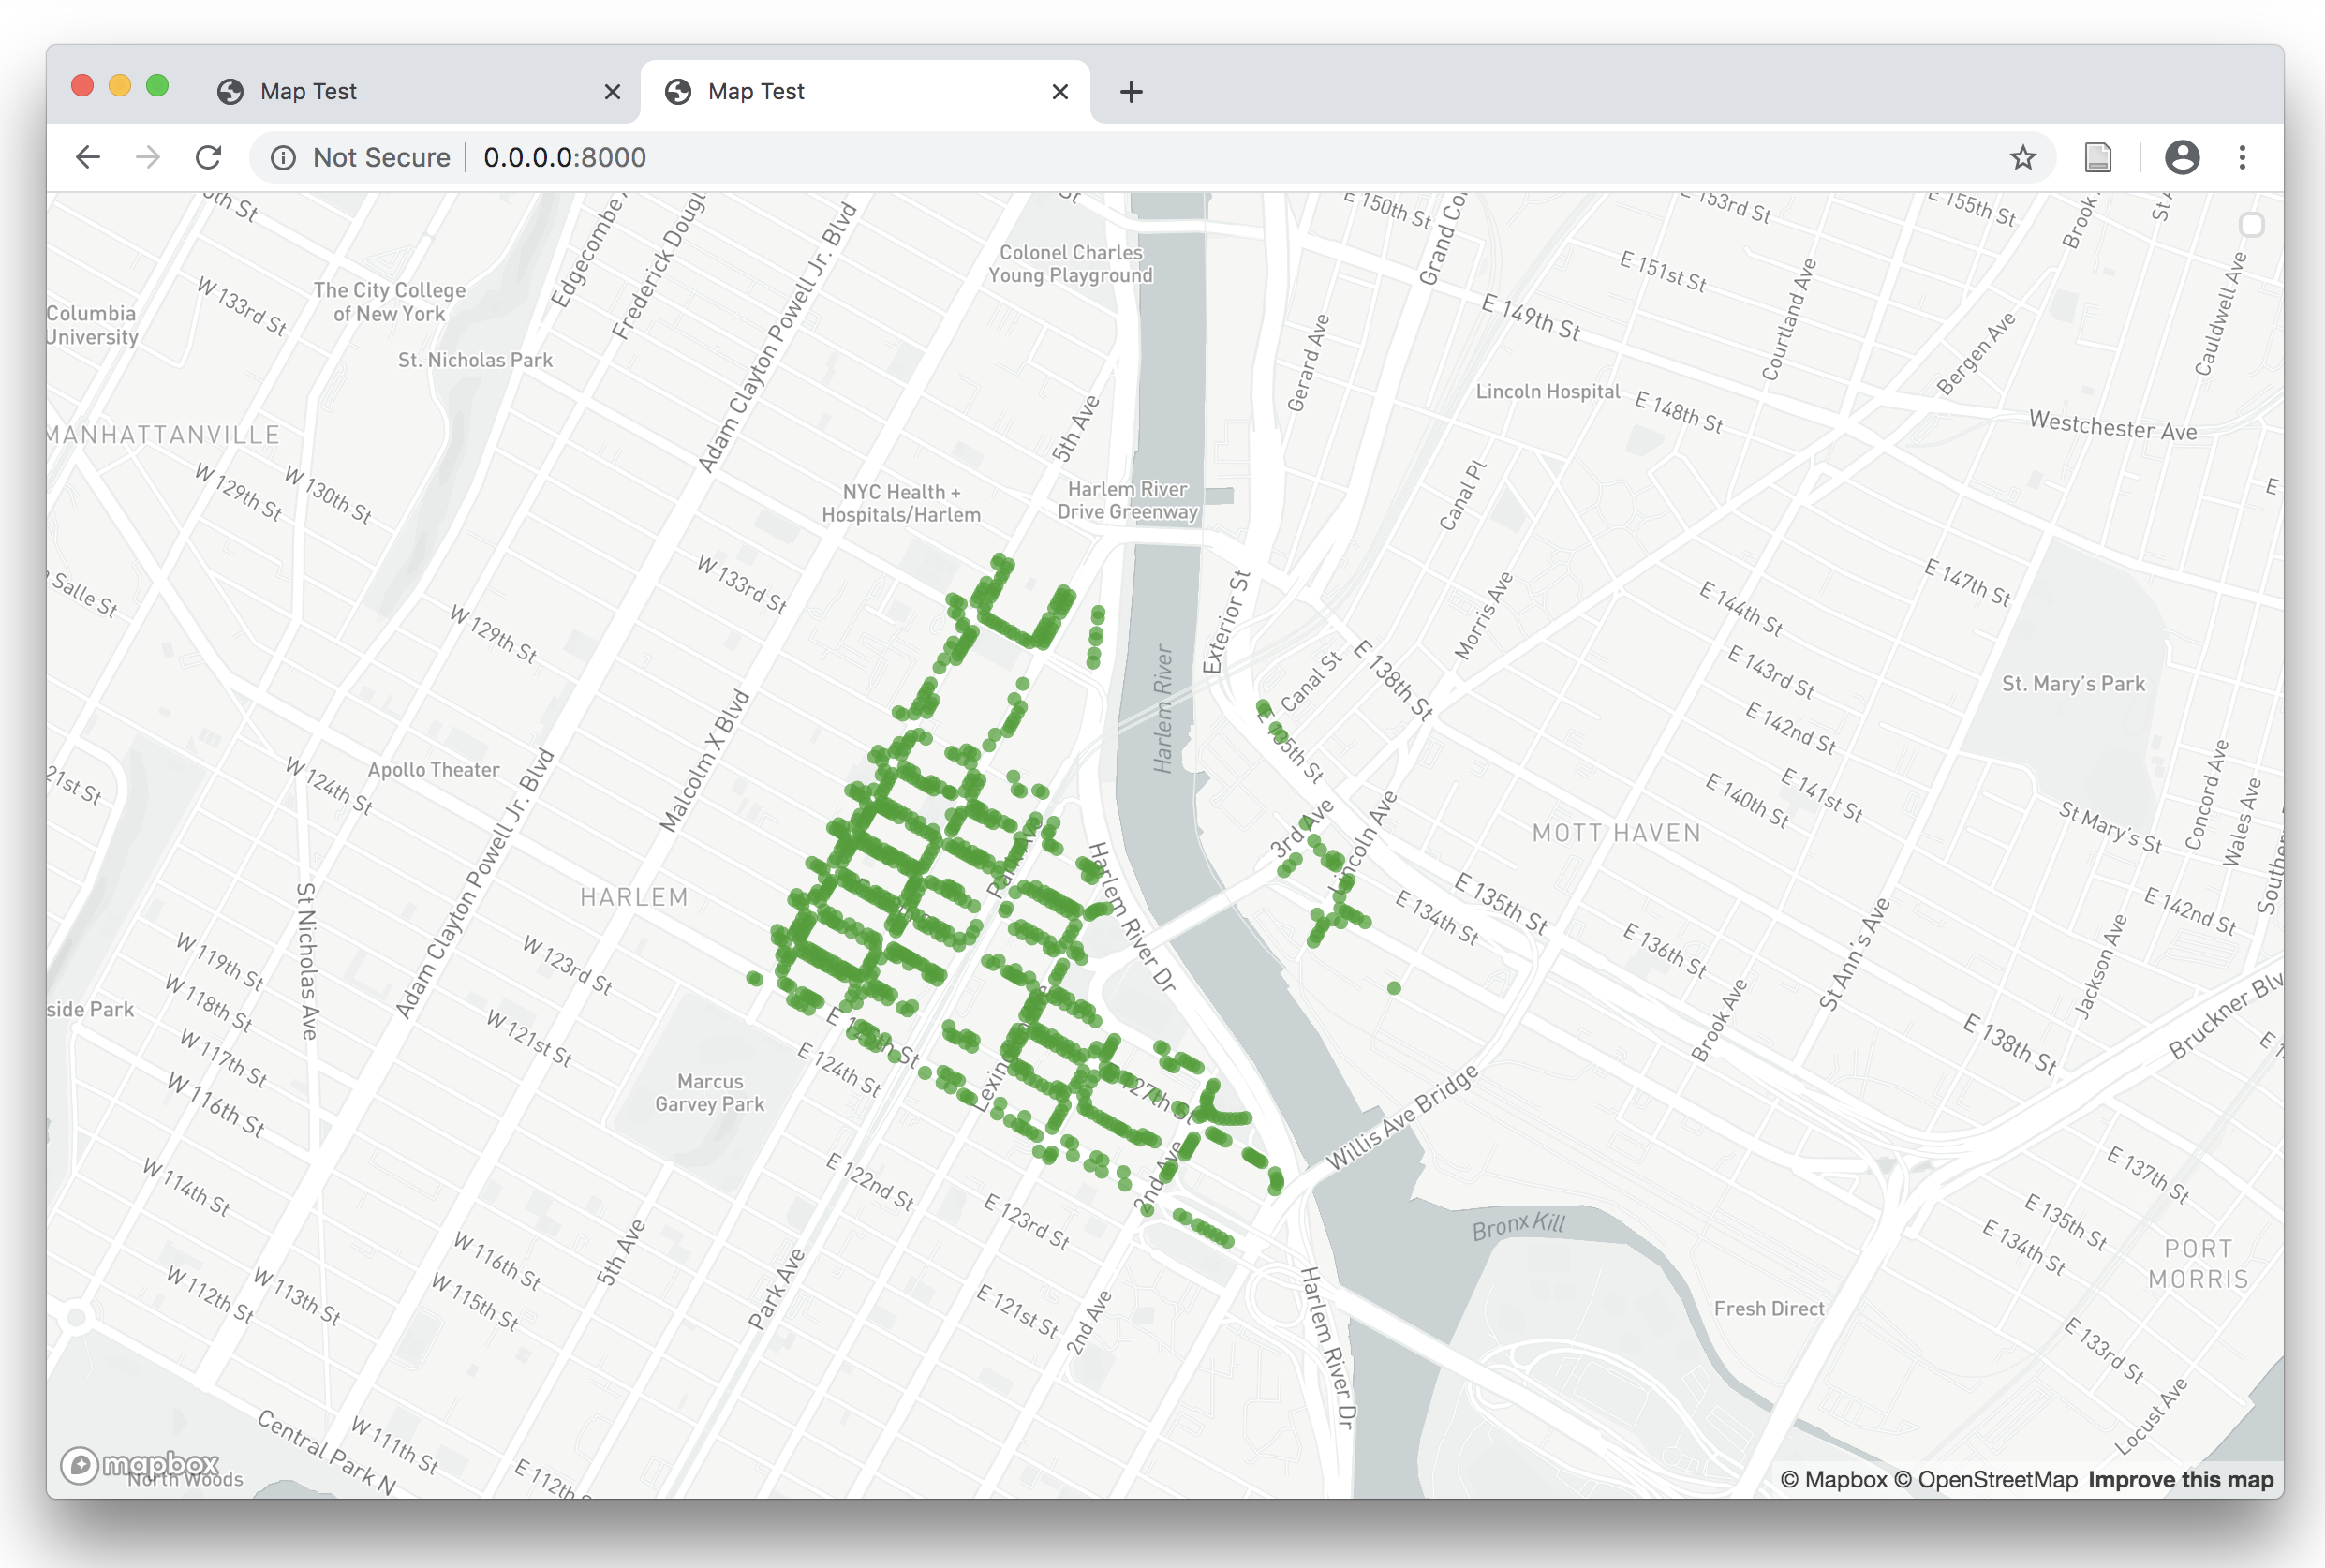
Save your map.js file and reload your browser. You should see the trees!
Adding a geojson dataset of polygons to your map
Next we will add a polygon layer.
Save the geojson file of polygons that you plan to use in the data folder you have just created.
The instructions below use the dataset of Harlem buildings that you were introduced to in tutorial 1 as an example. It is available in the class data folder.
We will repeat the steps above that we used for the points:
- load the dataset into your map object
- create a new layer containing your geojson data and style it as you would like.
First in your map.js file create a new variable containing the url of your polygon dataset). Place this just below the variable you created for your points dataset.
var buildings_url = "./data/nyc_harlemriverbldgs.geojson"
Next we will use the .addSource and .addLayer methods to add these polygons to our map.
Inside the map.on('load') function that you defined above include the code snippet below. (Pay careful attention to making sure that you maintain the pairs of brackets and parentheses around each method when you do this).
  // define a 'source' for your polygons dataset
  map.addSource('buildings',{
    'type':'geojson',
    'data': buildings_url,
  });
  // add a new layer with your polygons
  map.addLayer({
    'id':'buildings',
    'type':'fill',
    'source':'buildings',
    'paint':{
      'fill-color':'#888888',
      'fill-outline-color':'#000000'
    }
  })
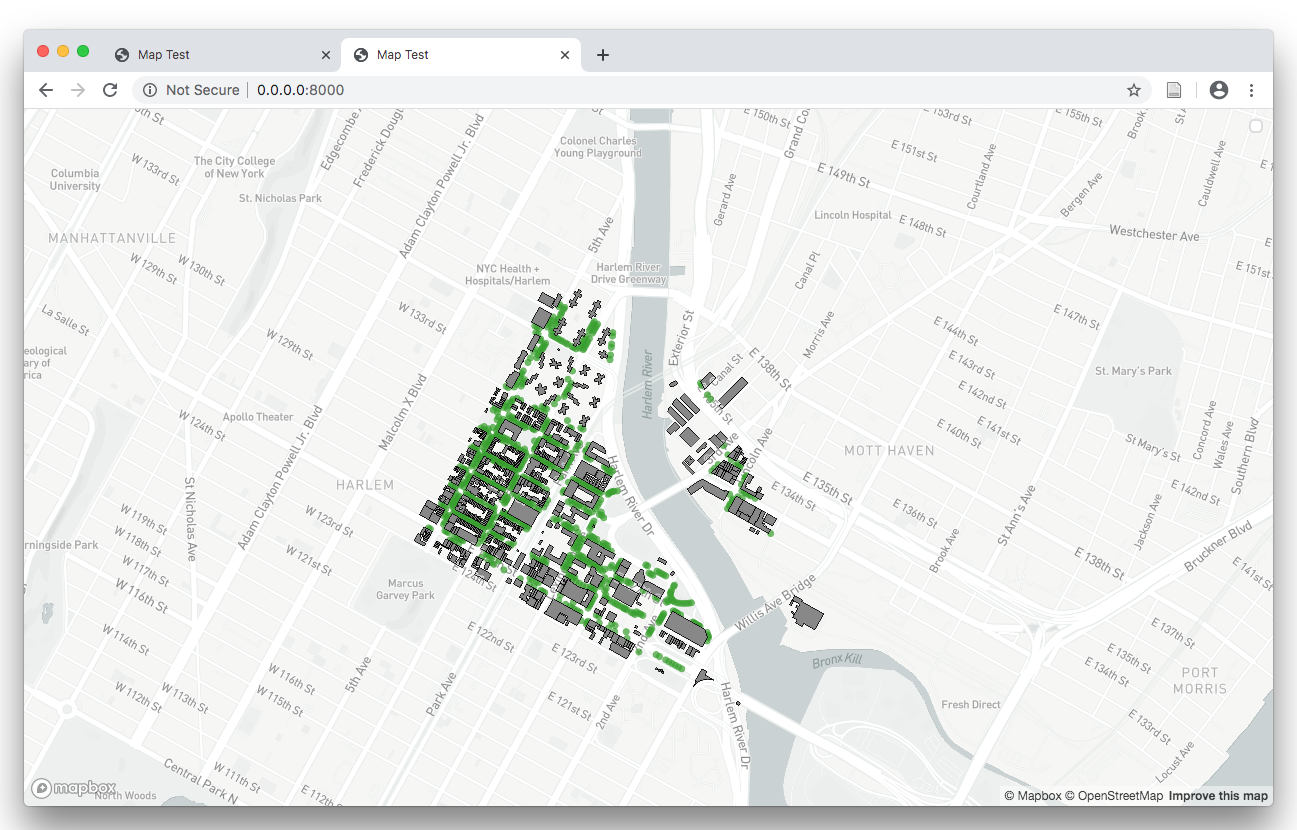
Save your map.js file and reload your browser window. You should see the polygon dataset you just added to your map!
Adding raster data
There are multiple ways to add raster data to your map: by using the addLayer method we used to add the geojson data to our map we can add either a raster image we host ourselves, or we can add raster ‘tiles’ hosted elsewhere (like the Stamen design map we looked at in tutorial 1). An alternative method is that we can create our own raster tiles, host them on mapbox, and then add them on to our map. This tutorial explains how to do the first two methods: adding raster data from an externally hosted raster tiles, and adding raster data from a image file.
Adding raster data from externally hosted raster tiles
Identify hosted raster tiles that you would like to use. The NYPL Map Warper project is one great source of georeferenced historical maps, they make all of their maps available for download. And also host them as raster tiles.
For this example we will use this map from an 1879 atlas of New York City which overlaps with our present day trees and buildings in Harlem. Navigate to the map. Click on the Export tab.
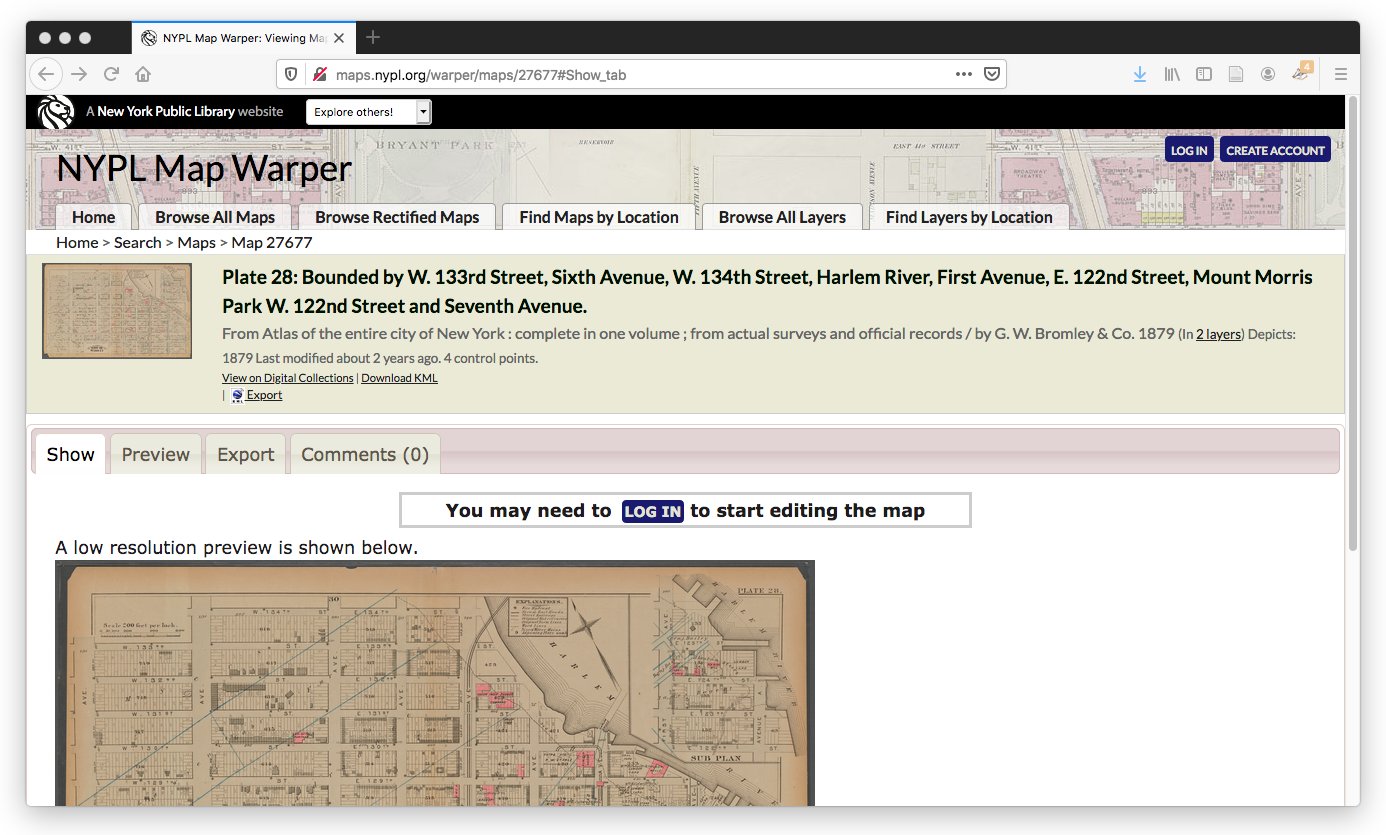
Note the link to Tiles (Google/OSM scheme): which is http://maps.nypl.org/warper/maps/tile/27677/{z}/{x}/{y}.png
this is a link which will allow us to access a raster tile layer of the map from our web map.
In your map.js file we will now add these raster tiles as a new source via the .addSource method, and then create a new layer via the .addLayer method to show the raster tiles on our map.
Within map.on('load') function add the following code snippet:
// NYPL map warper raster tile service as source
map.addSource('nypl',{
  'type':'raster',
  'tiles':["http://maps.nypl.org/warper/maps/tile/27677/{z}/{x}/{y}.png "],
  "tileSize": 256,
});
// create a layer from the NYPL tiles
map.addLayer({
  'id':'nypl-m',
  'type':'raster',
  'source':'nypl',
  'paint':{
    'raster-opacity':0.85
  }
});
Save your map.js file and reload your browser window. The 1879 atlas should now be added to your map.
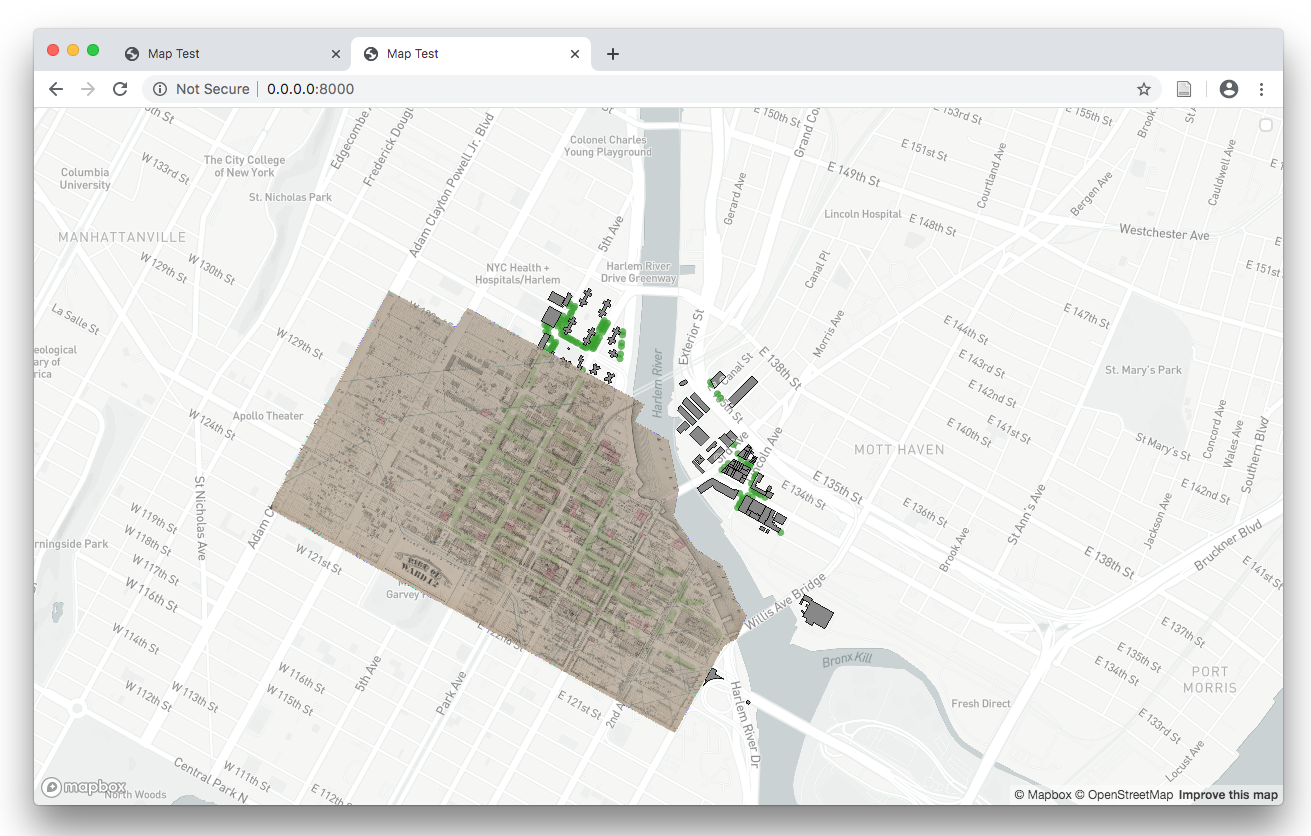
You can experiment with adding different maps from NYPL by switching out the url listed in the 'tiles' parameter.
Note: this layer will be added in what ever order it is called within the map.on('load') function – if it is the last layer being added it will be on top of the rest of your layers. To have this map situated as a background simply copy the code snippet where you are creating a new source, and a new layer and place them just below where you have called map.on. Your full map.on('load') will now look like this:
map.on('load',function(){

  // NYPL map warper raster tile service as source
  map.addSource('nypl',{
    'type':'raster',
    'tiles':["http://maps.nypl.org/warper/maps/tile/27677/{z}/{x}/{y}.png "],
    "tileSize": 256,
  });
  // create a layer from the NYPL tiles
  map.addLayer({
    'id':'nypl-m',
    'type':'raster',
    'source':'nypl',
    'paint':{
      'raster-opacity':0.85
    }
  });

  // define a 'source' for your point dataset
  map.addSource('trees_data',{
    'type':'geojson',
    'data': "./data/nyc_harlemriverstreettrees_4326.geojson"
  });
  // add a new layer with your points
  map.addLayer({
    'id':'trees',
    'type':'circle',
    'source':'trees_data',
    'paint':{
      'circle-radius':4,
      'circle-color': '#349f27',
      'circle-opacity':0.7
    },
  })
  // define a 'source' for your polygons dataset
  map.addSource('buildings',{
    'type':'geojson',
    'data': buildings_url,
  });
  // add a new layer with your polygons
  map.addLayer({
    'id':'buildings',
    'type':'fill',
    'source':'buildings',
    'paint':{
      'fill-color':'#888888',
      'fill-outline-color':'#000000'
    }
  });

});
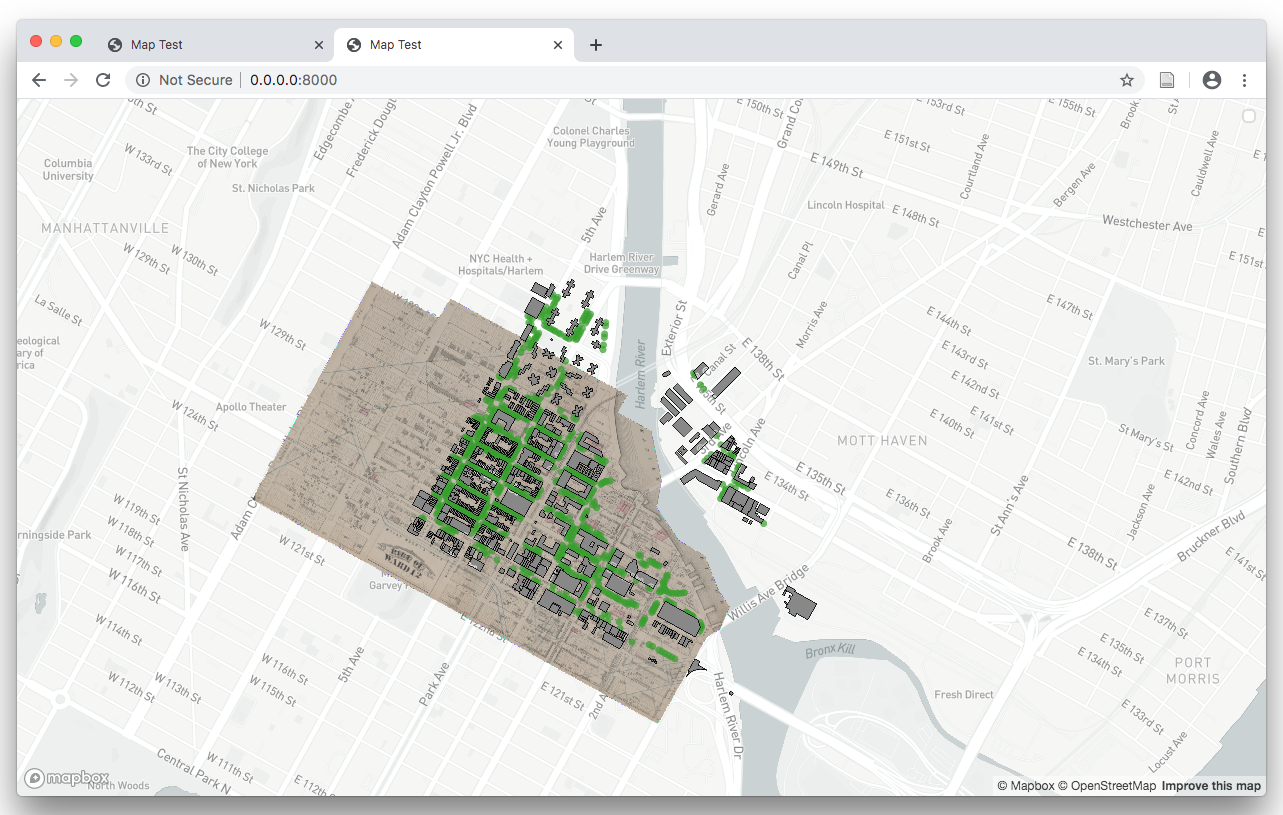
And your map will look like this:
Adding raster data from a file
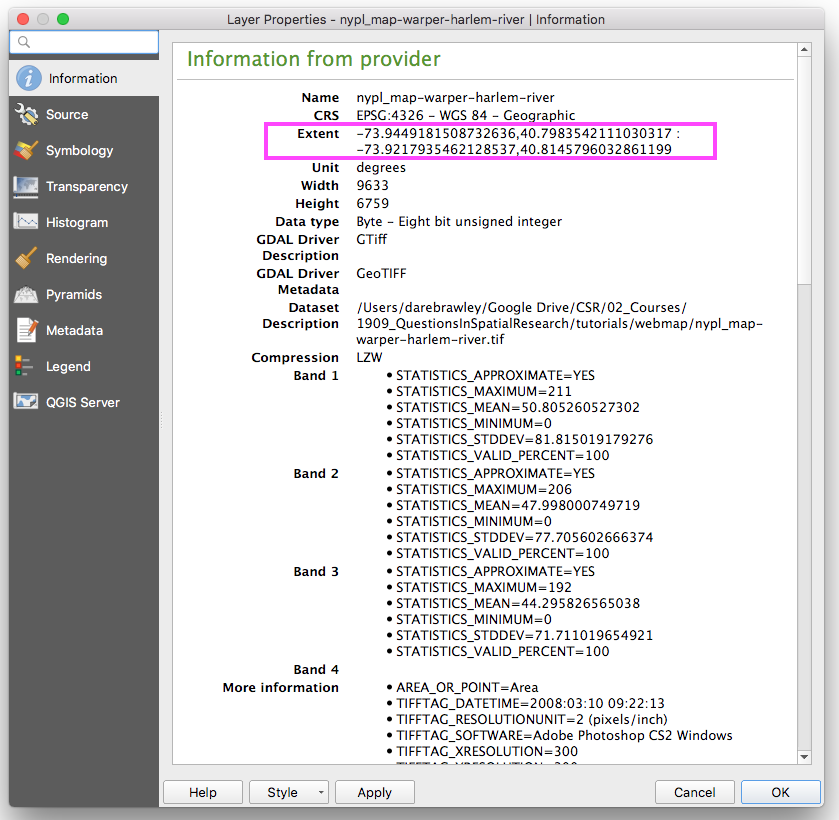
First identify an image you would like to use, georeference it if it is not already georeferenced. In this example we will use the map of the Harlem River from the New York Public Library collection that you use in tutorial 1.
Open your raster dataset in QGIS, double click on the layer name in the layers menu to open and view the layer properties panel. Select the information tab. Copy the Extent listed. These are the latitude and longitude coordinates of the bottom left and top right corner of your image – you will need these to define the coordinates of your raster dataset in your web map.
Next open your georeferenced raster dataset in an image editor (like Preview or Photoshop or Photos or Microsoft Paint) save it in a .png or .jpg file format. GeoTIFF files are often quite large so you may also want to downsample the image to make it a smaller file size.
Note by saving the raster dataset as a .png or .jpg image we are removing its spatial reference. Thus if you were to open either the .png or .jpg file in QGIS the program would no longer know where on the earth’s surface the raster is situated. We do this because when we create the image overlay in our web map we will also specify the spatial reference using javascript to tell our web map the coordinates of all four corners of the raster dataset.
Save this .png or .jpg version of your raster dataset in the data folder for your website.
To add this image to your map you will now again define a new source and a new layer with in map.on('load'). This time the source will be the new .png or .jpg image you just saved and we will define the extents of each of the four corners of the image.
map.addSource('bronx_map',{
  'type':'image',
  'url': './data/nypl_map-warper-harlem-river.jpg',
  'coordinates': [
    [-73.9449181508732636,40.8145796032861199],
    [-73.9217935462128537,40.8145796032861199],
    [-73.9217935462128537,40.7983542111030317],
    [-73.9449181508732636,40.7983542111030317],
  ]
});
map.addLayer({
  'id':'map_overlay',
  'type':'raster',
  'source':'bronx_map',
  'paint':{
    'raster-opacity':0.85
  }
});
A note on the coordinates: the order that you include these matters. Mapbox expects to see coordinate in the following order:
[
  [top left longitude, top left latitude],
  [bottom left longitude, bottom left latitude],
  [bottom right longitude, bottom right latitude],
  [top right longitude, top right latitude],
]
If you are using your own example you can derive all of these coordinate from the extents you copied from the georeferenced raster layer information panel in QGIS. Remember the extents given by GIS correspond to the bottom left and the top right and are listed as longitude, latitude.
Save your map.js file. Reload your browser window. Your new map will have been overlaid.
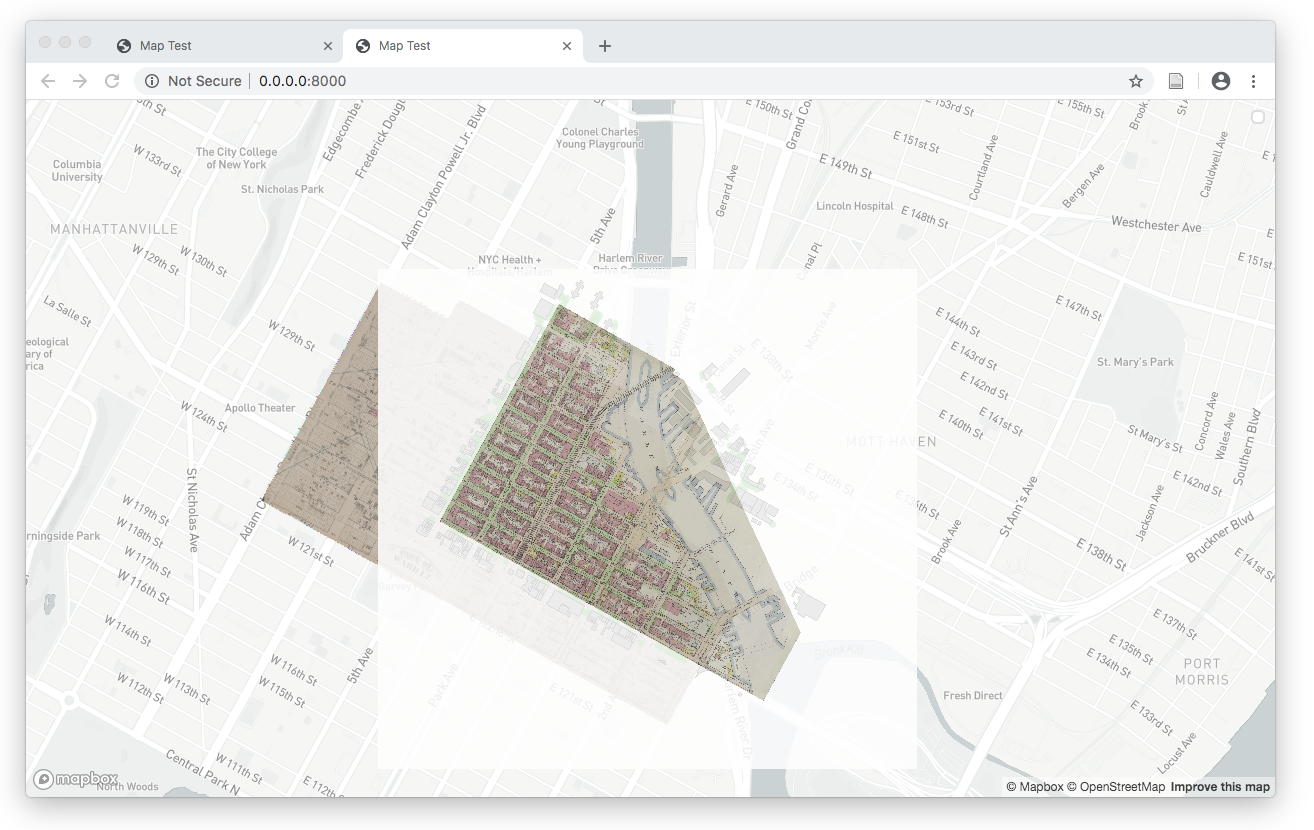
The second NYPL map is coterminous with the first map overlay. Choose one to display and “comment out” the other one by placing // in front of each line of code. These // tell the browser to ignore any code on that line.
// map.addSource('bronx_map',{
//   'type':'image',
//   'url': './data/nypl_map-warper-harlem-river.jpg',
//   'coordinates': [
//     [-73.9449181508732636,40.8145796032861199],
//     [-73.9217935462128537,40.8145796032861199],
//     [-73.9217935462128537,40.7983542111030317],
//     [-73.9449181508732636,40.7983542111030317],
//   ]
// });
// map.addLayer({
//   'id':'map_overlay',
//   'type':'raster',
//   'source':'bronx_map',
//   'paint':{
//     'raster-opacity':0.85
//   }
// });
Once you have created an map that you like lets publish it online by pushing our changes to GitHub. Open your terminal or command prompt. Make sure you are within the folder where you created your web map (in our case webmap_1).
- Type
git add -Ato ‘track’ all of the changes you made. - To commit your changes type
git commit -m "some note about the changes you made"and replace the information within the quotes with some note to yourself about the changes you made. - Then push your changes to the server by typing
git push.
Visit your repository website at yourgithubusername.github.io/webmap_1 to check that all changes were pushed correctly.
Adding Interactivity
After completing the above portions of this tutorial you now should have a functioning web map. Congrats! With the help of some Javascript, we managed to get something similar to our QGIS static map onto the web by defining its content (raster and vector data) and style (symbology). Here we’ll start to look at where Javascript really shines: defining behavior, interactivity and change over time in your web map.
About Events
One of the simplest forms of interactivity is to have something happen when you click an element on the page, or in this case, our map. Javascript uses the concept of events to define this kind of behavior. This is a two-part approach: you first need to designate an element on your page as an event listener, then provide instructions in the form of an event handler that say what to do when the event takes place. A basic example would look something like this:
// listen for 'onclick' events from 'handler-element'
document.getElementById('handler-element').onclick = handleEvent;

// say how to handle the events that are fired by the listener
function handleEvent(e) {
  console.log("an event happened")
}
Once the browser loads this bit of code, every time the user clicks a page element with the given ID an event will be fired and the code inside the event handler will be executed. We’re not using it here but notice that the event handler is being passed an object e that we can use to get information about the element being clicked, where the cursor was on the screen at the time, and other useful things.
This is a good start but it’s not going to get us very far when we’re dealing with even a modestly-sized collection of map data. Consider the street trees we added to our web map in the last tutorial. If we wanted to create a pop-up label with the tree species every time a different tree was clicked, how would we do it?
Doing this with the pattern described above, we’d need to first create event listeners on each individual point. Even though we’d be able to reuse the same event handler function for each one, it’d also be a lot of work to, say, create a pop-up with the species name of the tree each time it was clicked. We’d need to first unpack the e object to access the properties of the clicked element, then relate it somehow to the original dataset, traverse the list of properties and get the value of the species name - all that before even starting to think about how to create and style a new page element with the name written in it, and to give ourselves some mechanism to make it go away once we don’t want it anymore.
Making Popups on Click Events with Mapbox GL
Fortunately, Mapbox GL provides us with a bunch of readymade objects and functions so we don’t need to reinvent the wheel. Remember from last time that in order to create a map on our page we’re making a new Map object using the library. We used on('load', ...), which is an all-in-one event listener and handler, addSource() and addLayer() functions that are part of the Map object to describe and render the map. We can use different versions of that same on() function to automatically create event patterns for every element in a map layer, and Mapbox’s Popup object can help us with creating the pop-up itself. Copy and paste the following sample code into your map.js file:
// when the user does a 'click' on an element in the 'trees' layer...
map.on('click', 'trees', function(e) {
  // get the map coordinates of the feature
  var coordinates = e.features[0].geometry.coordinates.slice();
  // get its species name from the feature's attributes
  var species = e.features[0].properties.spc_common;

  // and create a popup on the map
  new mapboxgl.Popup()
  .setLngLat(coordinates)
  .setHTML(species)
  .addTo(map);
});

// make the cursor a pointer when over the tree
map.on('mouseenter', 'trees', function() {
  map.getCanvas().style.cursor = 'pointer';
});

// back to normal when it's not
map.on('mouseleave', 'trees', function() {
  map.getCanvas().style.cursor = '';
});
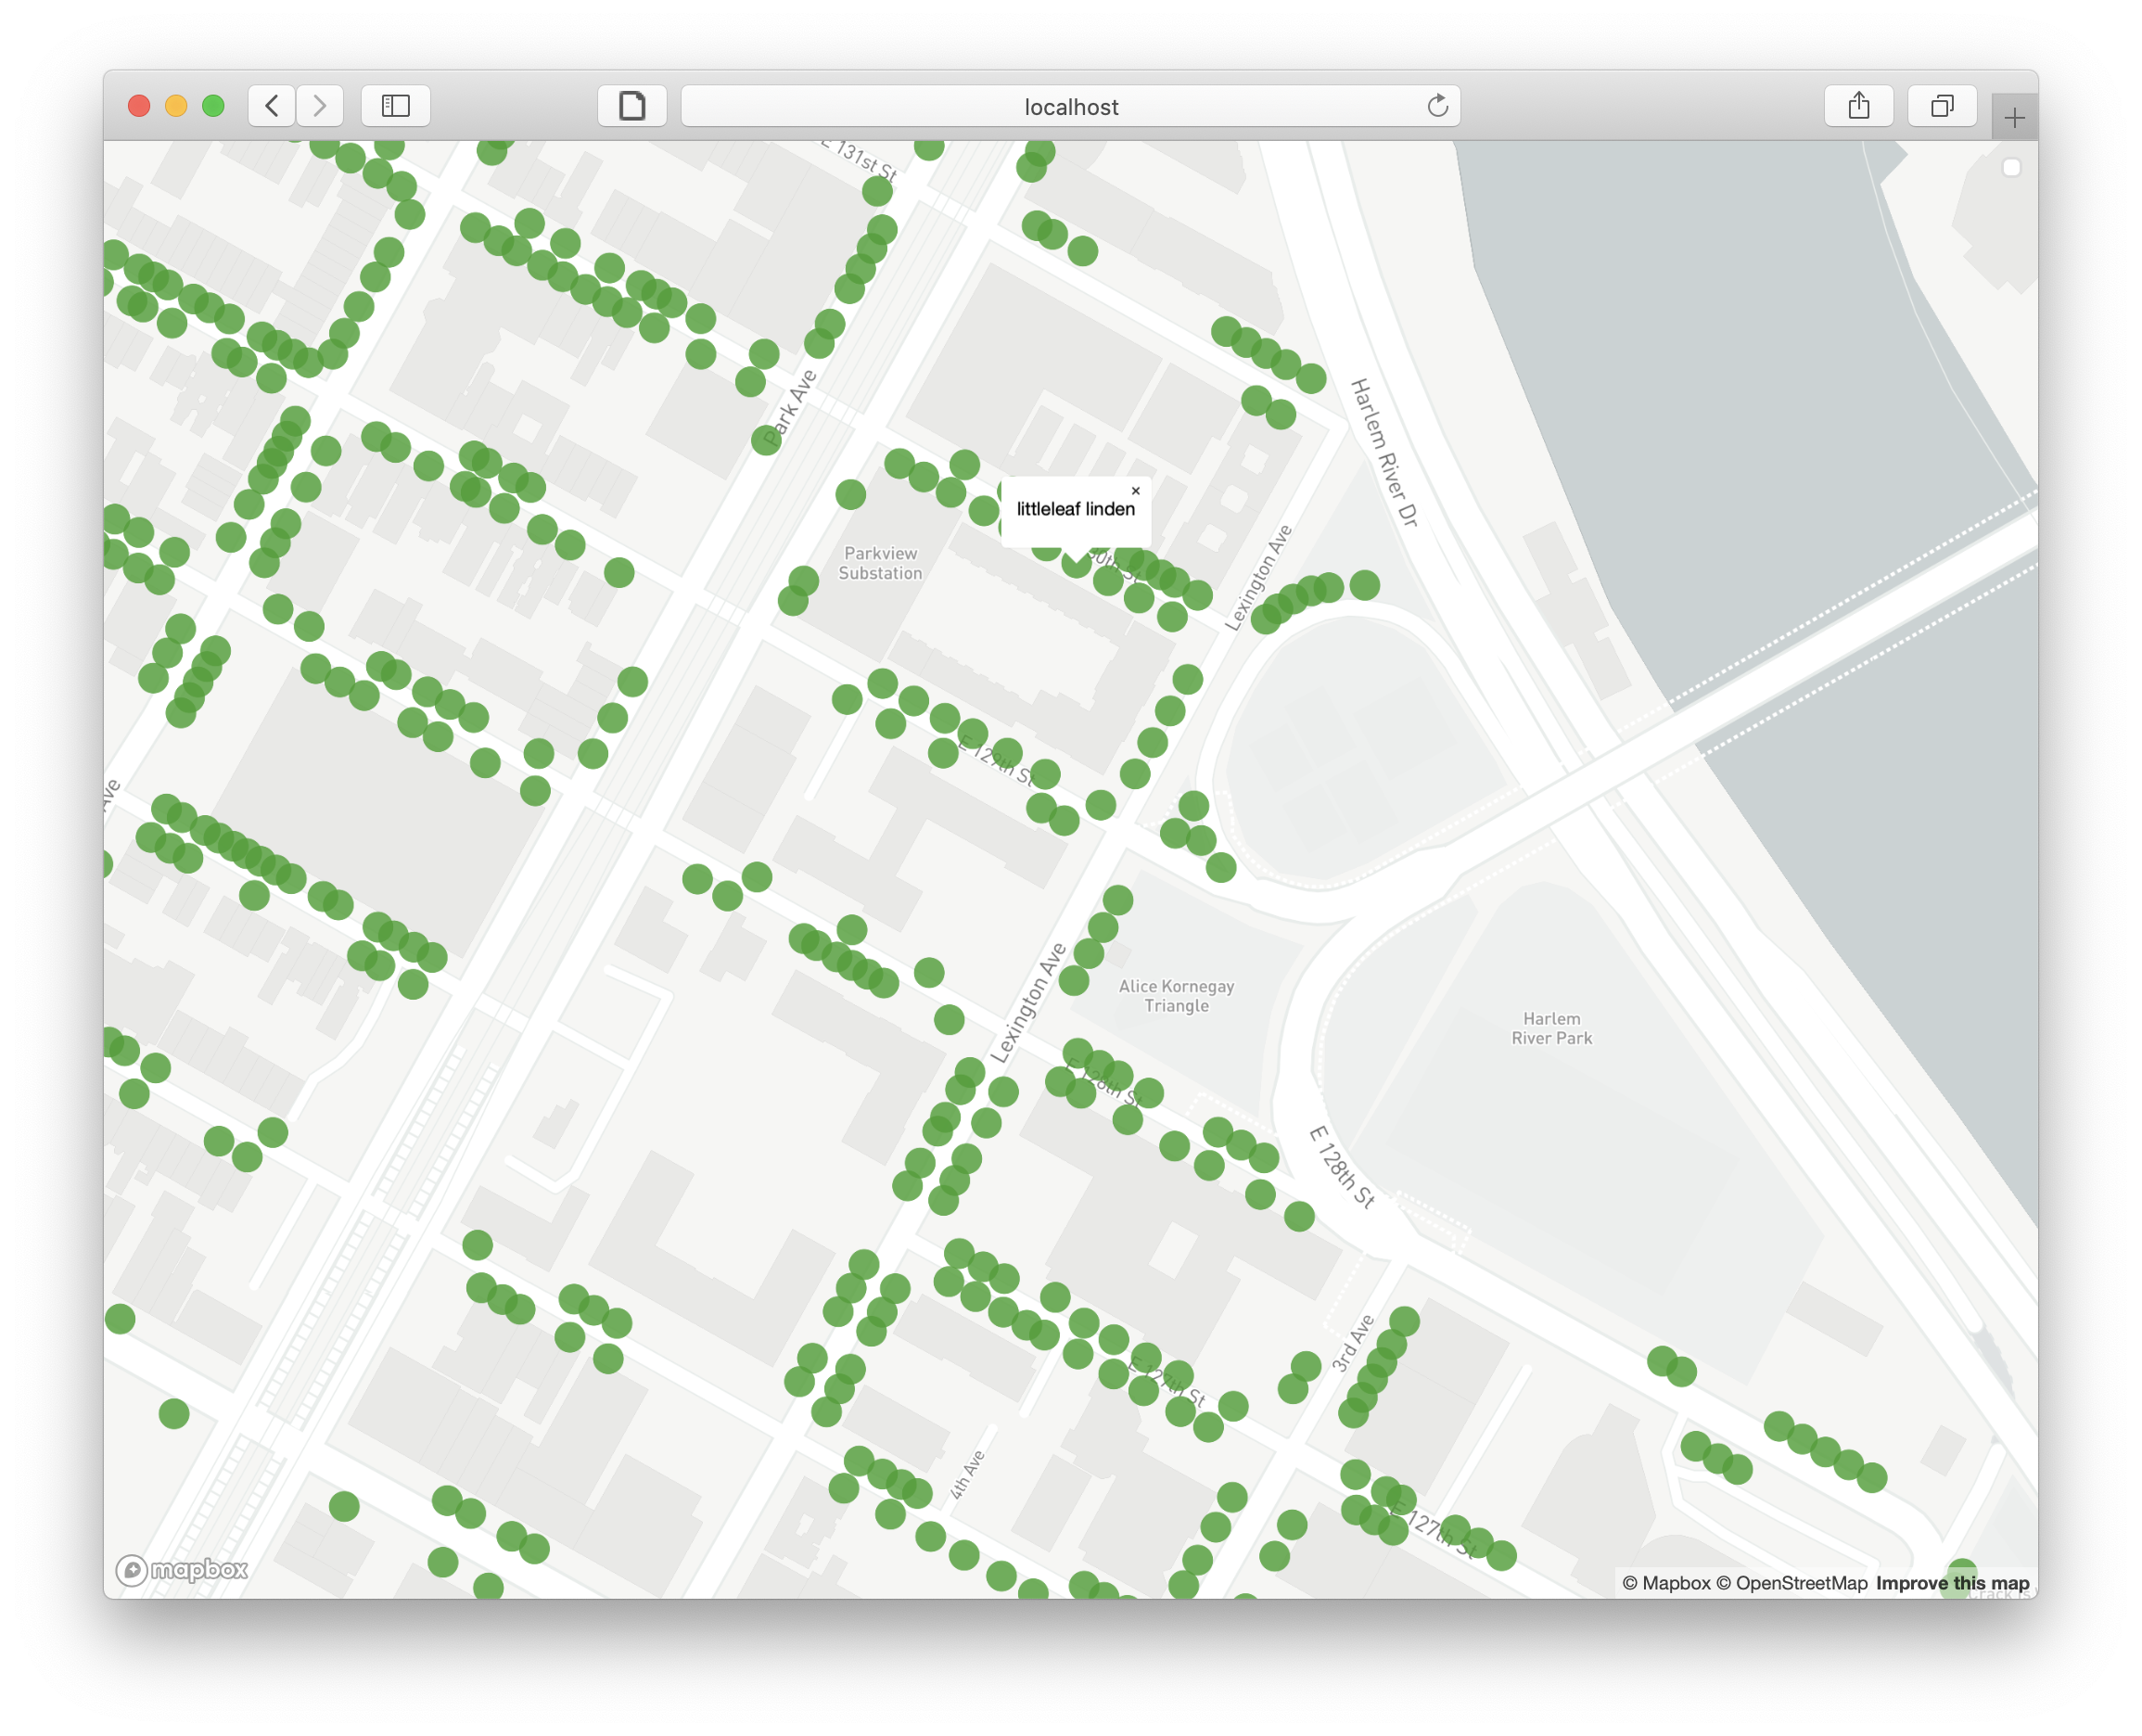
Now you should see a popup appear with the tree’s species name whenever you click a tree on the map. Clicking another tree or clicking the ‘x’ on the popup should make the last popup disappear. Not bad for a couple lines of code. Notice that we can also control the appearance of the cursor to give the user a hint that some kind of interactivity is now built into the tree symbols. Thanks to the features in the library, we’re able to do a surprising amount of work with just a couple of lines of code.
Other Mapbox GL Examples
Now that we’ve seen the basics of how to define map behavior using functions in the Mapbox GL library, you can experiment with some of the many examples they provide and try to adapt them to your map. Here are a few suggestions:
- You can adjust the opacity of a raster layer using the
valueproperty of a targeted slider to as an input to the map’ssetPaintProperty()function. Note that this example uses the plain Javascript event pattern outlined above since the behavior is for a single element outside of the map itself. - Or you can animate features on the map using two custom functions - one that defines position as a function of time and another which steps through frames of an animation, updating the position of an element with
Map.getSource(...).setData(...)each time it runs. - Or animate the ‘camera’ with the
flyTo()function which gradually changes thecenterandzoomproperties of theMapover time.
Using API Documentation
As you start thinking about how you might want to develop your map further, you’ll want to know more about what else you can do with MapboxGL. At a certain point, working through examples and tutorials will cease to be useful and you’ll want a more direct way to explore what’s available. Fortunately, every legitimate Javascript library comes with a catalog in the form of its API documentation. Sometimes you’ll see this referred to as “the docs” for short, and it’s always going to be the most detailed, comprehensive, up-to-date, and accurate source for information on the contents of a given library and how it’s meant to be used.
All of the objects, functions and properties in the library will be listed and described, often with examples, in a single online resource. So for example, if you wanted more details on how the flyTo function in the last example, you’d find it here under the instance members of the Map object. Not all API docs will do this, but Mapbox includes both links to related examples and short code snippets, which makes it even easier to learn. Feel free to explore this at your own pace and try adding some additional functionality to your map if you have the time and interest.
Tutorial by Dare Brawley, Spring 2020.
Adapted from tutorial written by Brian House for Mapping for Architecture, Urbanism, and the Humanities, Fall 2018.