Methods in Spatial Research Spring 2021
Making Data From Observation & Sensing
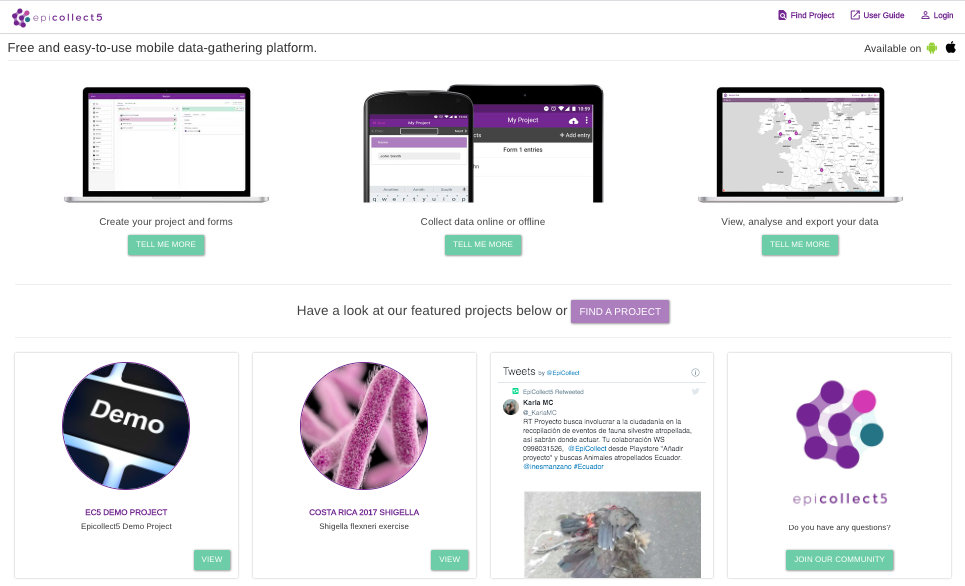
Observation and sensing can be powerful ways to capture spatial qualities that are not already packaged as readily available datasets. In this tutorial, you will learn how to create your own data through observation, using the GPS recievers on phones to capture the latitude and longitude coordinates of points linked to any attribute fields of your choosing. To do so, we will be using Epicollect 5, a free and easy-to-use web and mobile data-gathering platform. You can access a full user’s guide to Epicollect 5 here.
For the purposes of this tutorial, we will demonstrate data collection for a project documenting grafitti in Soho, Manhattan during the summer of 2020.
Setting Up Your EpiCollect 5 Account and Project
Go to the Epicollect 5 Website and click log in on the top right corner. When redirected to the sign in page, use your columbia email to set up your account.
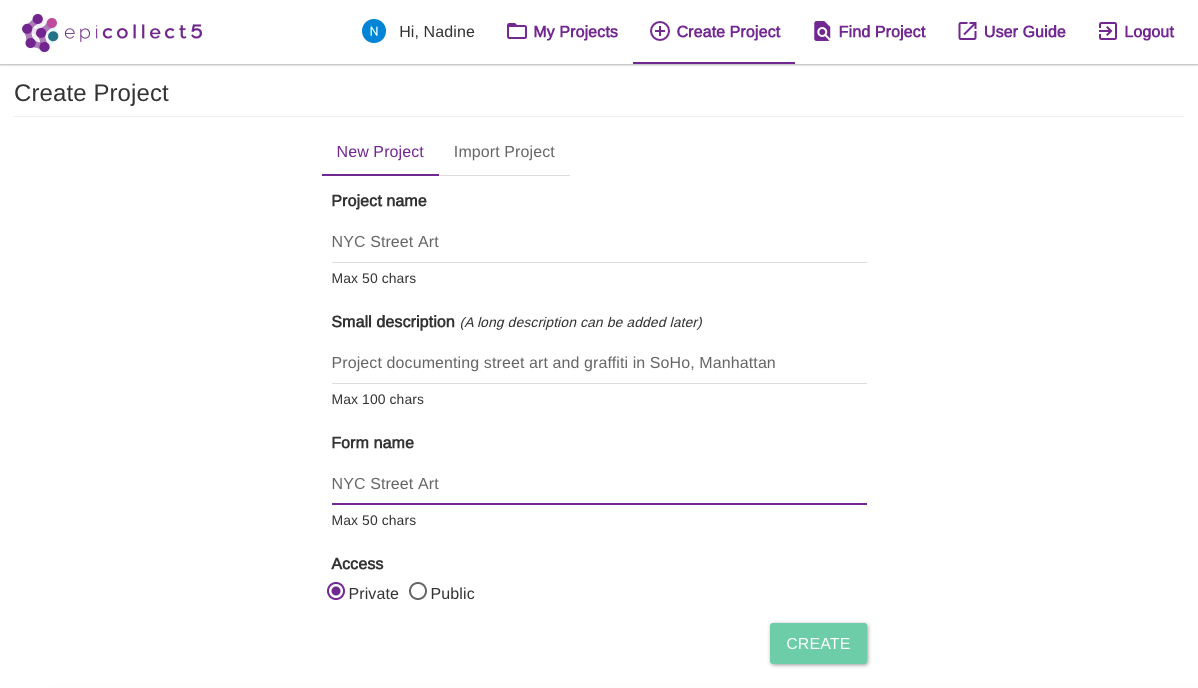
Once you have logged in, click Create Project from the top menu, and start to fill out the form with essential information describing your project. Keep the access settings to private.
Now, you will be redirected to the project dashboard. From the dashboard’s left hand menu, you will be able to manage the Details of the project, access the Form Builder, collaborate with users using Manage Users, and access your collected data from Mapping Data, among other things. First we will create the form that will define what data we are trying to collect.
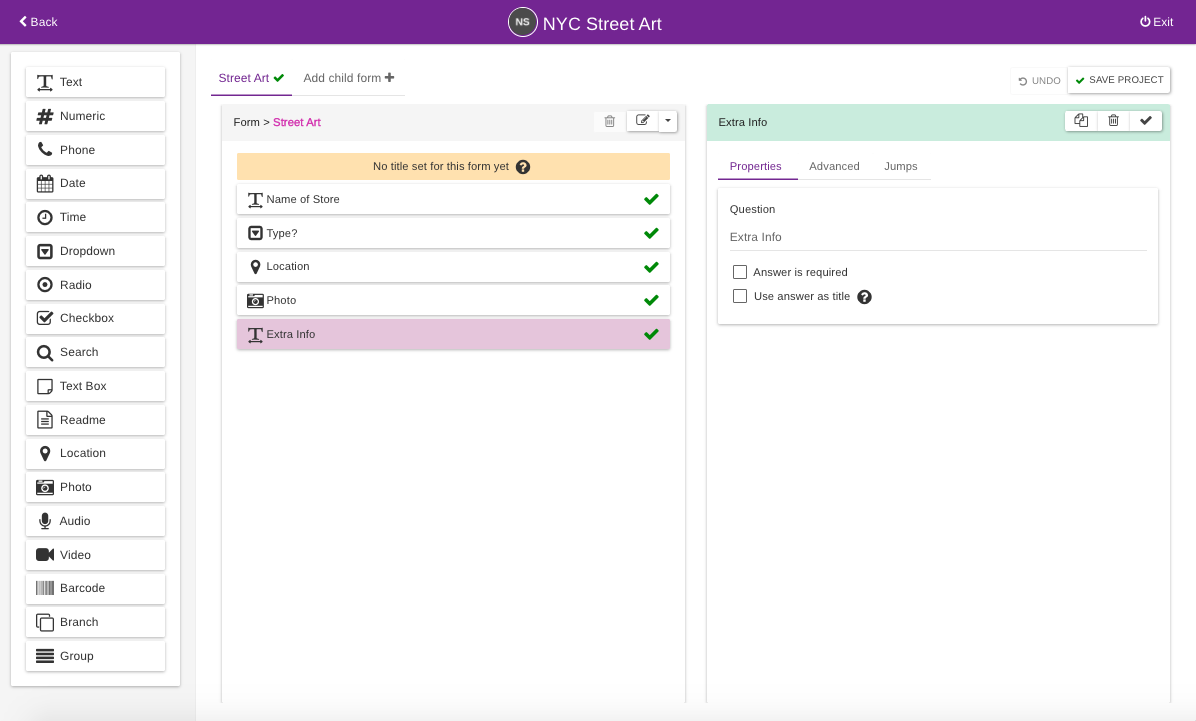
Click on the Form Builder tab, and you will be redirected to a the page below. Here is where you will be specifying the fields in the attribute table of the dataset you are creating. Notice that the options on the left define what types of data you can collect. The most important thing to remember is you always need a Location tab on your form: this capture latitude and logitude coordinates of your location through GPS, and will allow you to later export your data.
Now drag and drop elements from the list to build your form, defining the elements for each as you go along. For the street art project, we will include the following elements: (1) Text to indicate the name of the store, (2) Dropdown to identify whether the street art is a mural or a detail (poster, sticker, etc), (3) Location to identify coordinates, (3) Photo to allow a photo of the street art, (4) Text to record additional information. After you are done, make sure to Save Project.
You can build the form to cater to the needs of your specific project. For further documentation, see the EpiCollect5 formbuilder page. Once your done building your form, you can start collecting data using your phone!
Collecting Data with EpiCollect Mobile App
Now, using your phone, download the EpiCollect 5 Mobile App. You can check Android and iOS compatability here.
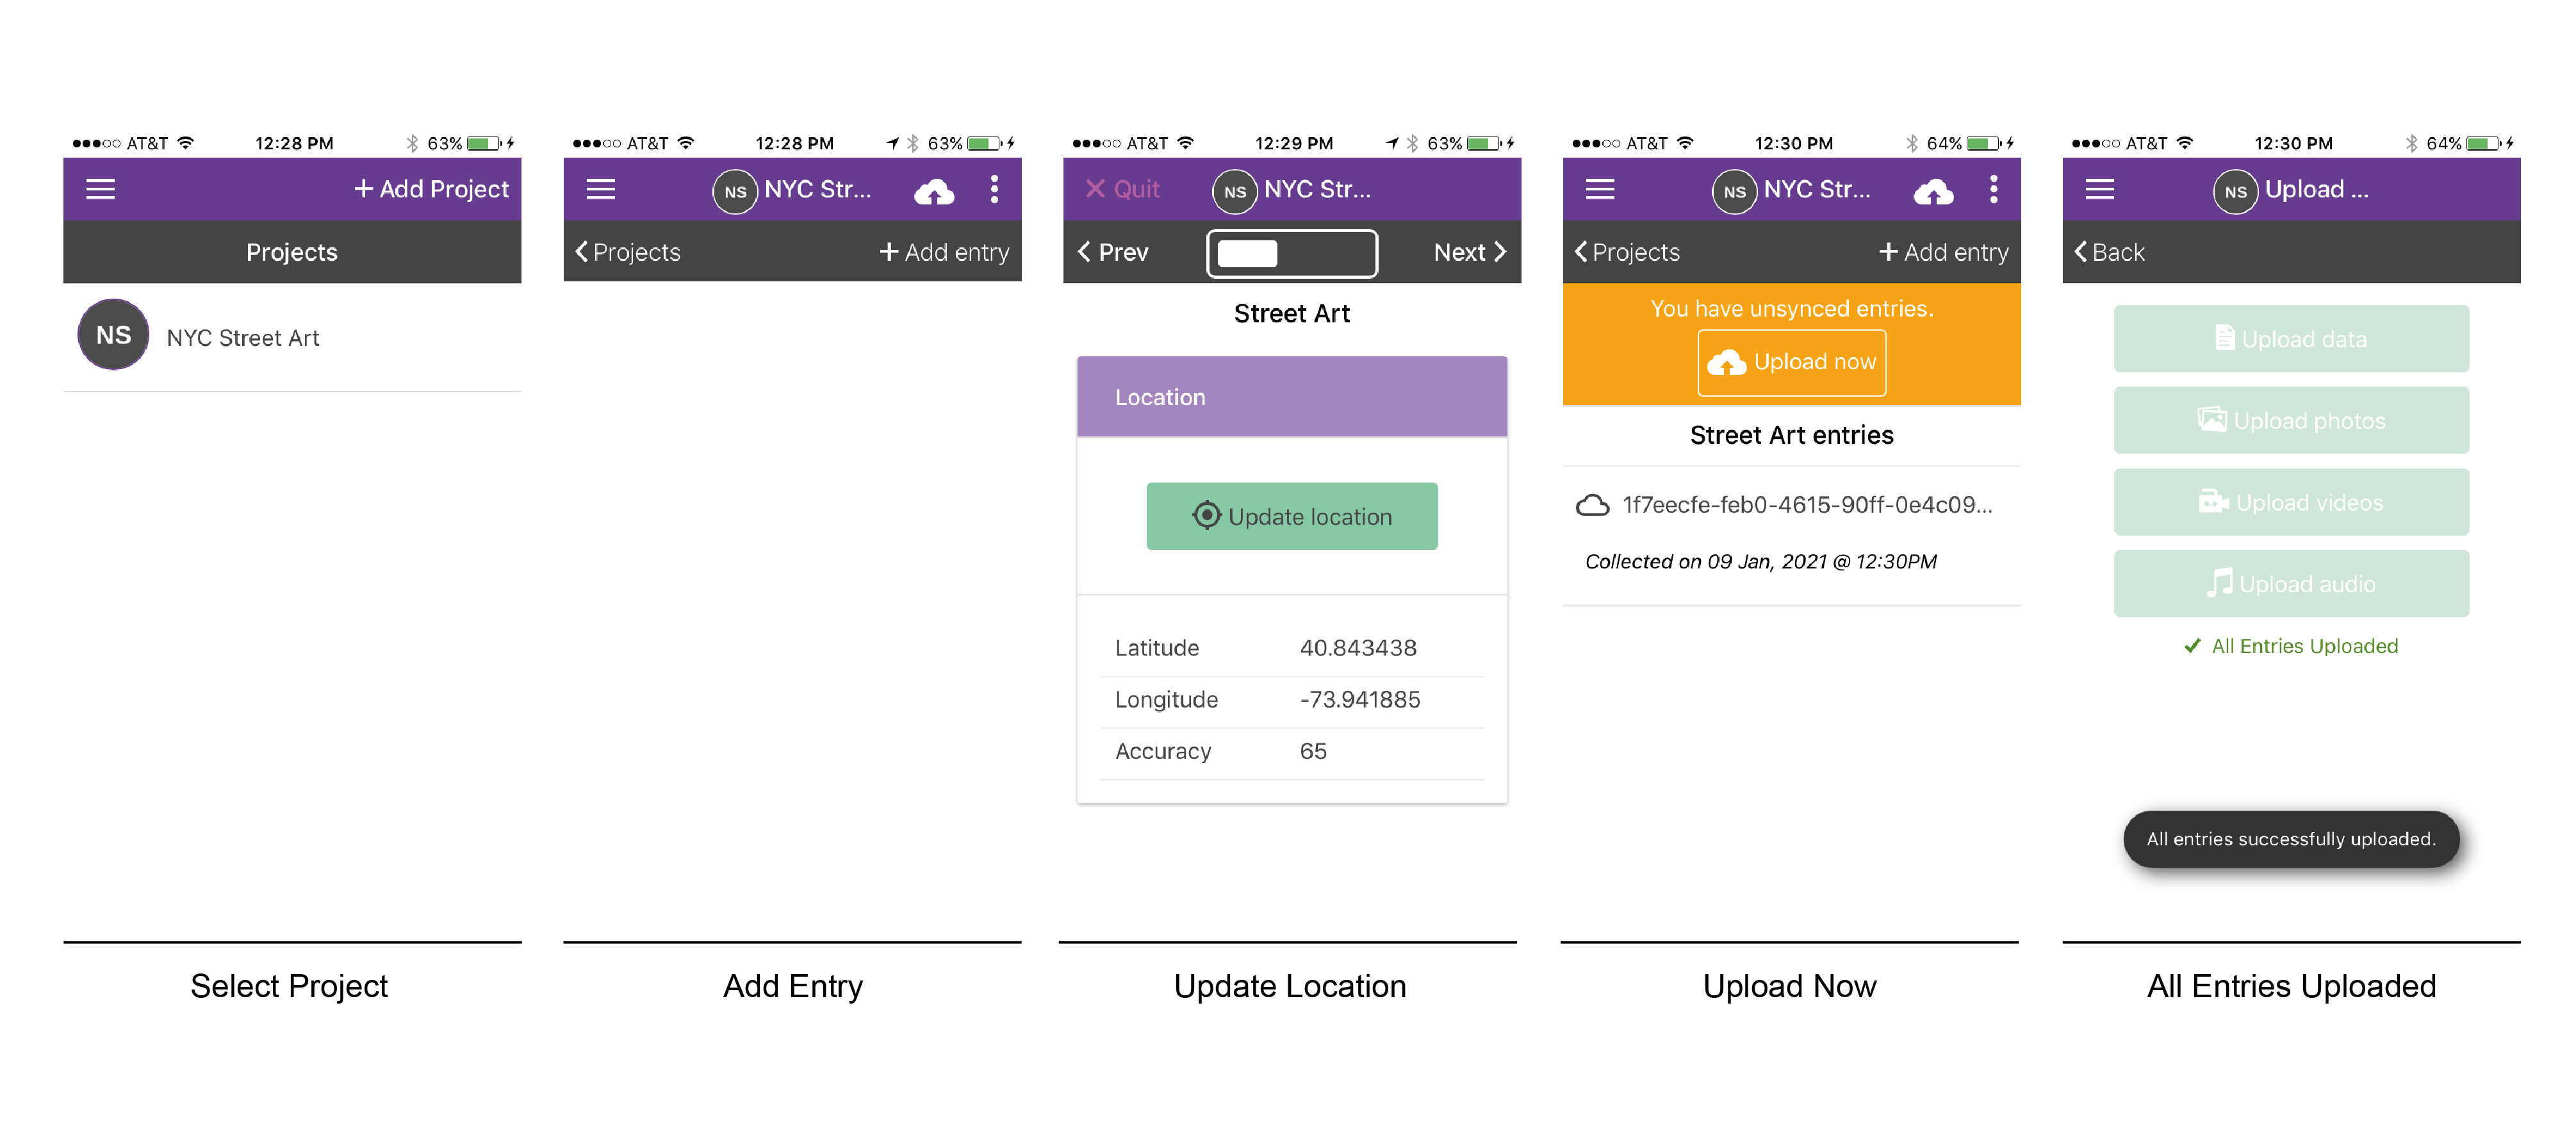
Log in to your account using the same email you used on the desktop application. Then, you should be redirected to your Projects, and your form should appear. Click on your project, and now you can start collecting data using Add Entry.
For each entry, which corresponds to a seperate observation on the ground, in our case, an individual mural, you will have to fill in all the fields you built with your form. Specifically for the Location entry, after clicking Update Location, make sure that the accuracy does not exceed about 200. If your accuracy is something like 1500, click Update Location again to capture a more accurate reading.
Once you are done with your fieldwork, collecting all your entries, to click Upload Now and go through uploading all data types untill you get the message All entries successfully uploaded.
Now, all your entries can be accessed and downloaded from the desktop application, to which we will return.
Accessing data from Epicollect 5 Desktop
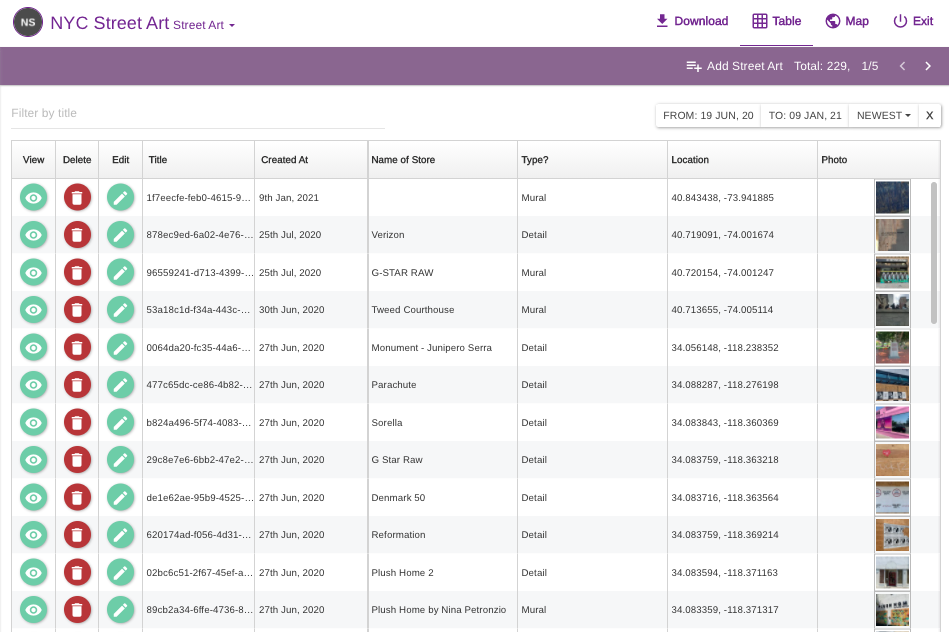
Now, back to EpiCollect Desktop. Navigate to my project, and click on your project. After you have uploaded data, you will be able to access Details, which will allow you to return and edit the formbuilder and other project settings, or View Data, where you can explore the dataset you’ve constrcted. Click View Data, which will allow you to explore your data as a Table, where you can view edit, and delete entries using the icons corresponding to each entry.
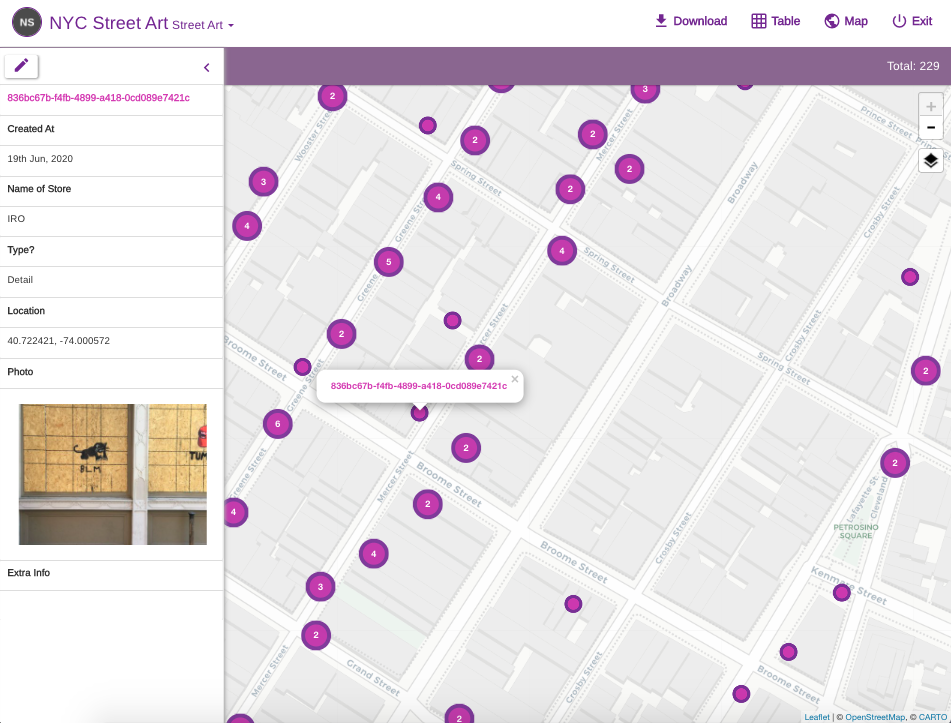
Or, you can explore your project as a Map, where you can begin to explore spatial trends in the data.
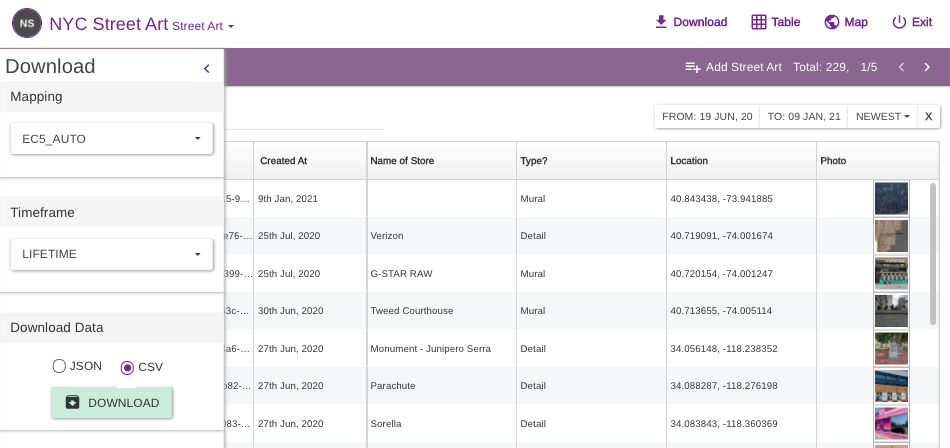
Lastly, you can Download your data as a .csv or .JSON file. Download it as a .csv and you will be ready to import it into QGIS, following steps in tutorial 2.
Tutorial Deliverable:
There is not a separate tutorial deliverable for this week – you will just need to use what you learned here to complete Assignment 2
Tutorial by Nadine Fattaleh, Spring 2021.