Is the stadium a catalyst for gentrification?
Abstract
This study delves into the intricate relationship between sports stadium developments and the phenomenon of gentrification in surrounding neighborhoods, with a focused investigation on the area around SoFi Stadium in Los Angeles. Employing unsupervised machine learning techniques, particularly K-means clustering, this research aims to discern patterns of gentrification that unfold in the wake of sports stadium construction. By analyzing demographic and economic data from the American Community Survey (ACS) spanning before and after the stadium’s construction (2016-2022), the study endeavors to offer an objective, data-driven perspective on how such mega-developments influence local communities.
Data
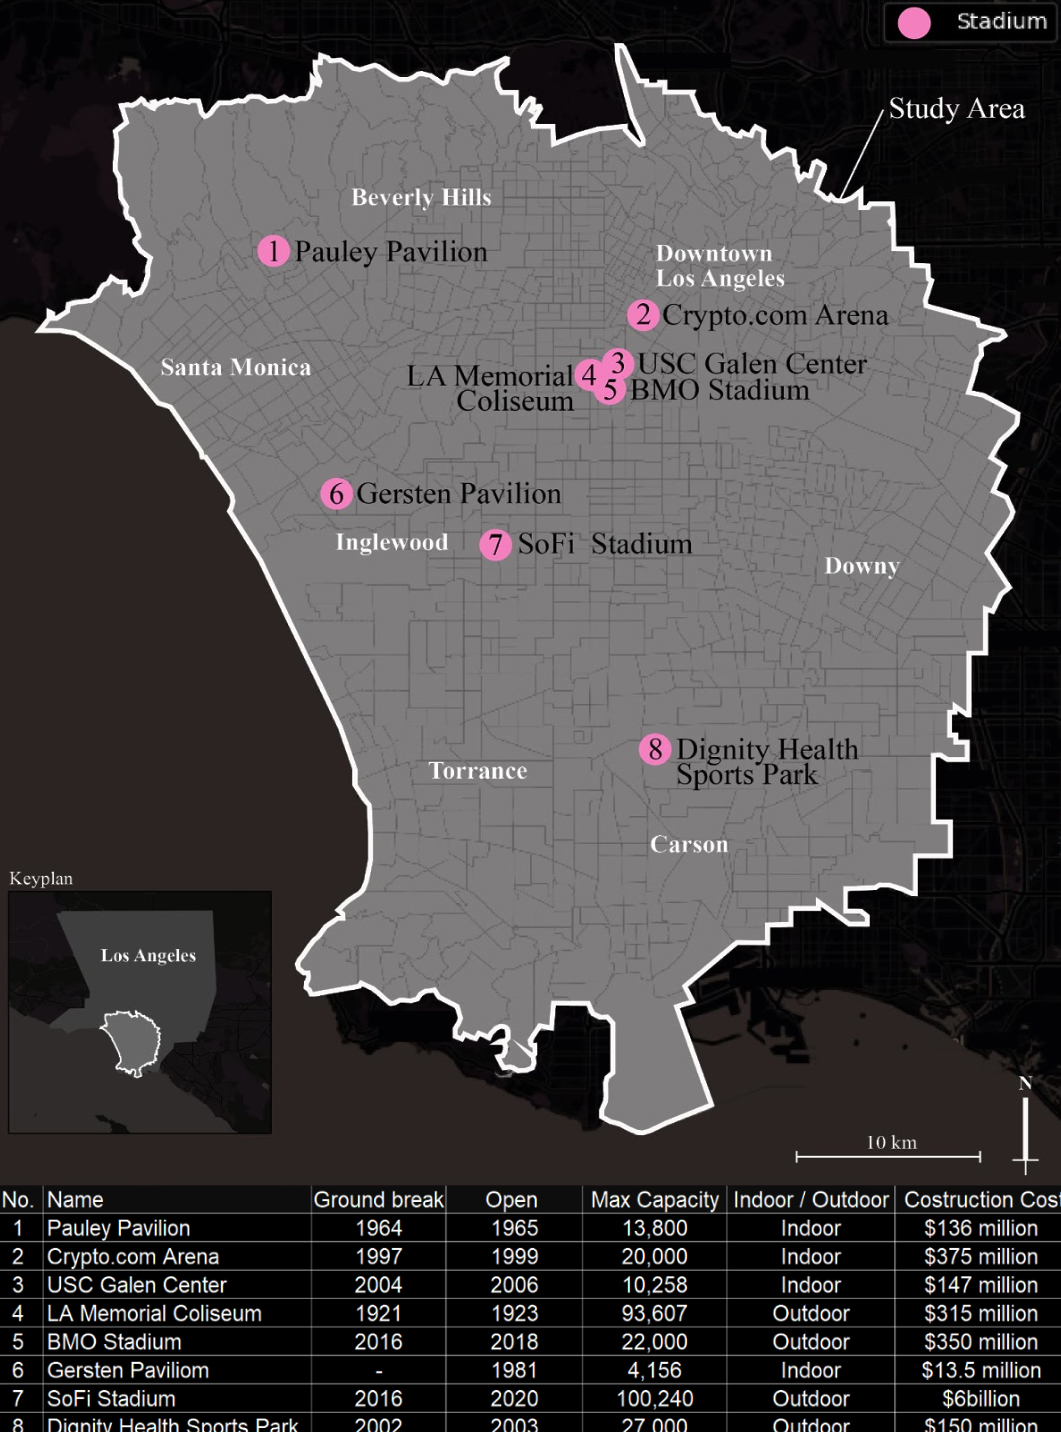 Data collection focused on the period from the start of SoFi stadium construction in 2016 through 2022,when the stadium was completed. The study concentrated on census tracts in and around the stadiums that existed within a 20-km radius in order to assess differences in gentrification progression patterns between the newly constructed SoFi stadium and other existing surrounding stadiums. This research uses a dataset of location of sports venues provided by County of Los Angeles and a total of eight sports stadiums and arenas within the area were included in the study. These eight stadiums span the districts of Inglewood, Downtown Los Angeles, and Carson, and differ in terms of construction period and cost, capacity, and indoor or outdoor. This selection reflects the intent to capture a snapshot of diverse public infrastructure investments across different neighborhoods in the study area. The span
ranges from the LA Memorial Coliseum, opened in 1923, to the technologically advanced SoFi Stadium in 2020. In terms of capacity and cost, the data exhibits a significant range, from the modestly sized Gersten Pavilion, capable of holding 4,156 patrons with $13.5 million cost, to the expansive SoFi Stadium, which can host a crowd of 100,240 with $6 billion construction costs.
Data collection focused on the period from the start of SoFi stadium construction in 2016 through 2022,when the stadium was completed. The study concentrated on census tracts in and around the stadiums that existed within a 20-km radius in order to assess differences in gentrification progression patterns between the newly constructed SoFi stadium and other existing surrounding stadiums. This research uses a dataset of location of sports venues provided by County of Los Angeles and a total of eight sports stadiums and arenas within the area were included in the study. These eight stadiums span the districts of Inglewood, Downtown Los Angeles, and Carson, and differ in terms of construction period and cost, capacity, and indoor or outdoor. This selection reflects the intent to capture a snapshot of diverse public infrastructure investments across different neighborhoods in the study area. The span
ranges from the LA Memorial Coliseum, opened in 1923, to the technologically advanced SoFi Stadium in 2020. In terms of capacity and cost, the data exhibits a significant range, from the modestly sized Gersten Pavilion, capable of holding 4,156 patrons with $13.5 million cost, to the expansive SoFi Stadium, which can host a crowd of 100,240 with $6 billion construction costs.
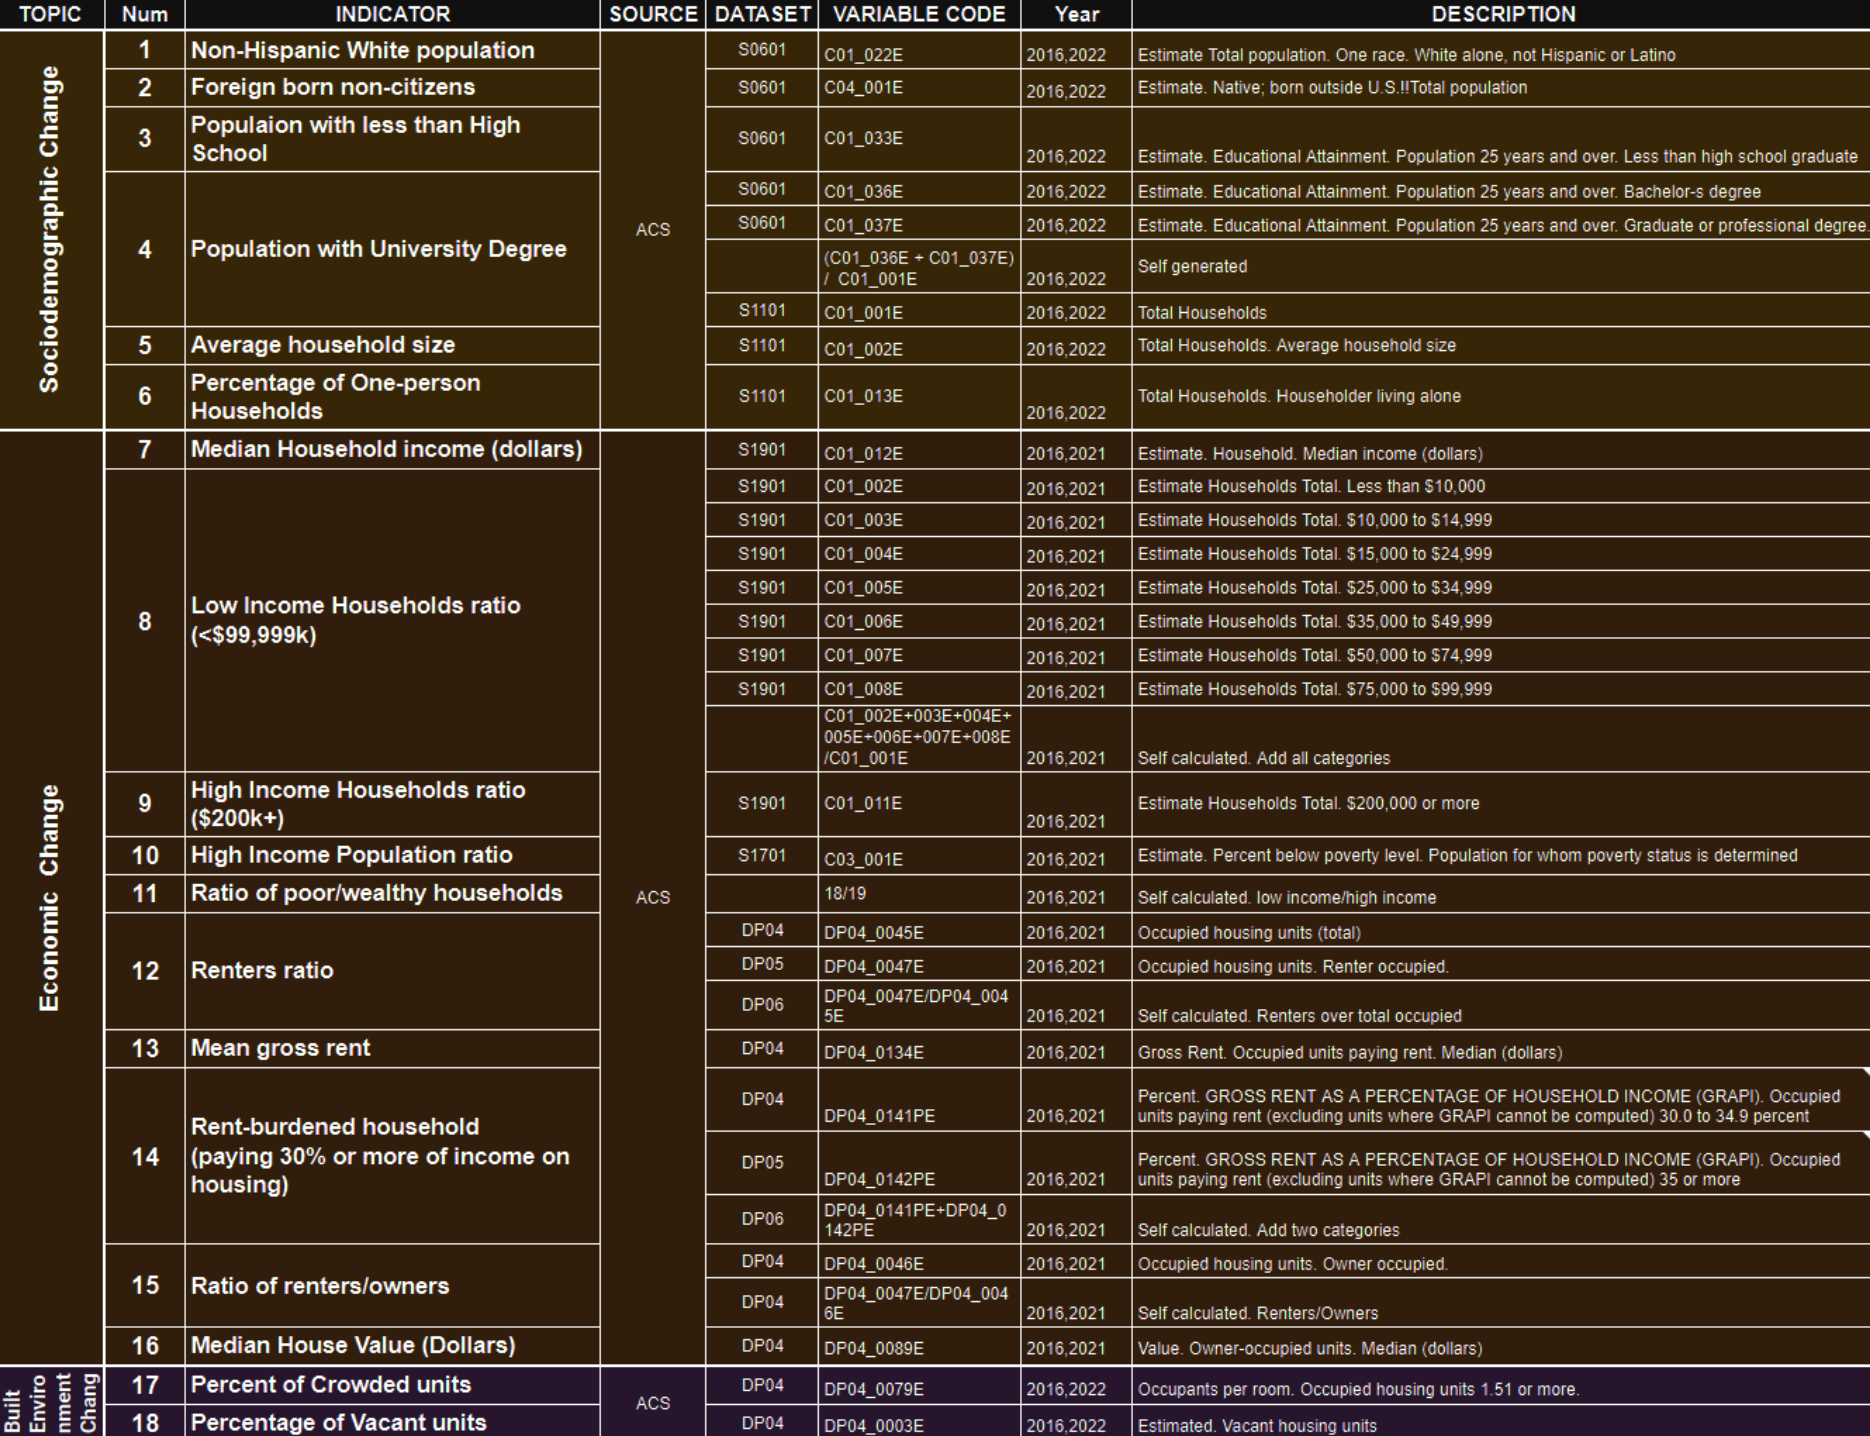 In order to analyze gentrification trends in the stadium area, we collected the highest resolution data possible. All data sources were downloaded from the ACS, which collected 30 variables from three different data topics-Socio Demographic change, Economic Change and Built Environment Change-and integrated them into 18 indicators The manipulation is important in exploring multidirectional gentrification trends (Table 2). The data collection period for each of these data topics began in 2016, with the Sociodemographic Change and Built Environment Change variables using data from the year 2022. For the Economic Change variable, data for the year 2022 was not available at the time of this research, and the latest available data for 2021 was used.
Demographic changes and stadium distances
The next step is to map the increase or decrease in indicators of gentrification in the target area and investigate the correlation of proximity to stadiums. While definitions of gentrification vary, in general, the socioeconomic characteristics of gentrification are distinct from other patterns of regional change, and are marked by increases in housing prices , socioeconomic changes, and changes in the built environment. Gentrification also differs in its characteristics depending on regional characteristics, so it is advisable to select an appropriate indicator to assess the spatial inequality of the study area. Regarding to Los Angeles gentrification study, Loukaitou-Sideris et al. (2017) employed household income, education level, percentage of renters, and racial characteristics as indicators to classify all parcels in Los Angeles County into gentrification-sensitive and -sensitive neighborhoods based on specific socioeconomic characteristics.
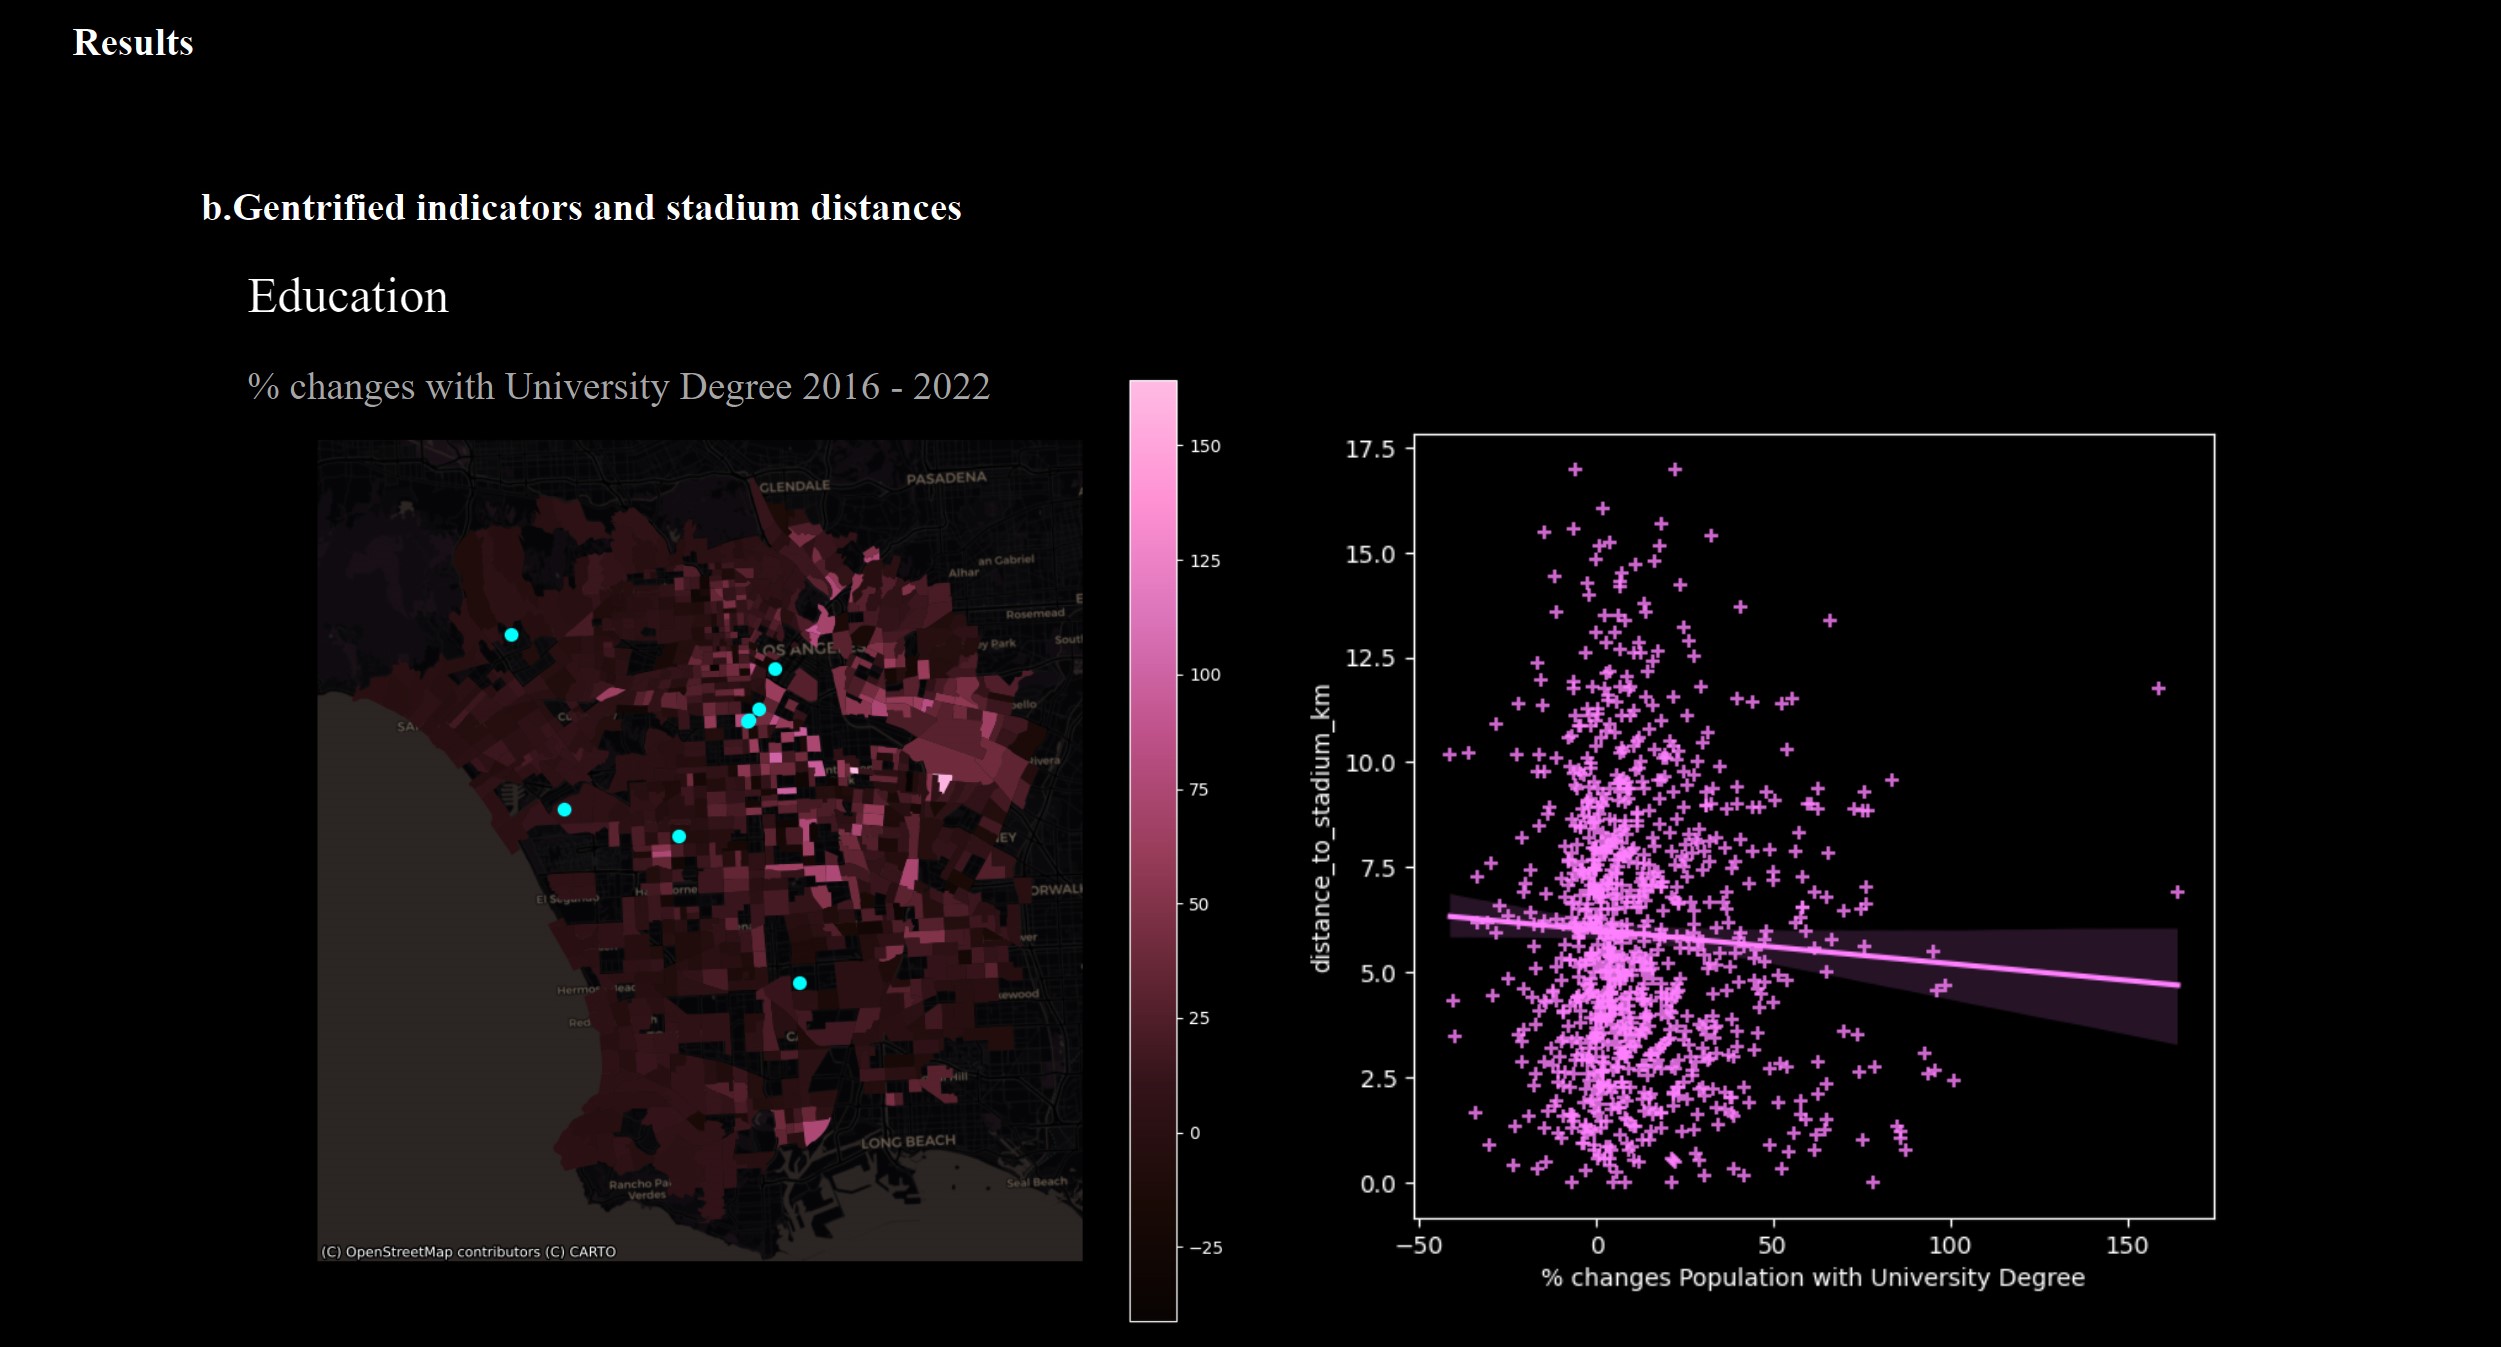
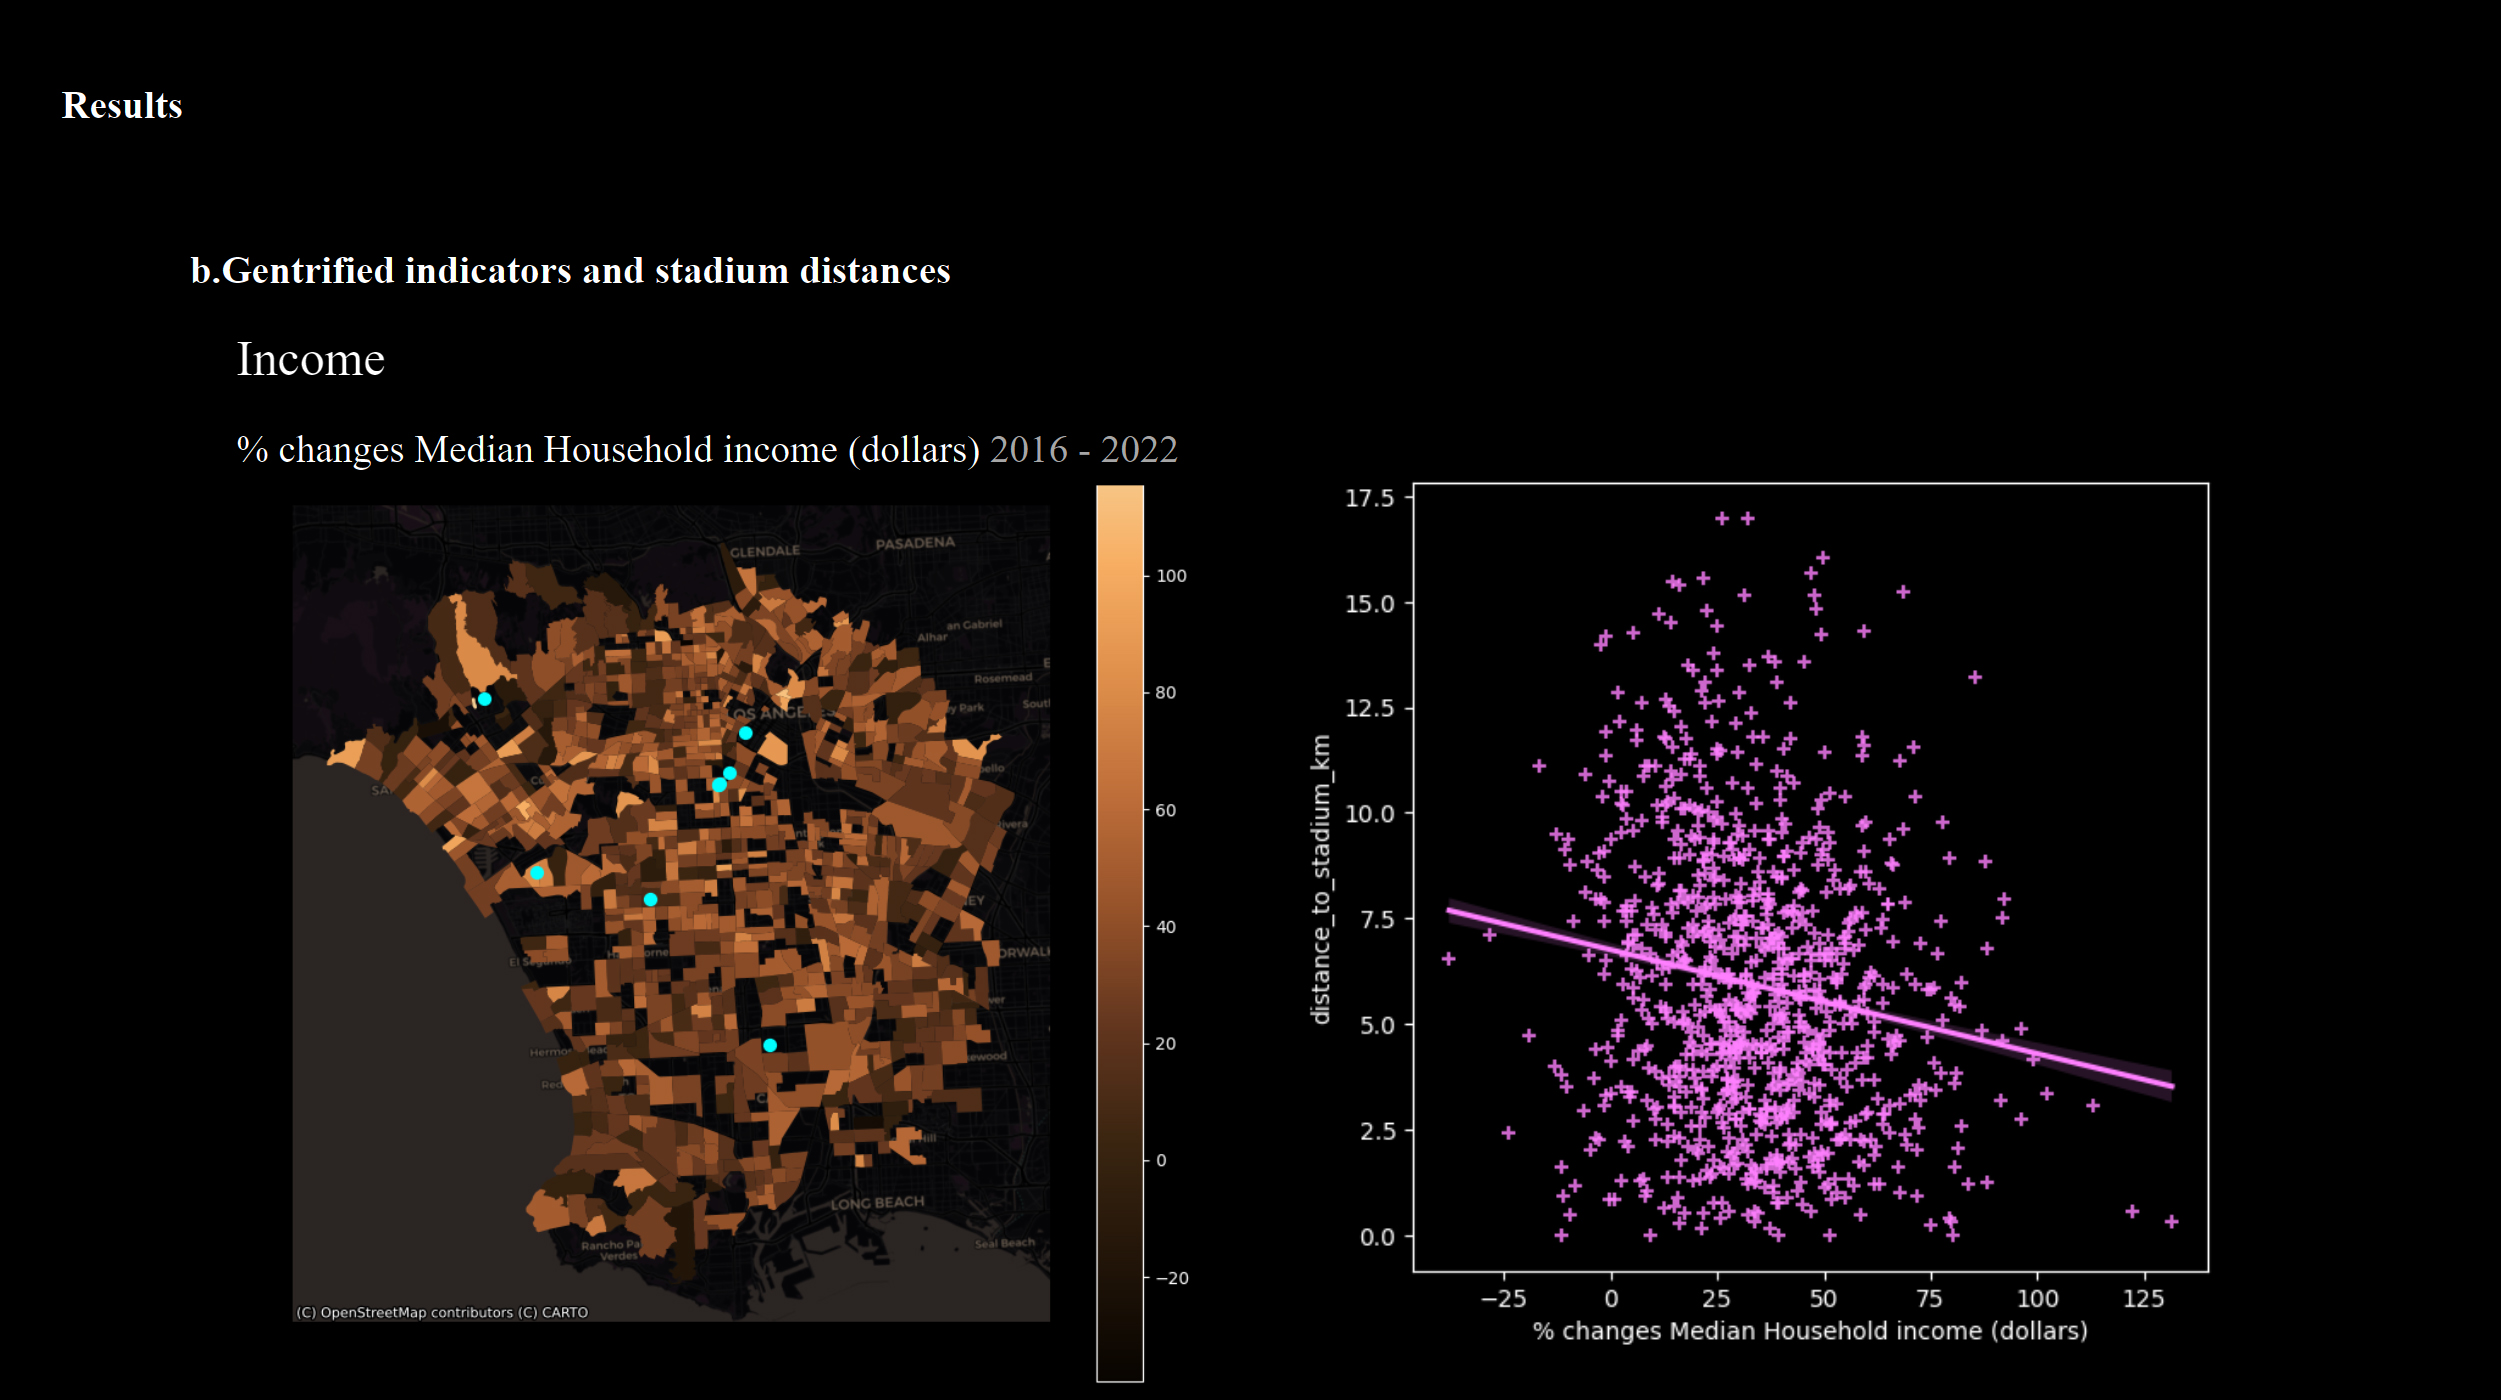
From the above, the map focuses on four indicators: Non-Hispanic White population, Population with University Degree, Median Household income (dollars), and Ratio of renters/owners. The map will focus on four indicators: Population with University Degree, Median Household income (dollars), and Ratio of renters/owners.
Percentage changes Population with University Degree
Percentage changes Median Household income (dollars)
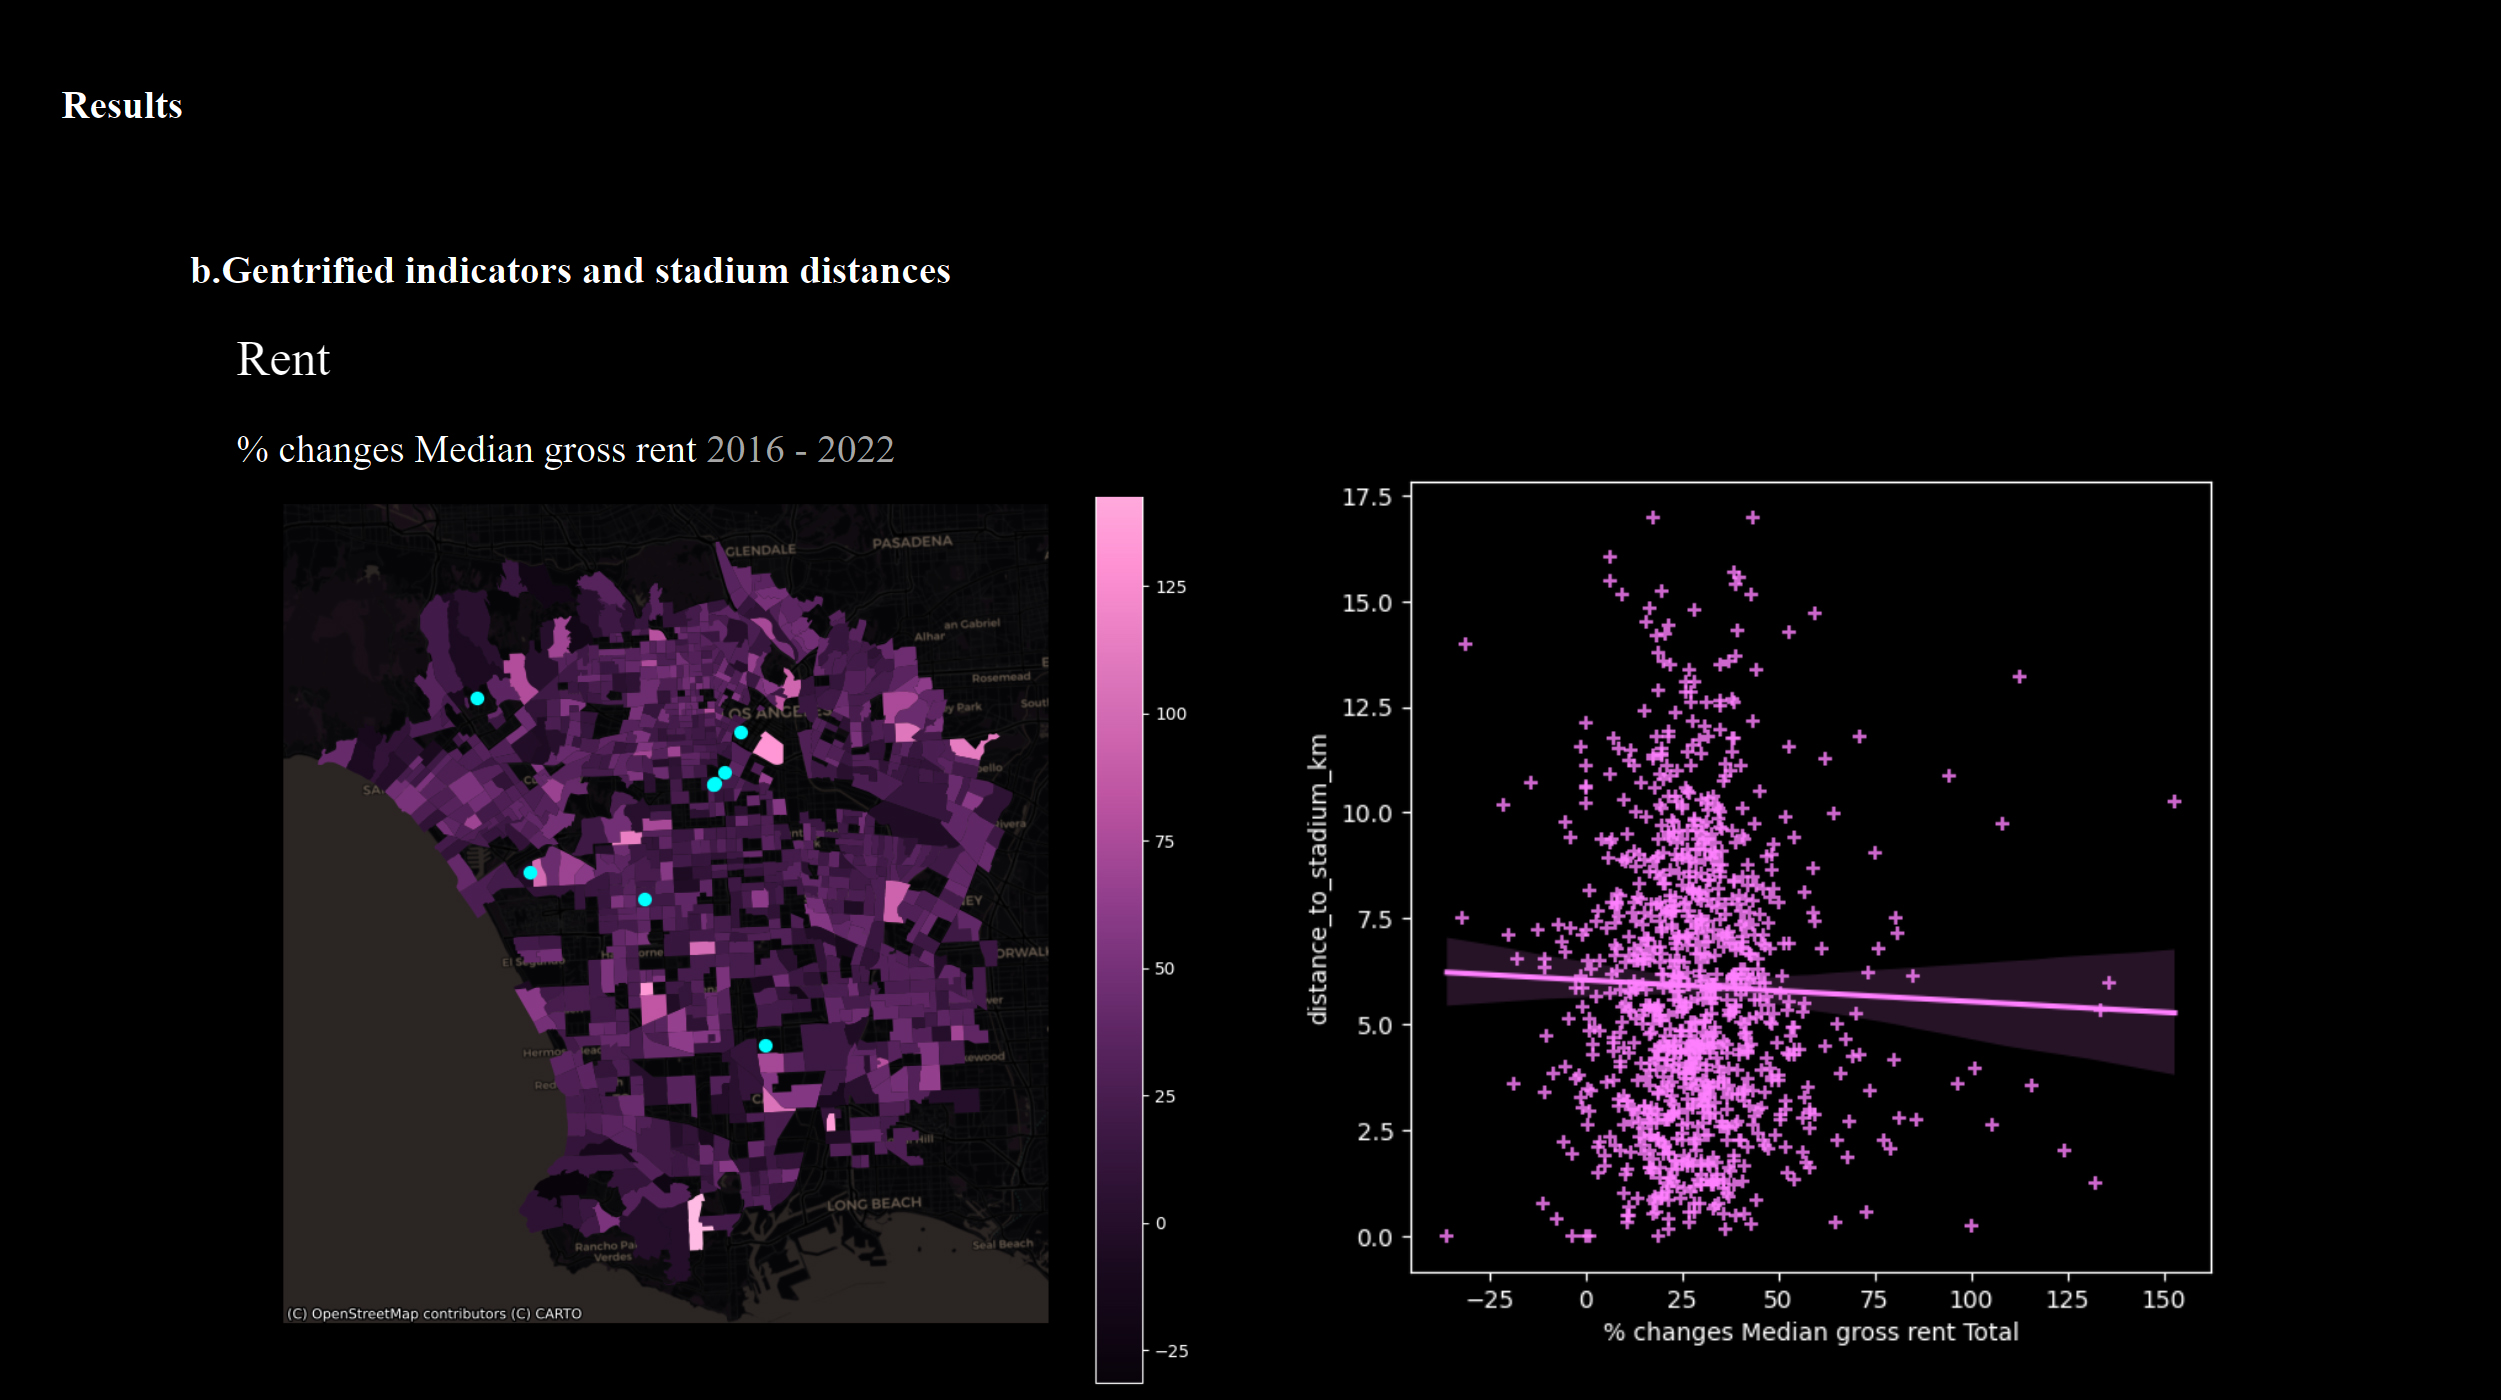
Percentage changes Median gross rent Total
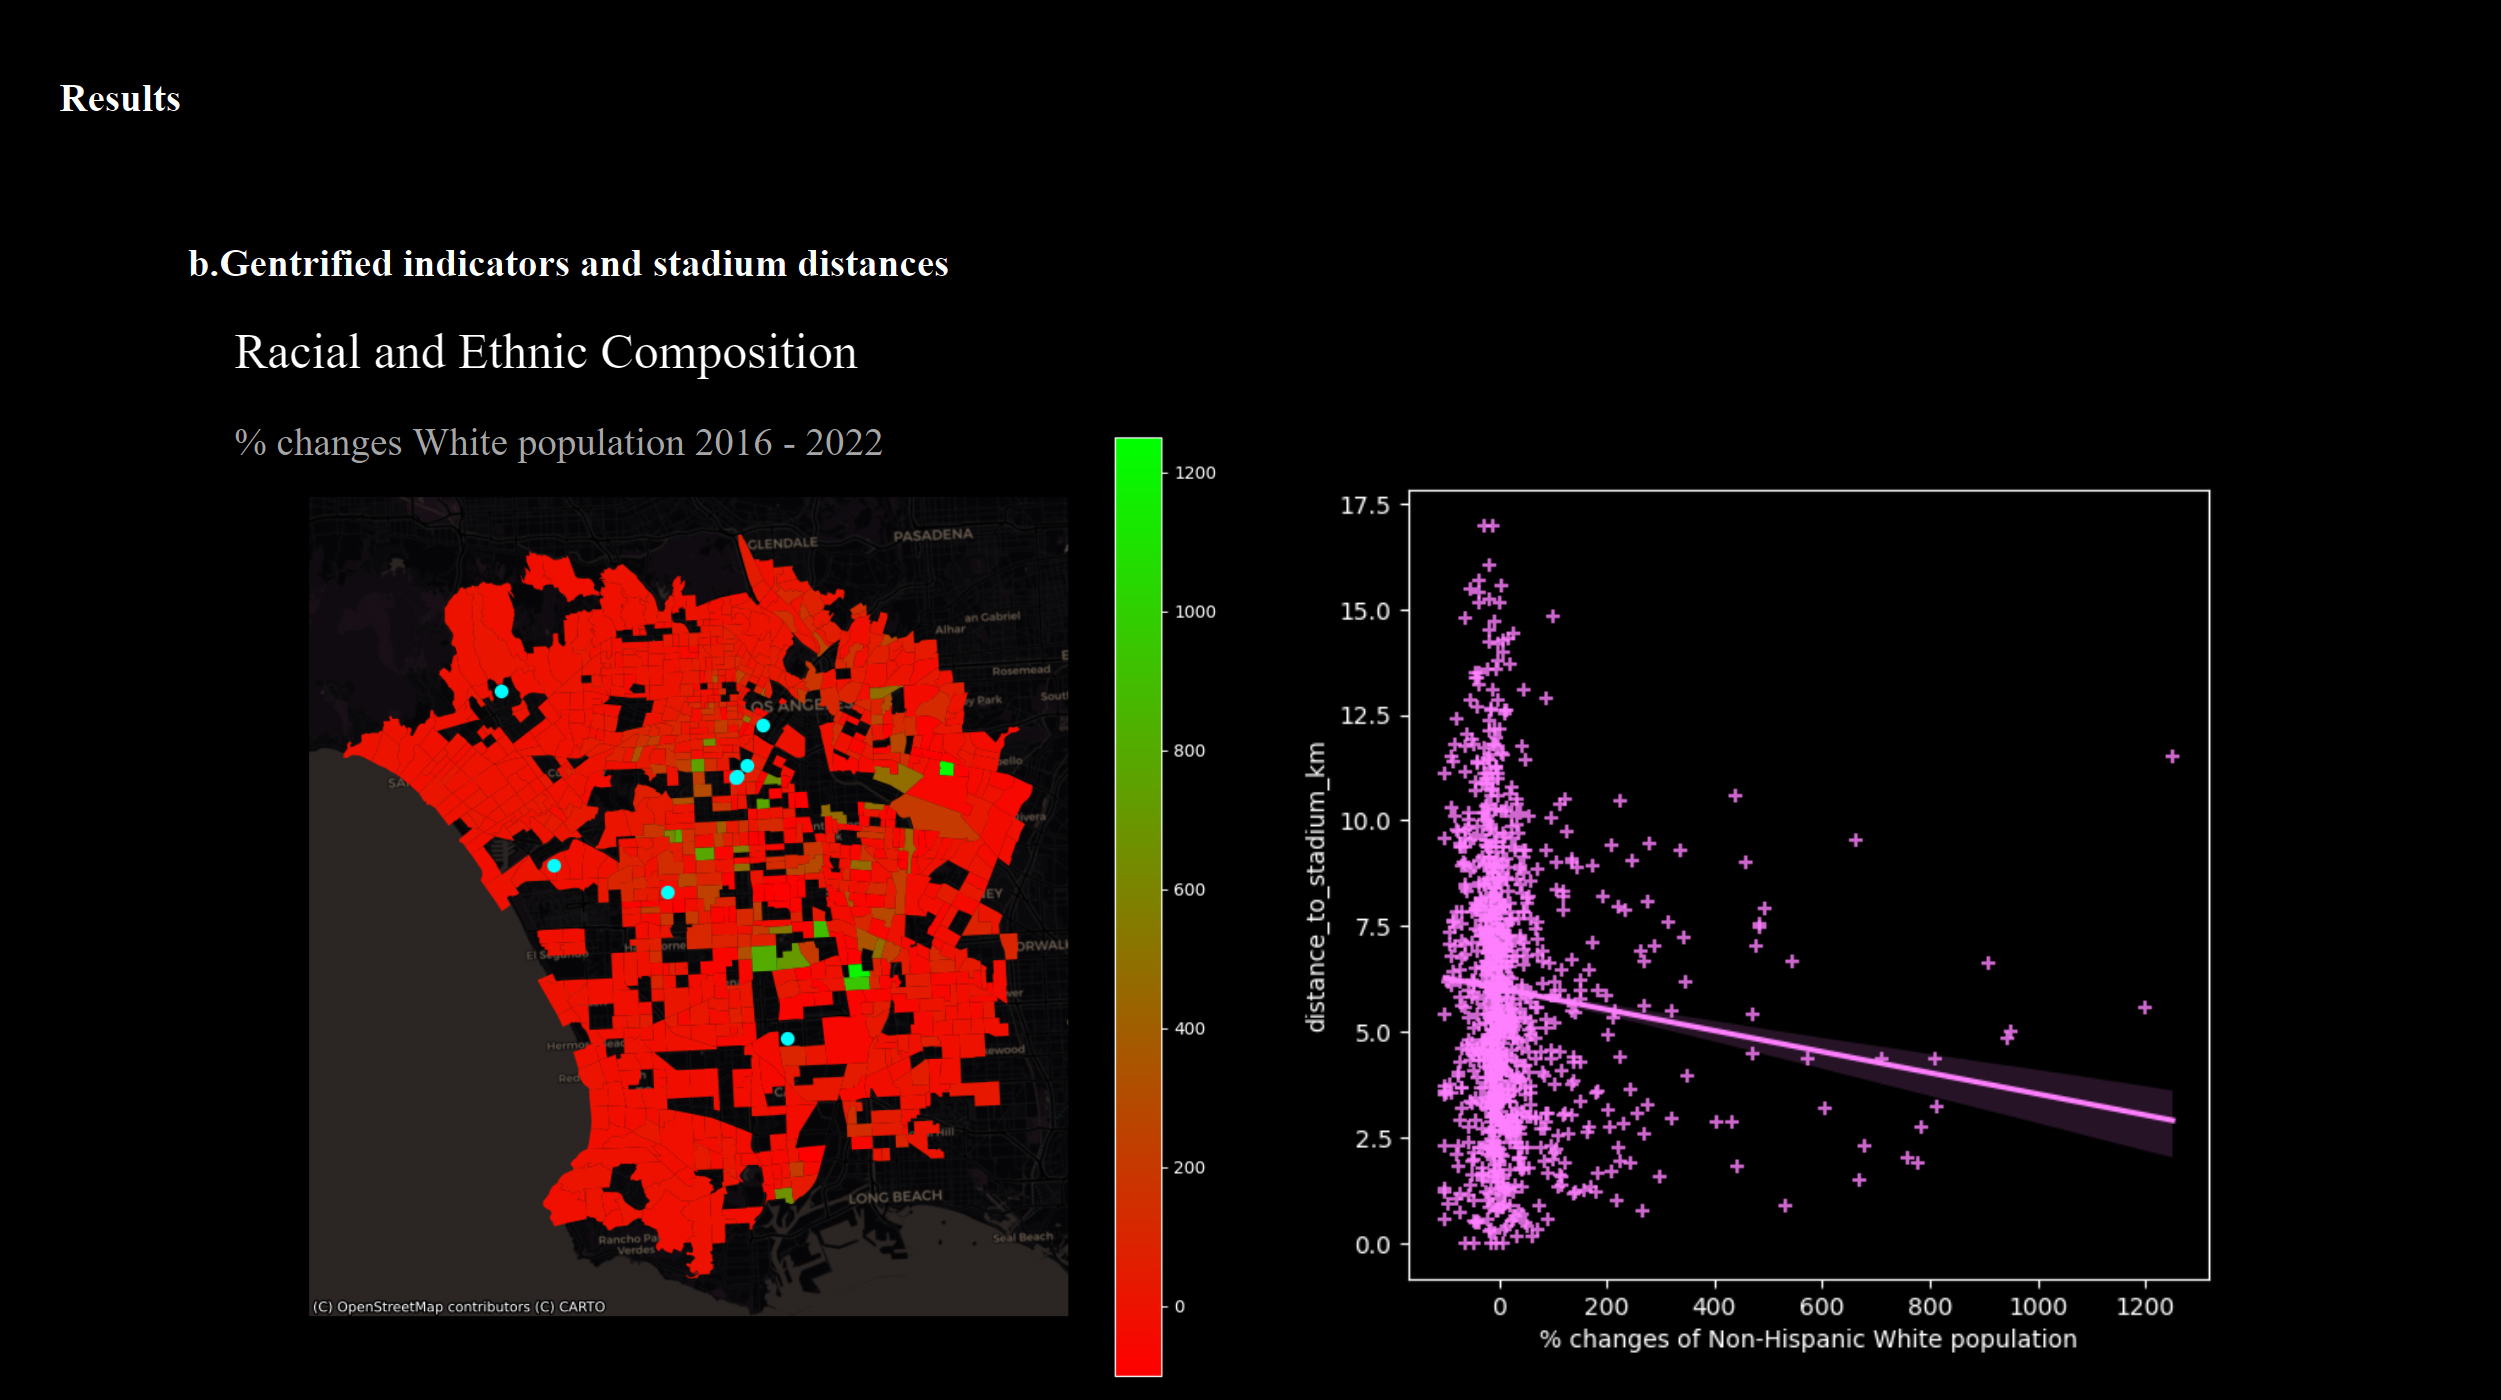
Percentage changes of Non-Hispanic White population from 2016 to 2022
Characteristics of each cluster
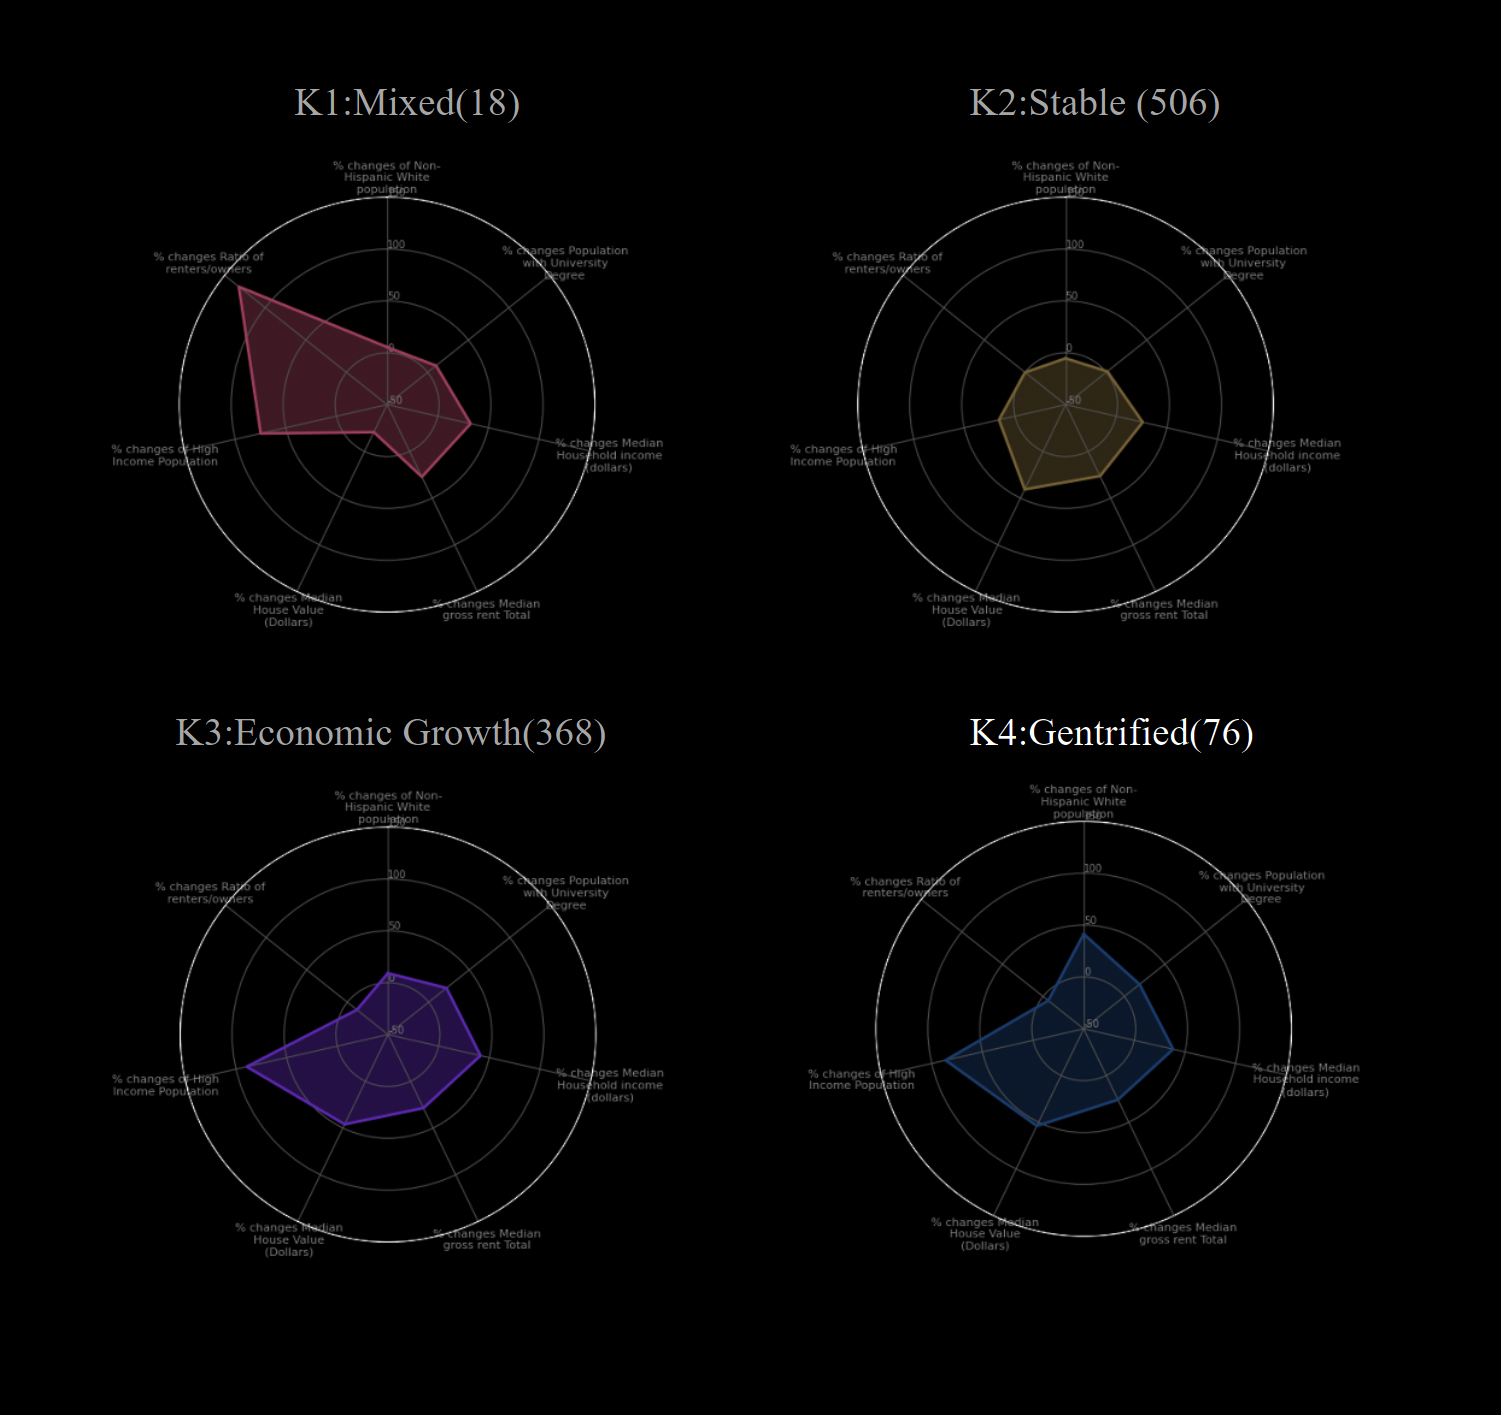 The median values for the four clusterings and study areas are visualized on the radar chart and labeled as to which clusters have a tendency toward gentrification based on % demographics changes from 2016 to 2022. This process is based on a careful consideration of neighborhood characteristic change in each indicator based on the clustered values while referring to the neighborhood change area findings in previous studies.
Mapping gentrified tract with stadium
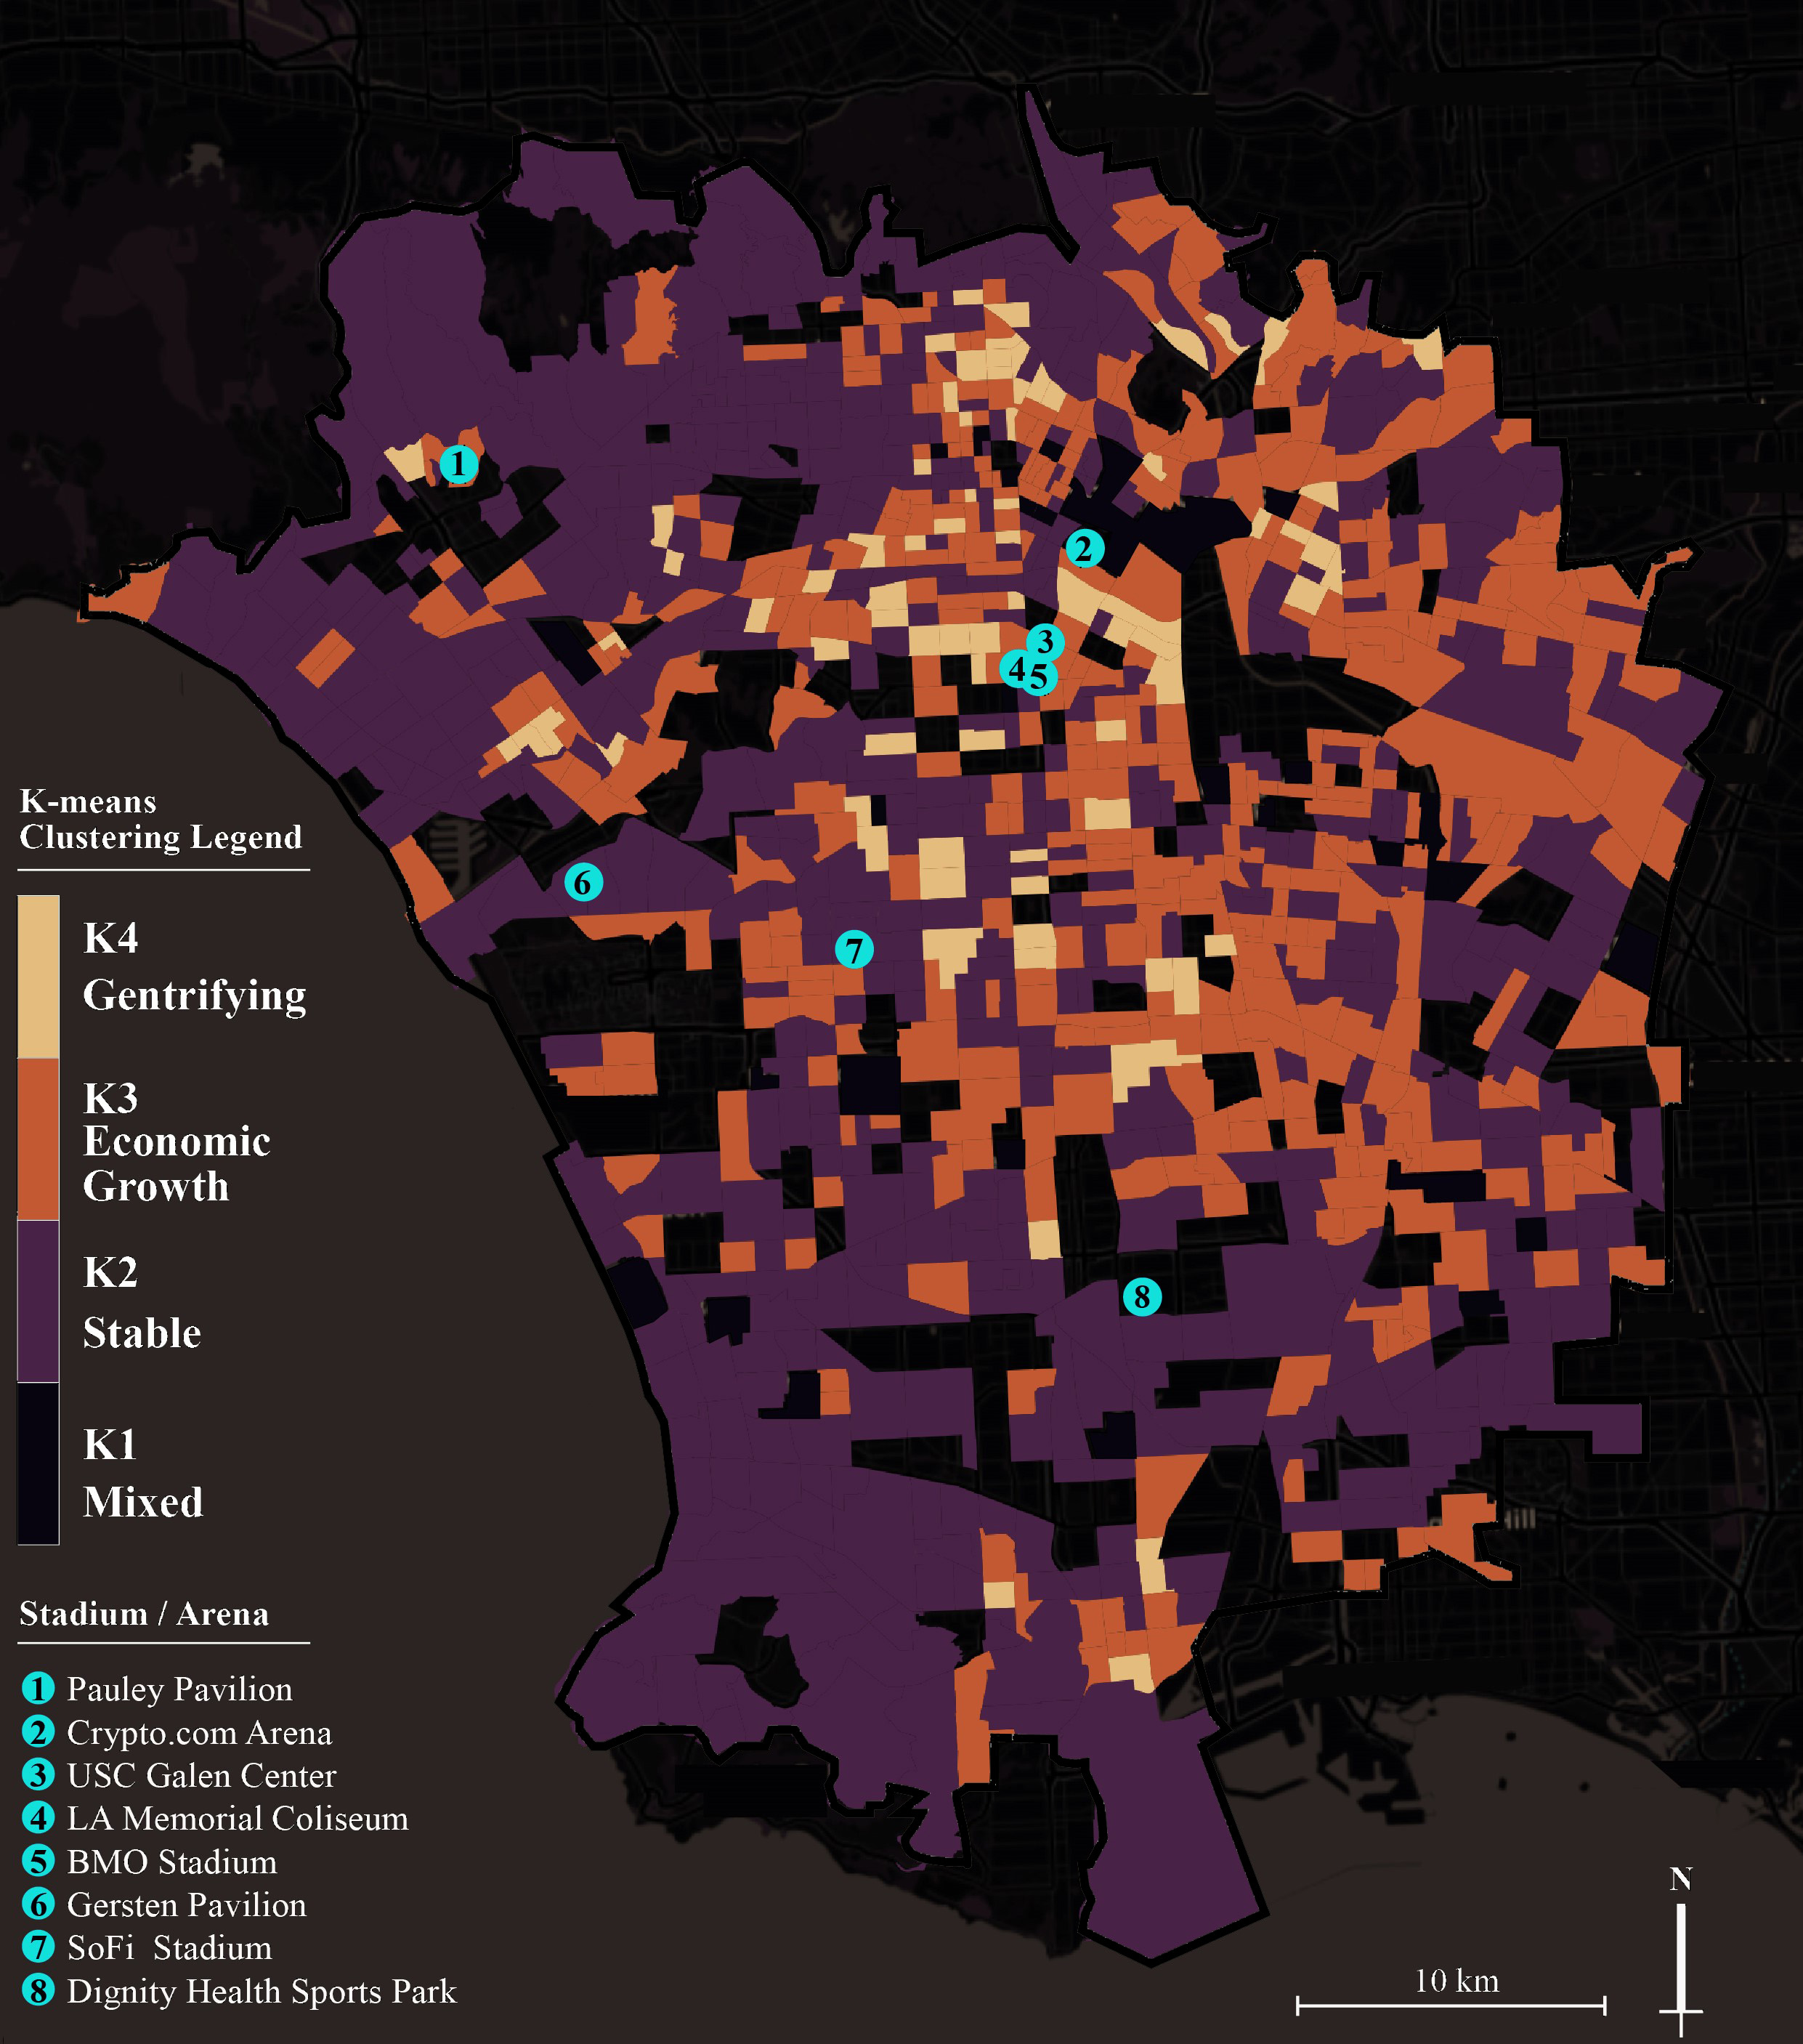 The results of the K-clustering were spatially combined with census tracts within the study area to create a map confirming the distribution. Based on this map, we will qualitatively examine the relationship between the distribution of gentrification at a more detailed neighborhood level and local development activity, the year the stadium was completed, and the size of the stadium.
Conclusion
The findings shed light on the multifaceted nature of gentrification, underlining the significant role of sports stadiums as catalysts for urban change. Through a meticulous analysis employing K-means clustering and an array of economic and demographic indicators, this study revealed distinct patterns of neighborhood evolution around the SoFi Stadium and other sports venues. The data points towards a pronounced trend of socio-economic upliftment, characterized by an influx of higher income households and an increase in residents with higher educational attainment within close proximity to the stadium. Notably, the study delineates the differential impacts of stadium proximity on neighborhood demographics, showcasing a gradient of gentrification intensity that diminishes with distance from the stadium. This spatial correlation underscores the localized nature of gentrification processes, suggesting that the transformative effects of stadiums on urban fabric are most pronounced within their immediate surroundings.