"Flatten the curve" is a popular phrase to emerge during the COVID-19 pandemic, referencing a widely circulated diagram. The ubiquitous graph shows the number of cases plotted on the Y-axis and time on the X-axis. Two epidemic curves predict the number of cases over time with or without the implementation of preventative measures that seek to "flatten the curve."" At a set quantity of cases, another horizontal line indicates the healthcare capacity in terms of how many cases can be treated (another call to action: "raise the line"). The goal is to keep the epidemic curve flatter (below) the healthcare capacity line.
Many factors from various spheres influence the epidemic curve and the healthcare capacity line, but the original flatten-the-curve diagram intends to show the generalizable effect of purely preventative measures undertaken. Preventative measures include any policies or recommendations adopted to slow or stop the spread of the virus. They range from encouraging individuals to stand six feet apart to requiring them to quarantine isolated from the outside world for 14 days, if potentially exposed. The fundamental principle is limiting the opportunity for transmission between individuals (social distancing) - whether it's co-workers, classmates, customers, or family, friends, and strangers. The diagram indicates a flatter curve is the direct result of actions taken to prevent more cases. "Flatten the curve" is not just a mantra for galvanizing individuals to take preventative measures, it also is a call to policy makers... Do they listen?
Flatten the Curve GIF created by Dr. Siouxsie Wiles, Cartoonist Toby Morris, and The Spinoff TV (Wikimedia Commons)
Unfortunately, when it comes to policies, the goal is not so simple as to eliminate the virus or "flatten the curve." Policies must also consider the effects of social distancing on the local and regional economy, and the mental and emotional health of constituents. Methods of balancing these considerations (public health, economy, and general well-being) vary depending on circumstance -- the size of the threat, ability to enforce, and magnitude of population it will affect.
Within the United States, there are many scales of policy implementation: institutional (business), city, county, state, federal, and global. There is currently a vacuum of leadership at the federal level made apparent by the lack of a standardized data collection and reporting process 1, slow and insufficient distribution of federal funds2, and lax gating criteria and preparedness guidelines3. This, coupled with the inaccuracies and resolution of current case data, suggests that an analysis of preventative measures at the state-level could be more reliably looked at with overall case outcomes. State governments have some leeway with directives and assistance given by the federal government as well as jurisdiction over counties, cities, and businesses within their borders -- governors play critical roles in flattening the curve.
This project is interested in pairing coronavirus case outcomes of states with the day-to-day evolution of certain preventive measures enforced at state-level. Since there is not a top down approach nationally, approaches and directives issued by states vary greatly. For instance, in March and early April, all 50 states declared a total of 10 different types of emergencies (wildfires, heat waves, and hurricanes excluded) in order to gain more flexibility in their responses. Further, whether important information is shared in executive orders or by other means by other state departments varies depending on the state. This project seeks to clarify the numerous approaches to policies related to COVID-19 by focusing on certain policy types present across the nation.
Example Order from Each State
Graph Explainer:
The interactive graph shows the cases per capita from every state including the US as a whole. When looking at these curves, the country shows signs of struggles from coast to coast to flatten the curve. Some epidemic curves convey steady increases, others second waves. A preliminary filter oriented around like policy responses starts to indicate the effect of preventative measures on the case outcomes of each state.
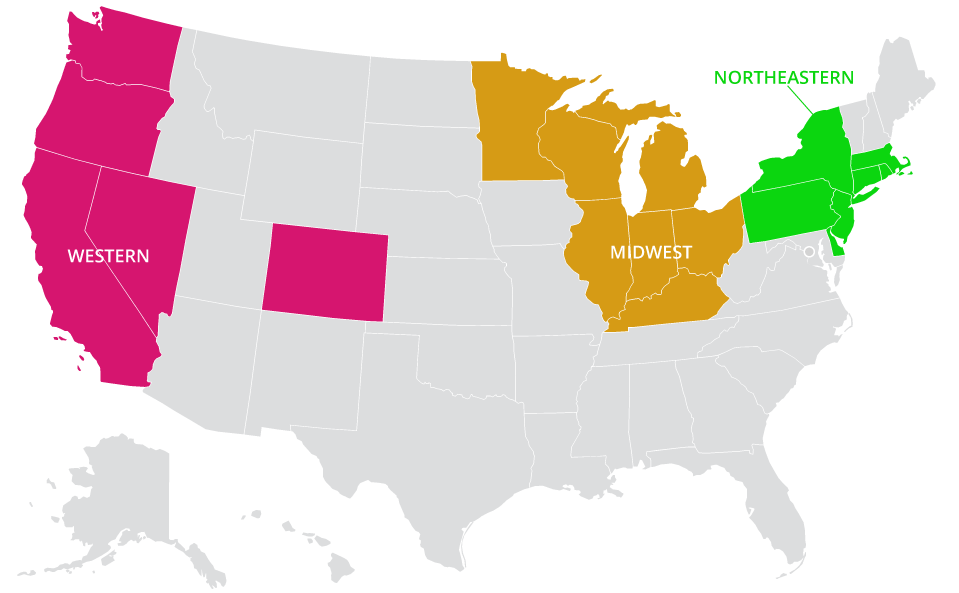
Within the US, three pacts between governors of similar regions have formed: western (pink), northeastern (green), and midwest (orange). These states acknowledge the intertwined nature of their economies and how a unified approach to reopening might be more effective at slowing the spread than staggered, uncoordinated plans.
Map of pacts formed in response to Covid-19 pandemic
When filtering by pact, curves begin to appear more parallel. The curves of the Northeastern pact show a common early rise but steady (or flattening) progress; Midwest pact states fall in the middle, with clearly upturned ends; the group of Western states fluctuate slightly more, but share lower case counts until approximately mid-June.
This graph also indicates the end of "stay at home" or "safer at home" orders per state. In terms of responses, stay-at-home or safer-at-home policies have arguably been the most controversial preventative measure, infringing most dramatically on the freedom of residents. As such, they have not been adopted by every governor (grey curves) nor totally enforced with fines or incarceration for violations. The highest case counts, and some of the steepest increases, are currently being posted by states not participating in pacts.
Aside from stay-at-home or safer-at-home orders, another variation in approaches to policies is the presence or lack of phased reopening plans per state. Hover over a state’s curve to see if it published a reopening plan; all are linked in the reference section below.
Cases per Capita Graph
Fingerprint Explainer:
The following set of graphics combines case data and policy analysis per state. Critical preventative measures enforced at the state-level are grouped into nine general policy types: emergency declarations, school closures, "non-essential" business restrictions, restaurant restrictions, bar restrictions, gathering restrictions, quarantine or case isolation orders, stay-at-home orders, and public mask orders (definitions of each type are in the reference section). The start and end (and sometimes second start) dates of policies within these categories define distinct policy timelines for each state. Coupled with the cases per capita chart above and death count chart below, this three-part graphic generates a unique fingerprint for each states' response to the pandemic.
The graphics load in alphabetical order. To reorganize the visualizations per state, choose to sort by most cases, most deaths, or date of first policy implemented. To filter the visualizations, use the drop down to see only graphics by pact, no stay-at-home policy, or no mask policy.
Each fingerprint is also coded in one of three colors: red, blue, or purple. Red indicates the popular vote of the state supported the Republican party in the 2016 presidential election; blue, Democrat; purple indicates a swing state with Republican and Democratic votes within 10% of each other. Further, the party affiliation of each governor can be found per fingerprint and linked in our data set available in the reference section.
How to Read Fingerprints
Project Insights:
The following is some of our preliminary insights derived from looking at the newly created data set visualized. As expected, New York and California, two of the most populous states, have the most deaths and most cases respectively. These states’ responses included six to eight policy types enacted earlier than almost every other state and for a longer duration than seen in other states. The highest rate of cases per capita for each: 2.16 e-02 and 1.26 e-02. Contrast this with Florida, another populous state, and their rate of 2.14 e-02 and climbing; the state’s number of cases is exponentially increasing. The duration of policy types appear shorter than New York and California and a public mask policy is absent.
Across the board, mask policies appear as contentious as stay-at-home or safer-at-home orders. 15 states do not have any state-required mask policies in public; 12 states have no Stay at Home orders; and 5 states have enacted neither mask or stay-at-home mandates. Maine, New York, Rhode Island, and Vermont are the only state responses at present that had all nine policy types active at the same time, with varying case outcomes. This suggests population and the scale of metropolitan areas plays a large role in case outcomes beyond policy measures.
The addition of the death count charts below the policy types in each fingerprint paints another intriguing picture. Five months into this pandemic, it’s shocking to see death counts growing, almost mirroring the cases per capita charts above. Though death counts and preventative policies may not have a direct relationship, seeing deaths grow as cases rise begs the question of what types of policies are or are not working for the infected population -- how would this analysis look different if executive orders that address hospital budgets for healthcare worker provisions were included? Recent news coverage emphasizes the growing number of cases are a product of younger generations becoming infected, but how does this explain growing death counts?
Thinking about how this project might evolve as the pandemic continues to unravel, we are interested in looking more closely at the gating criteria4 adopted by every state and how it influenced policy expirations or endings. When generating these fingerprints per state, it is obvious in some cases, even the minimum guideline of a downward trajectory of cases was not reached before policies were changed. Were states following the science behind the virus’ incubation period and did this decision (of following or not) greatly affect case outcomes?
Methodology:
The interactive graph component of the project was an early test we include because the results of filtering the states by pact hints at our initial research question: how do different policy types and durations affect case outcomes at the state-level? Those states agreeing to corresponding phased reopening plans appear to be charting in similar patterns. Moreover, our early interest in stay-at-home or safer-at-home orders only appeared to be one part of a much larger and longer response by governors to flatten the curve. From these observations, we wanted to go deeper and question what reopening per state looked like from the perspective of preventative measures being lifted.
This project’s strength as a research tool is derived from its focus on when certain policy types “ended” and the ability to evaluate case outcomes with that information overlaid. We examined hundreds of state policies and other forms of published guidance to generate nine primary categories of preventative measures addressed. Definitions of these policy types are as follows:
Emergency Declaration - start date of emergency declaration by the governor of the state; end date is defined as either the expiration date of the most recent declaration order or undefined by governor. (Ex. State of Emergency, Public Health Emergency, Disaster Emergency, State of Disaster, State of Civil Disaster, Peacetime Emergency, State of Public Health Emergency, State of Preparedness, Emergency, and Disaster.)
School Closure - start date of closure of public school facilities for in-person instruction; end date is defined as when the Department of Education or governor published the first guidance document for school districts to plan for the fall term.
Non-essential Business Closure - start date of facility, office, or storefront closure of more than one type of non-essential business as defined by the U.S. government; end date of restriction on in-person, in-store/facility/office operations.
Restaurant Restrictions - start date of substantial reduction of operations of businesses defined as restaurants and similar food venues; end date of restriction on indoor dining at site.
Bar Restrictions - start date of substantial reduction of operations of site’s whose primary source of revenue is the sale of liquor; end date of restriction on indoor dining at site.
Gathering Restriction (Any) - start and end date of any restriction on the number of people allowed to gather indoors or outdoors.
Quarantine/Case Isolation - start and end date of either mandatory quarantine for individuals travelling into the state (or recently exposed to the virus) or case isolation for individuals with confirmed case of COVID-19.
Stay at Home - start and end date of policy mandating individuals stay in their place of residence and only go out for essential services.
Mask - start and end date of policy mandating masks be worn in public, indoors or outdoors.
Creating this data set of the start and end date of certain policy types is an on-going project, with a very rough beginning. Other projects depicting coronavirus policy data per state tend to include only the enactment of policies or a calculated "broad reopening date" (see related projects: Johns Hopkins Coronavirus Resource Center and The New York Times, Tracking the Coronavirus). This may be because determining the “end date” of policies proves incredibly time-consuming. One must negotiate expiration dates, multiple renewals or supersessions, and inaccessible (one-star) data.5
The following list of grievances begins to hint at why this data creation was so confusing and time-consuming to complete:
PDFs (of orders) often scans of signed documents, therefore not searchable unless processed to recognize text
Legal language (ex. Three pages of "whereas" before order stated)
Policy types initially grouped, then split up in following orders (and vice versa)
Revisions, extensions to orders or superseded policies reference previous orders by # not content
Orders issued and enacted on separate days
Policies within same order document given different extensions
Some policies/orders are reviewed (expire) every two weeks
Some policies allow counties to amend, some don't
Some states have orders coming from the governor and the secretary of public health (executive orders vs. public health orders)
Orders list recommendations in addition to mandates in same documents
Orders from same state repeat language/definitions with minor updates
Some states have new COVID-specific websites where mandates may be found
Many different exceptions per policy type per state (ex. Mask mandates include different exclusions/scenarios; ex.2 non-essential business closures staggered based on important industries in that state)
Transition from orders/mandates to phased reopening plans
We’re still in the middle of the pandemic / policy types ended may be re-enacted
Reference & Links:
Our data is available here. Governor names and party affiliation as well as links to states’ executive orders, health orders, and reopening plans are included in the sheet titled Main_Categories. If you believe there is a misrepresentation of a policy type, start date, or expiration, please email info@c4sr.columbia.edu.
One star refers to Tim Berners-Lee’s5-star Open Data schemeranking types of data available on the worldwide web. Ex. “Available on the web (whatever format).” The National Governors Association data we also reference is three-star data because it is available in a “non-proprietary format (e.g. CSV).”
Project Citation:
Updates to the data may also be reflected in citation; please review regularly:
Adeline Chum and Spenser A. Krut. “Flatten the Curve: Policies and Outcomes of COVID-19”. Center for Spatial Research, Columbia University Graduate School of Architecture, Planning, and Preservation. Version 1.0. July 31, 2020. https://centerforspatialresearch.github.io/summer2020_covidpolicies/