Bushwick's Work in Progress
Introduction: Who Made the New Bushwick?
Real estate development has been strongly tied to overall economic conditions. To stimulate economic growth after the 2008 subprime mortgage crisis, the Federal Open Market Committee conducted the longest and lowest target rate at about 0.1% in Federal Reserve’s history, from December 2008 until December 2015.1 With extremely low-interest rates, new development rebooted nationwide when the housing market started recovering from 2010.2 Furthermore, following Trump’s Opportunity Zones in Tax Cuts and Jobs Act of 2017, many new constructions were initiated in underdeveloped areas signaling large-scale urban revitalization was underway.3 Bushwick is an example of the tide of the 2010s real estate boom.
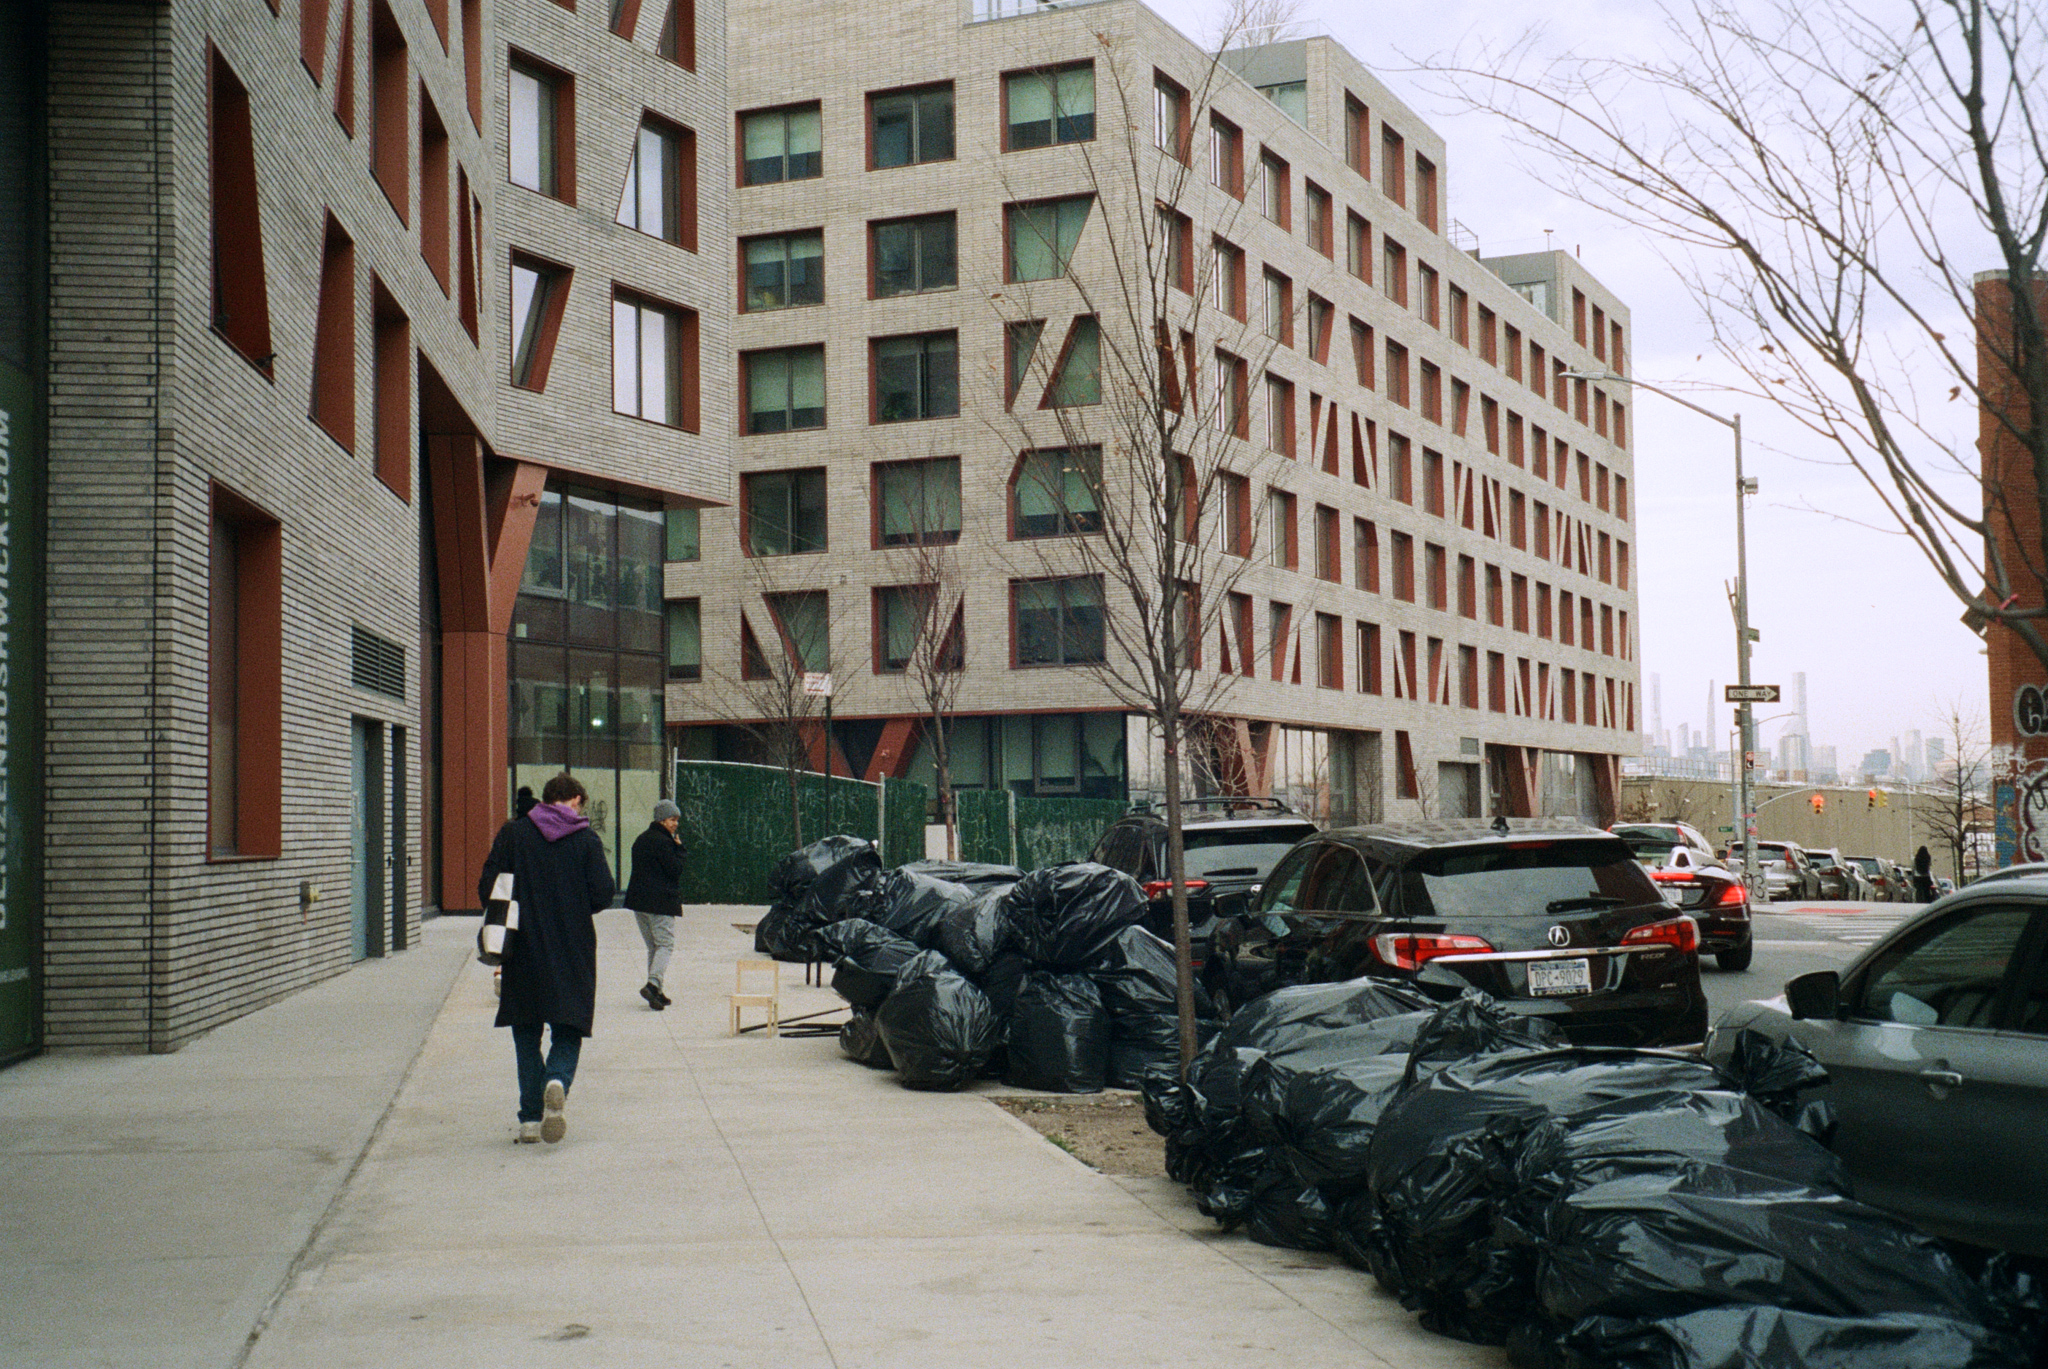
In a shrinking regional economy, urban revitalization is crucial to bring new life and stimulate capital growth. Conflict emerges, however, when an influx of capital and new residents replaces the previous under-represented enclaves. Driven by favorable market conditions and proximity to the already matured Williamsburg market, Bushwick’s development has outgrown many other neighborhoods in New York City in recent years.4 Currently, in Bushwick, a new residential building with a piano keyboard exterior stands on Evergreen Avenue; a Tesla is locked in a backyard with 24-hour surveillance on Cooper Street, scaffoldings and work-in-progress signs block the sidewalk on Broadway; irregular chunks of modern complexes with glass balconies duplicate on Melrose street. The project seeks to discover who plays the major role in transforming Bushwick and what is the relationship between the owner and the new building. By looking at the permit issuance data from 2008 to 2022, the project hopes to discover the development trends in Bushwick since the last recession. Who made the new Bushwick?
The Developer’s Town: The Cluster Effect of the Owner’s Address
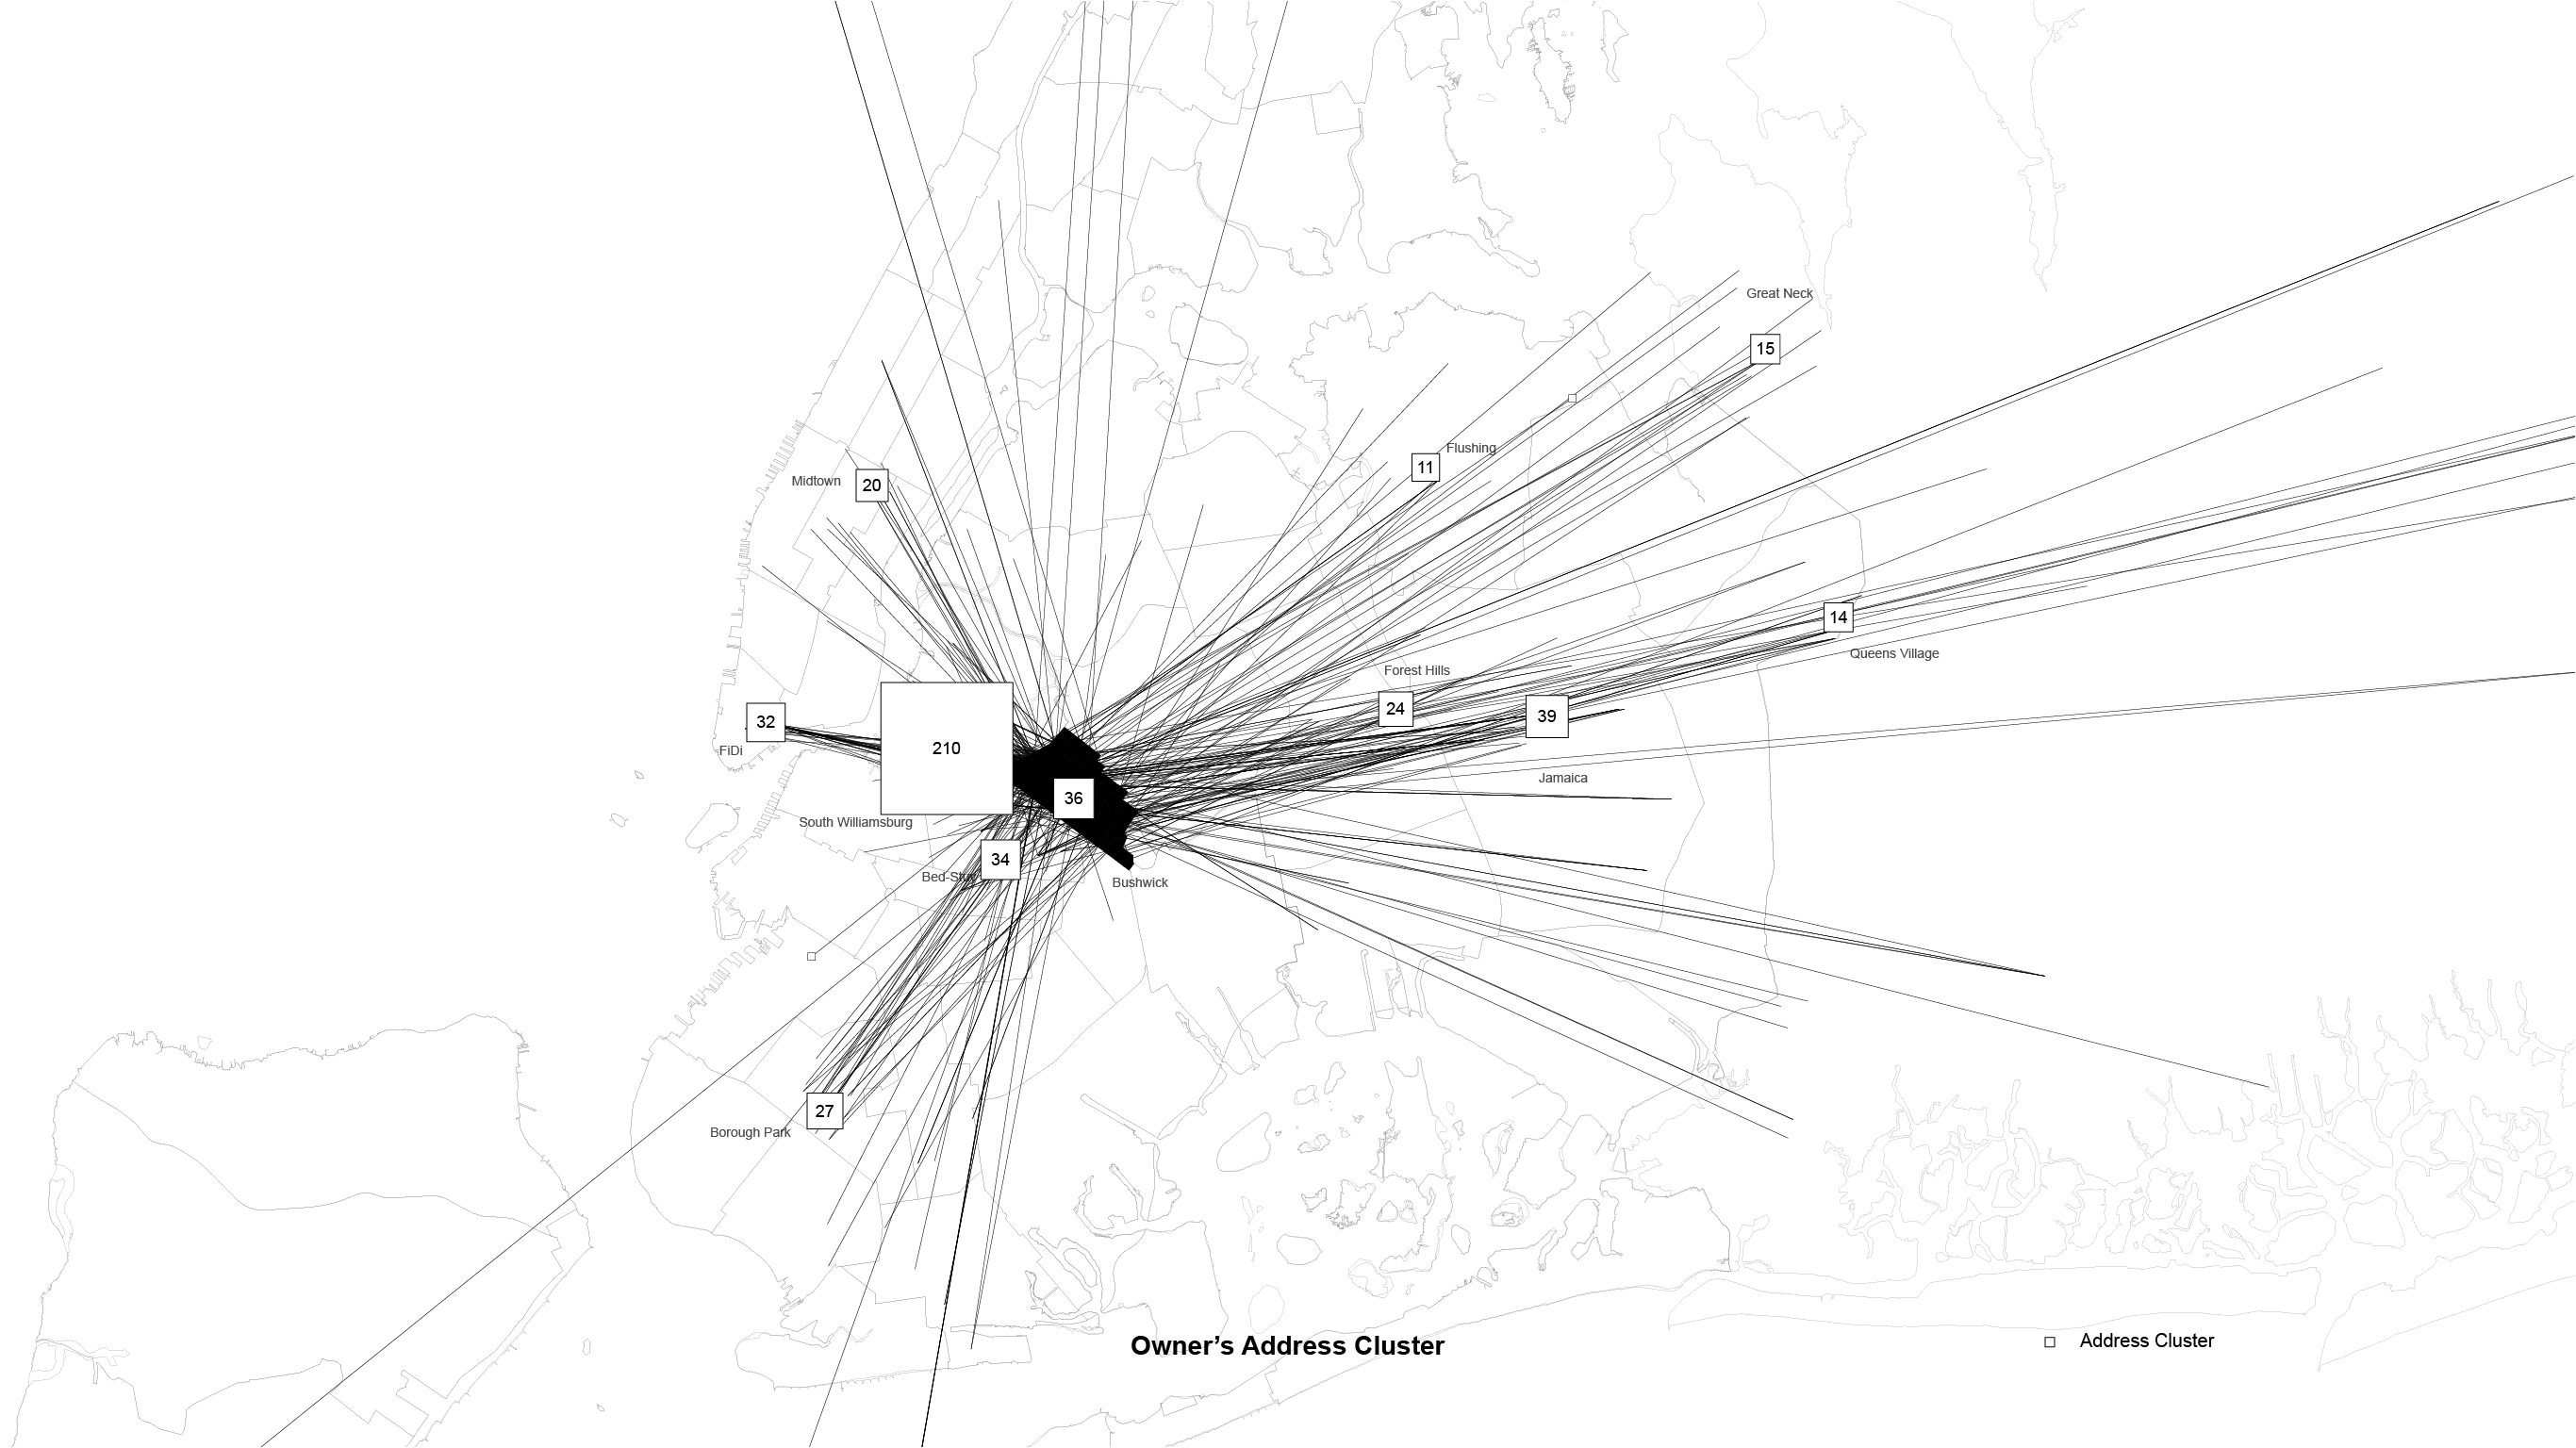
The map shows the spatial relationship between the owner’s address and Bushwick’s new building.
To understand where the owners came from and which companies developed Bushwick, I looked into the registered owner’s addresses from the Department of Building data that indicated their true business addresses.
The majority of the owners are from Bushwick’s adjacent neighborhoods: South Williamsburg, Bed-Stuy-Crown-Heights area, and Bushwick itself. If we zoom out further, Jamaica in Queens, Borough Park in Brooklyn, FiDi and Midtown in Manhattan, and Great Neck in Long Island also have a significant number of owners. The cluster effect might link to the real estate industry condensing neighborhoods that have multiple real estate development companies and property management companies in close proximity. Specific ethnic groups and families might share the same focus in real estate development, like the contribution from Jewish developers throughout the history of New York.5 In Bushwick, more than two-thirds of the owners are from South Williamsburg, which is a traditionally known Orthodox Jewish neighborhood.6 It not only has close proximity to Bushwick but also congregates real estate business. Borough Park, Great Neck, and some parts of Crown Heights share similar characteristics.
Top Owner by Name
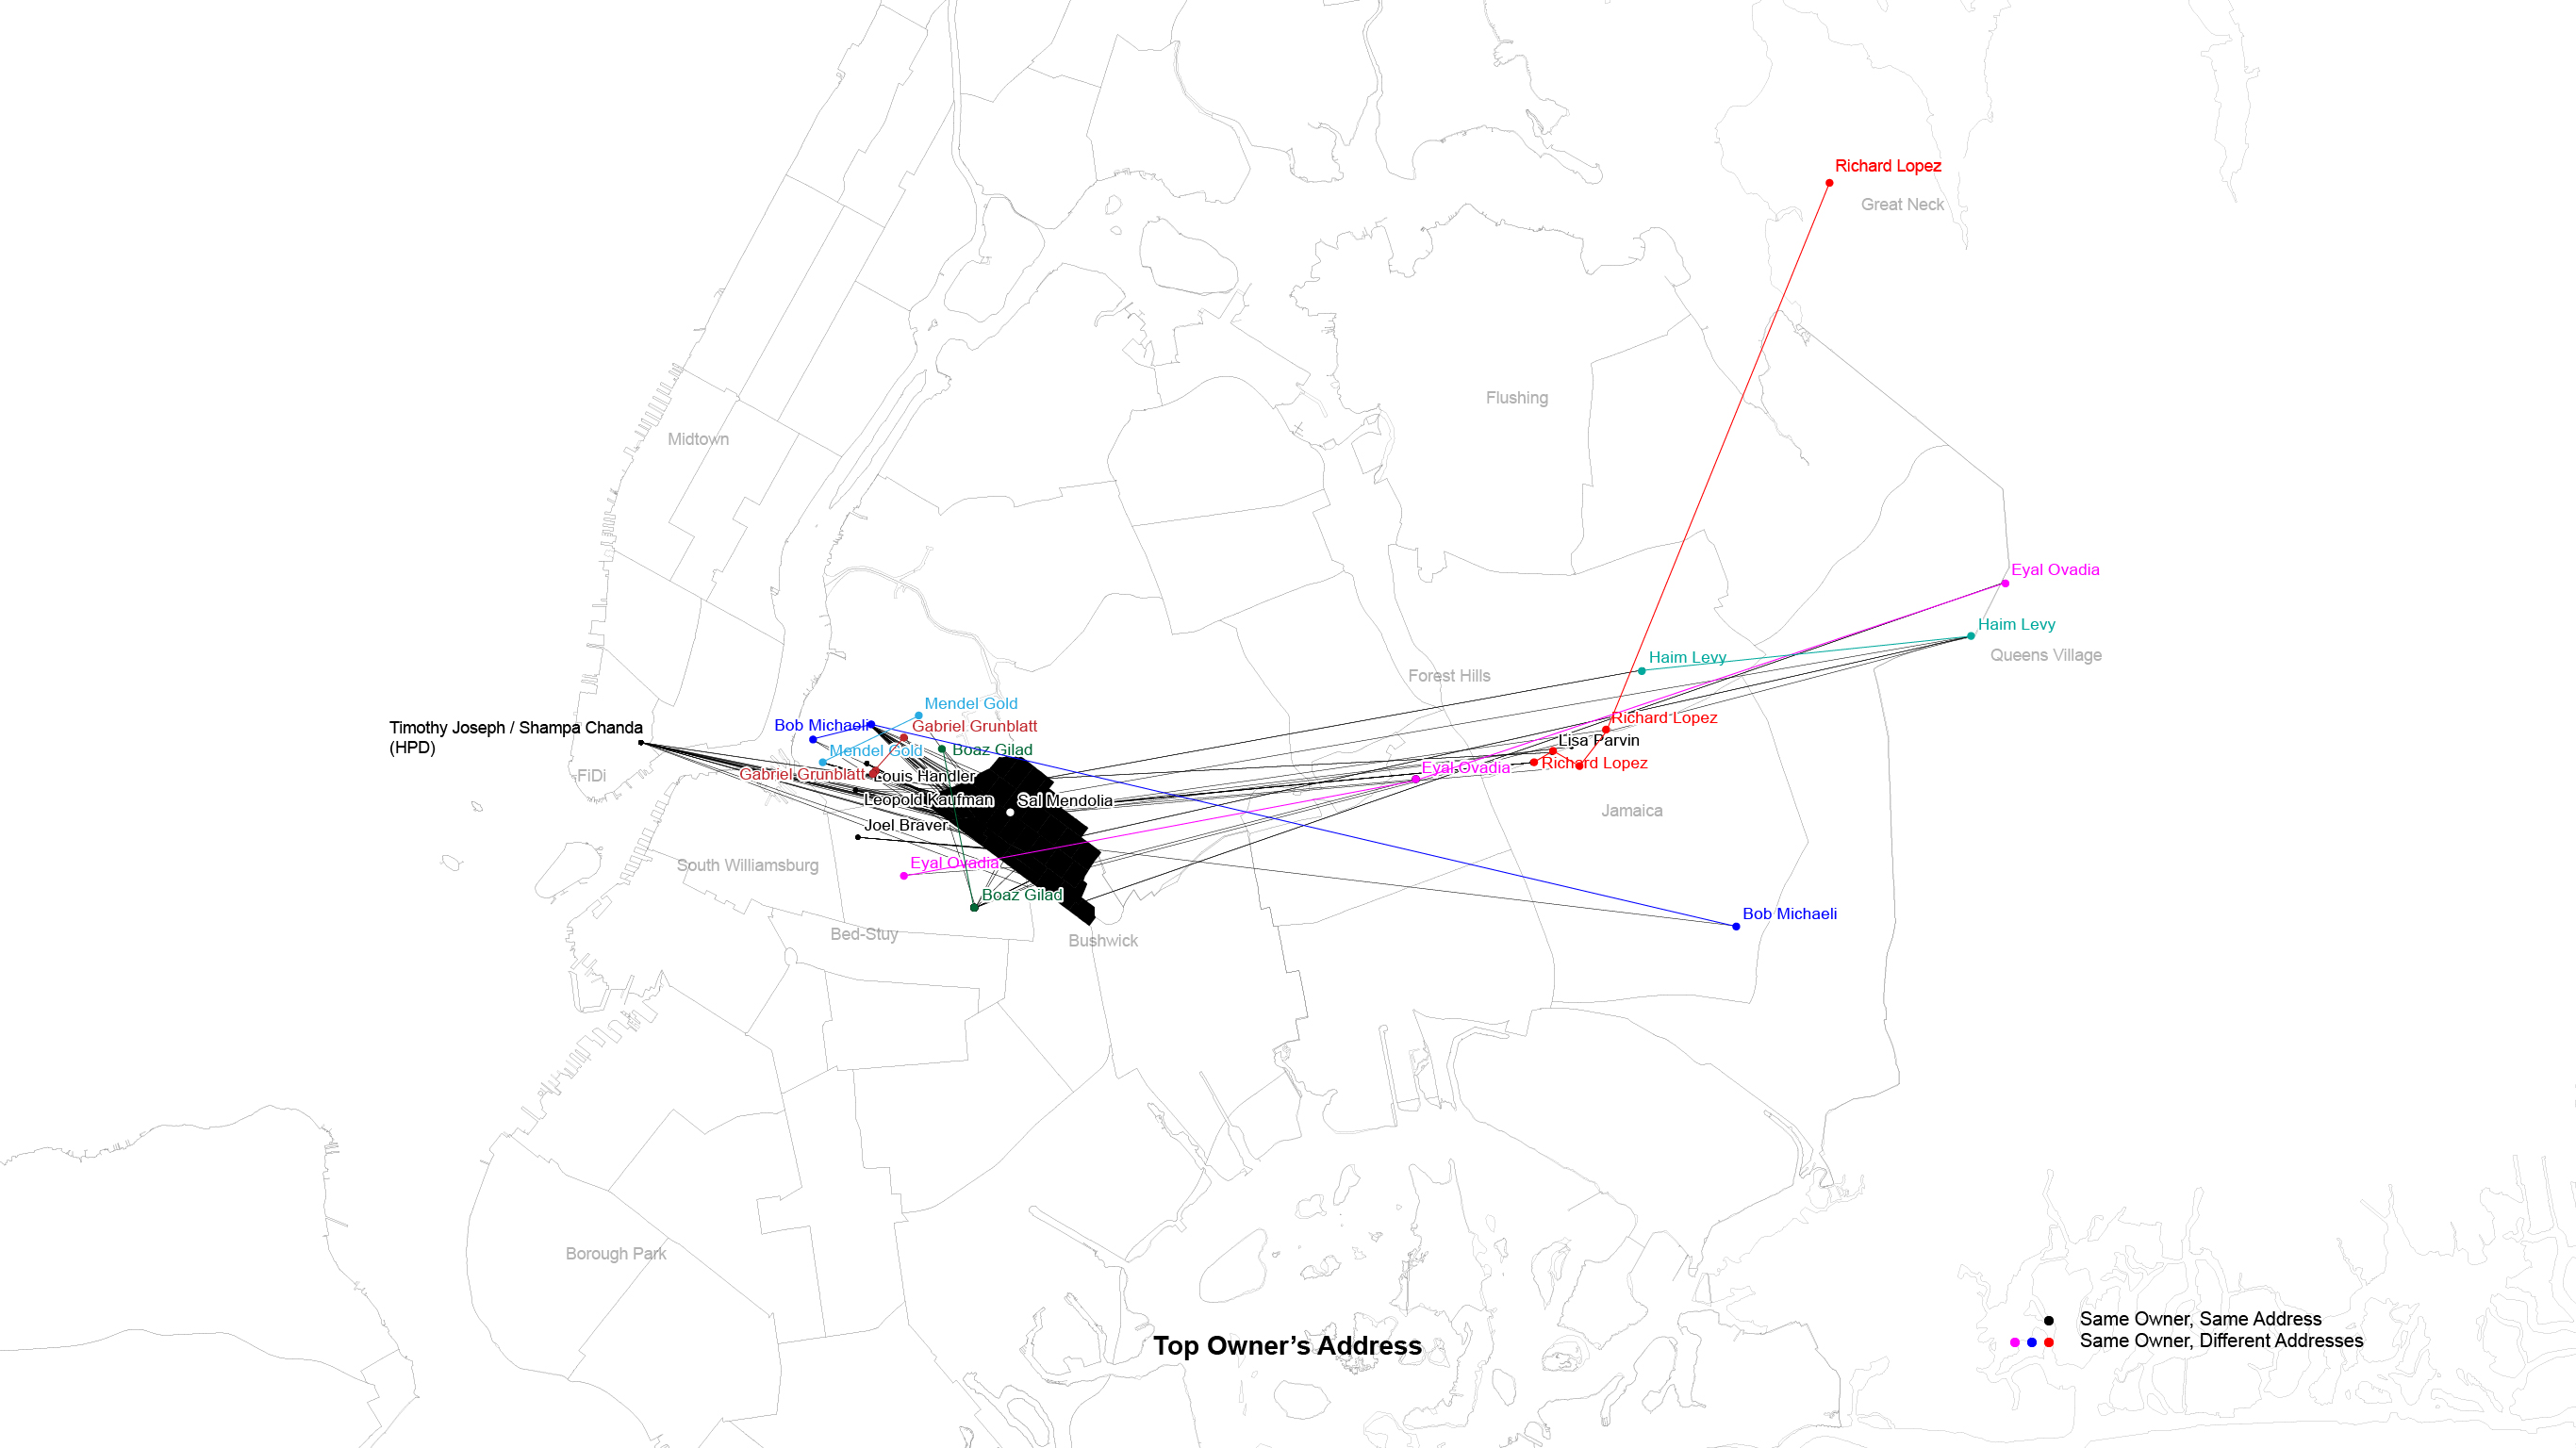
The map shows the top 12 owners’s (outliers) location. The color indicates having multiple owner’s addresses.
There are 299 individual owners to develop 536 new buildings from 2008-2022. Most owners only have one building in the period. There are 12 outliers calculated by the IQR method. Sorted descendingly, which are Bob Michaeli (27), Louis Handler (12), Mendel Gold (11), Boaz Gilad (11), Timothy Joseph (10), Shampa Chanda (10), Richard Lopez (10), Leopold Kaufman (9), Sal Mendolia (6), Joel Braver (6), Haim Levy (6), Gabriel Grunblatt (6).
They altogether developed 124 new buildings, which took about 23.1% of the entire Bushwick’s new buildings.
Based on the permit issuance, Bob Michaeli (Robert Michaeli) is the top owner of Bushwick’s new buildings. Bob Michaeli is the project manager at Urban View Development Group Inc., a South Williamsburg-based real estate firm. The second top owner is NYC HPD which is represented by Timothy Joseph and Shampa Chanda.
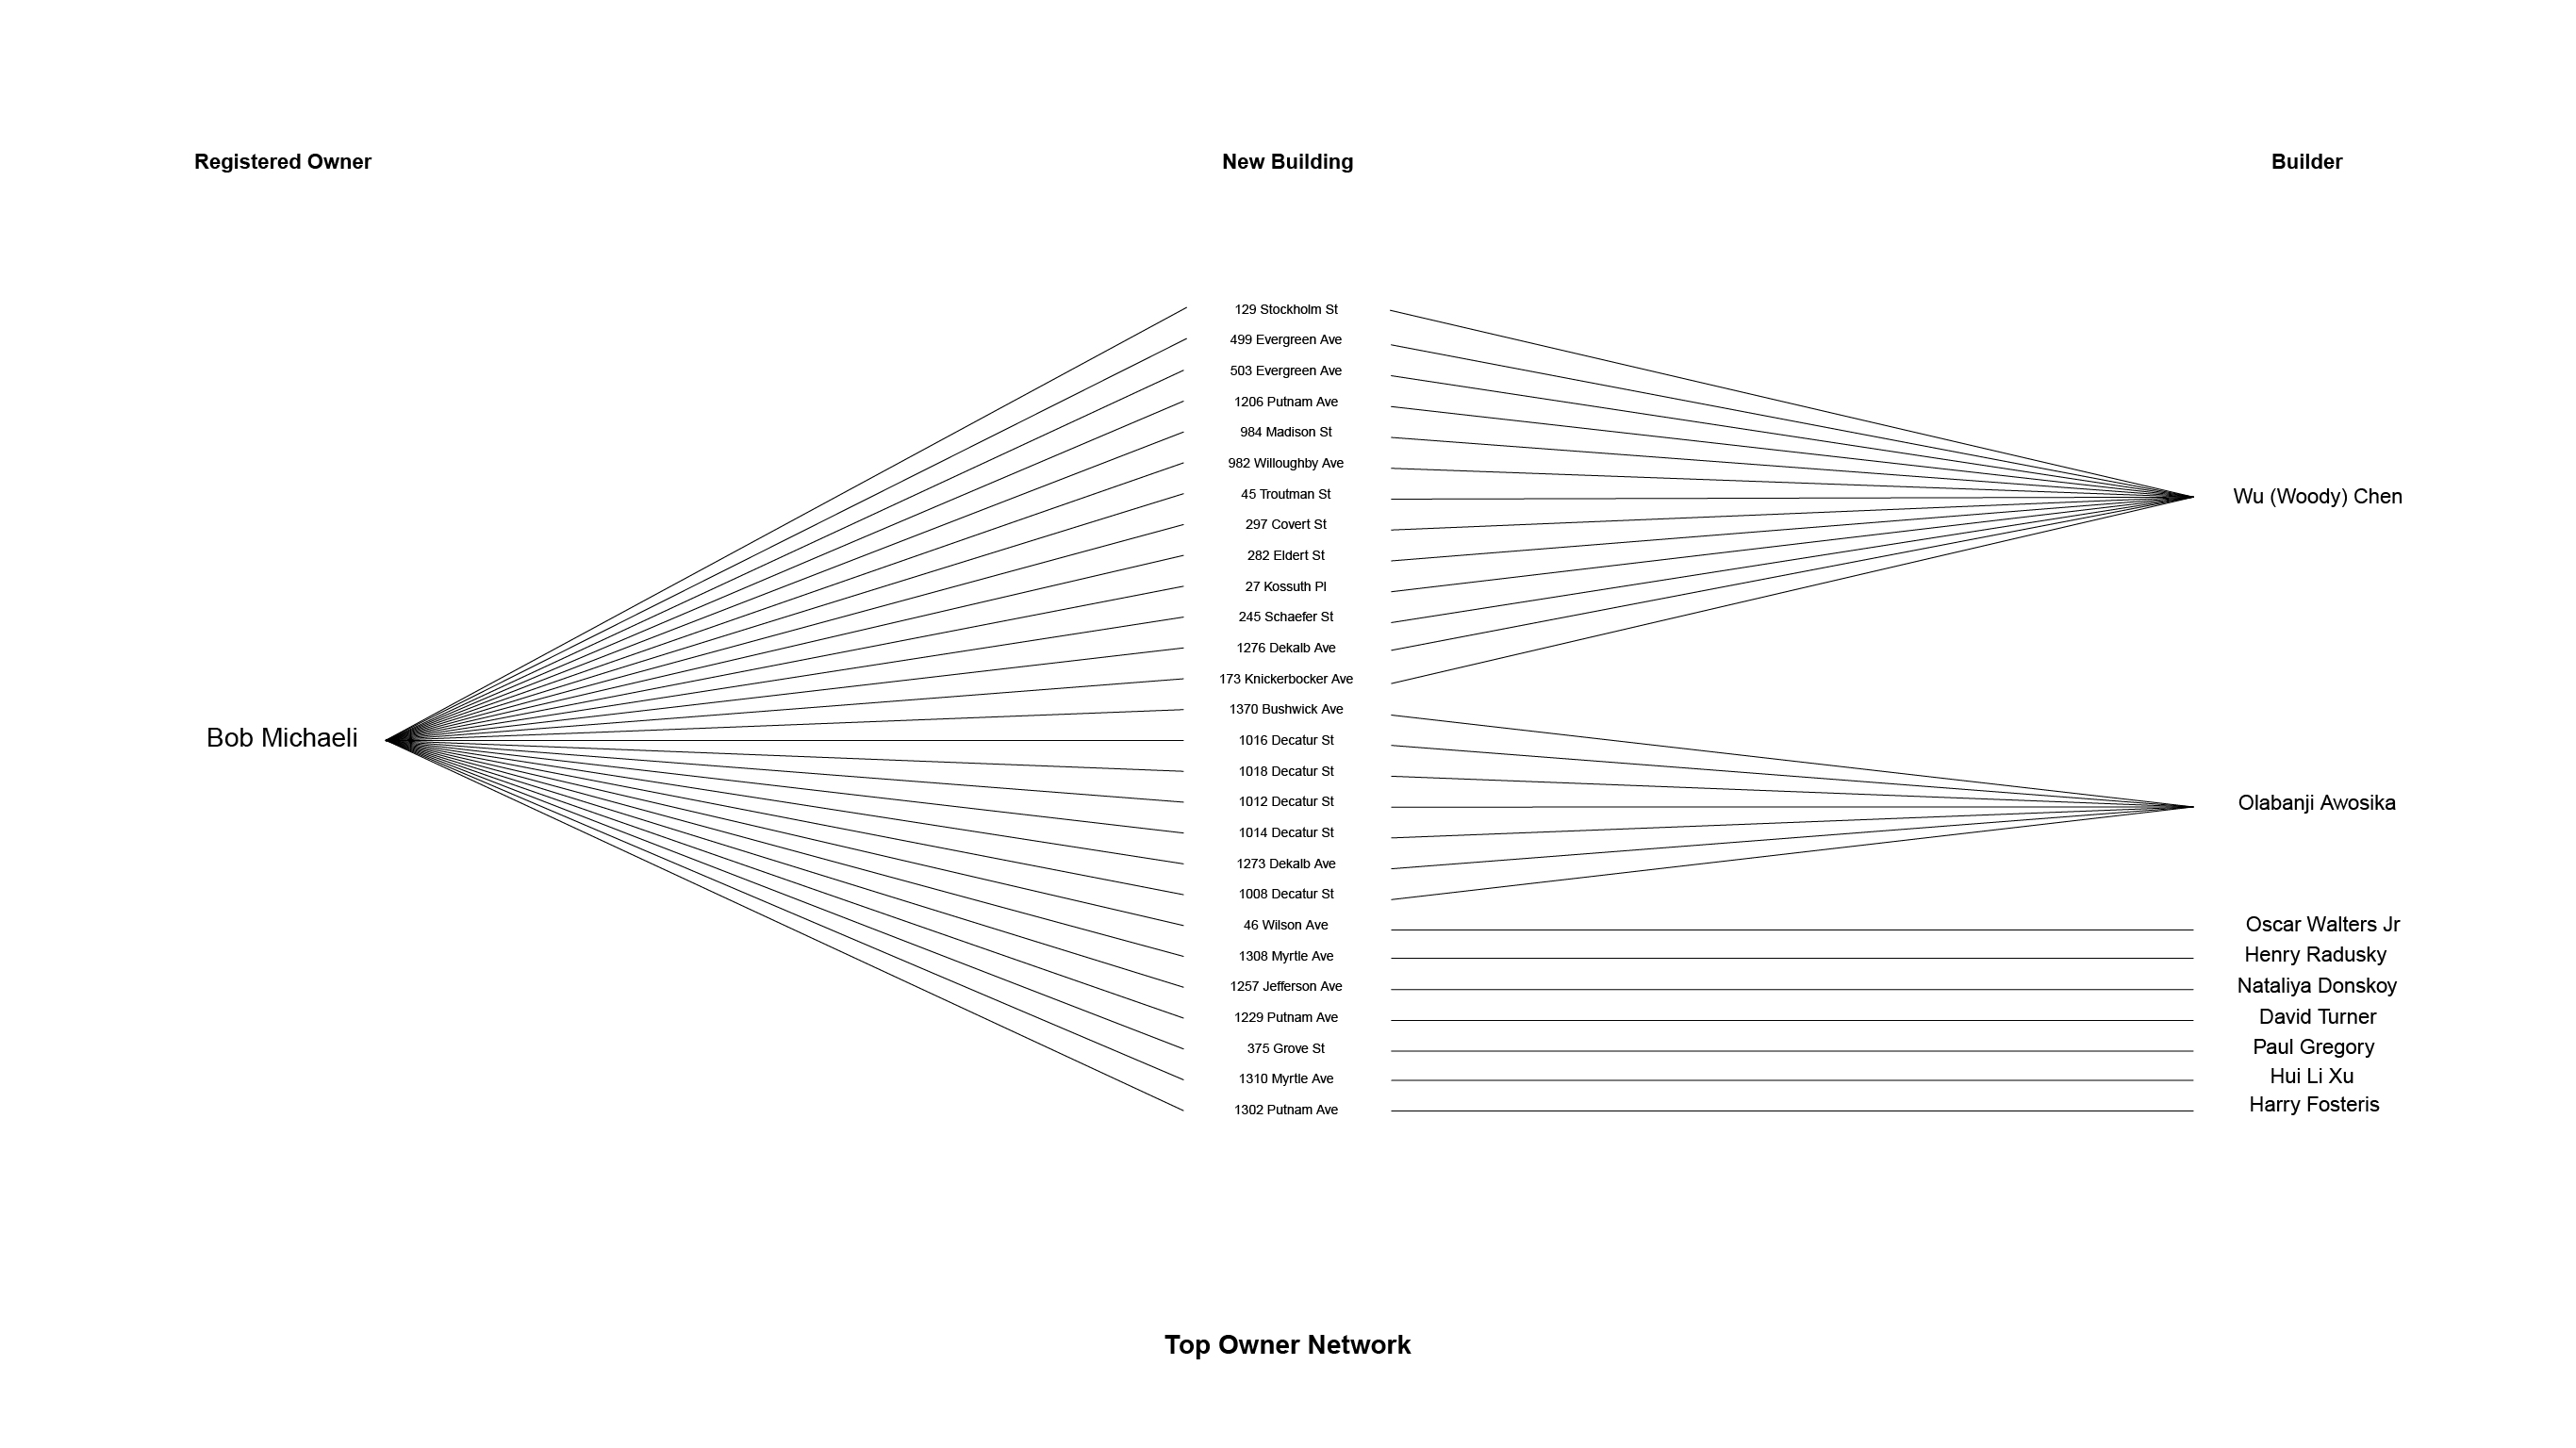
The diagram shows Bob Michaeli’s network with the new building and the contractor (builder).
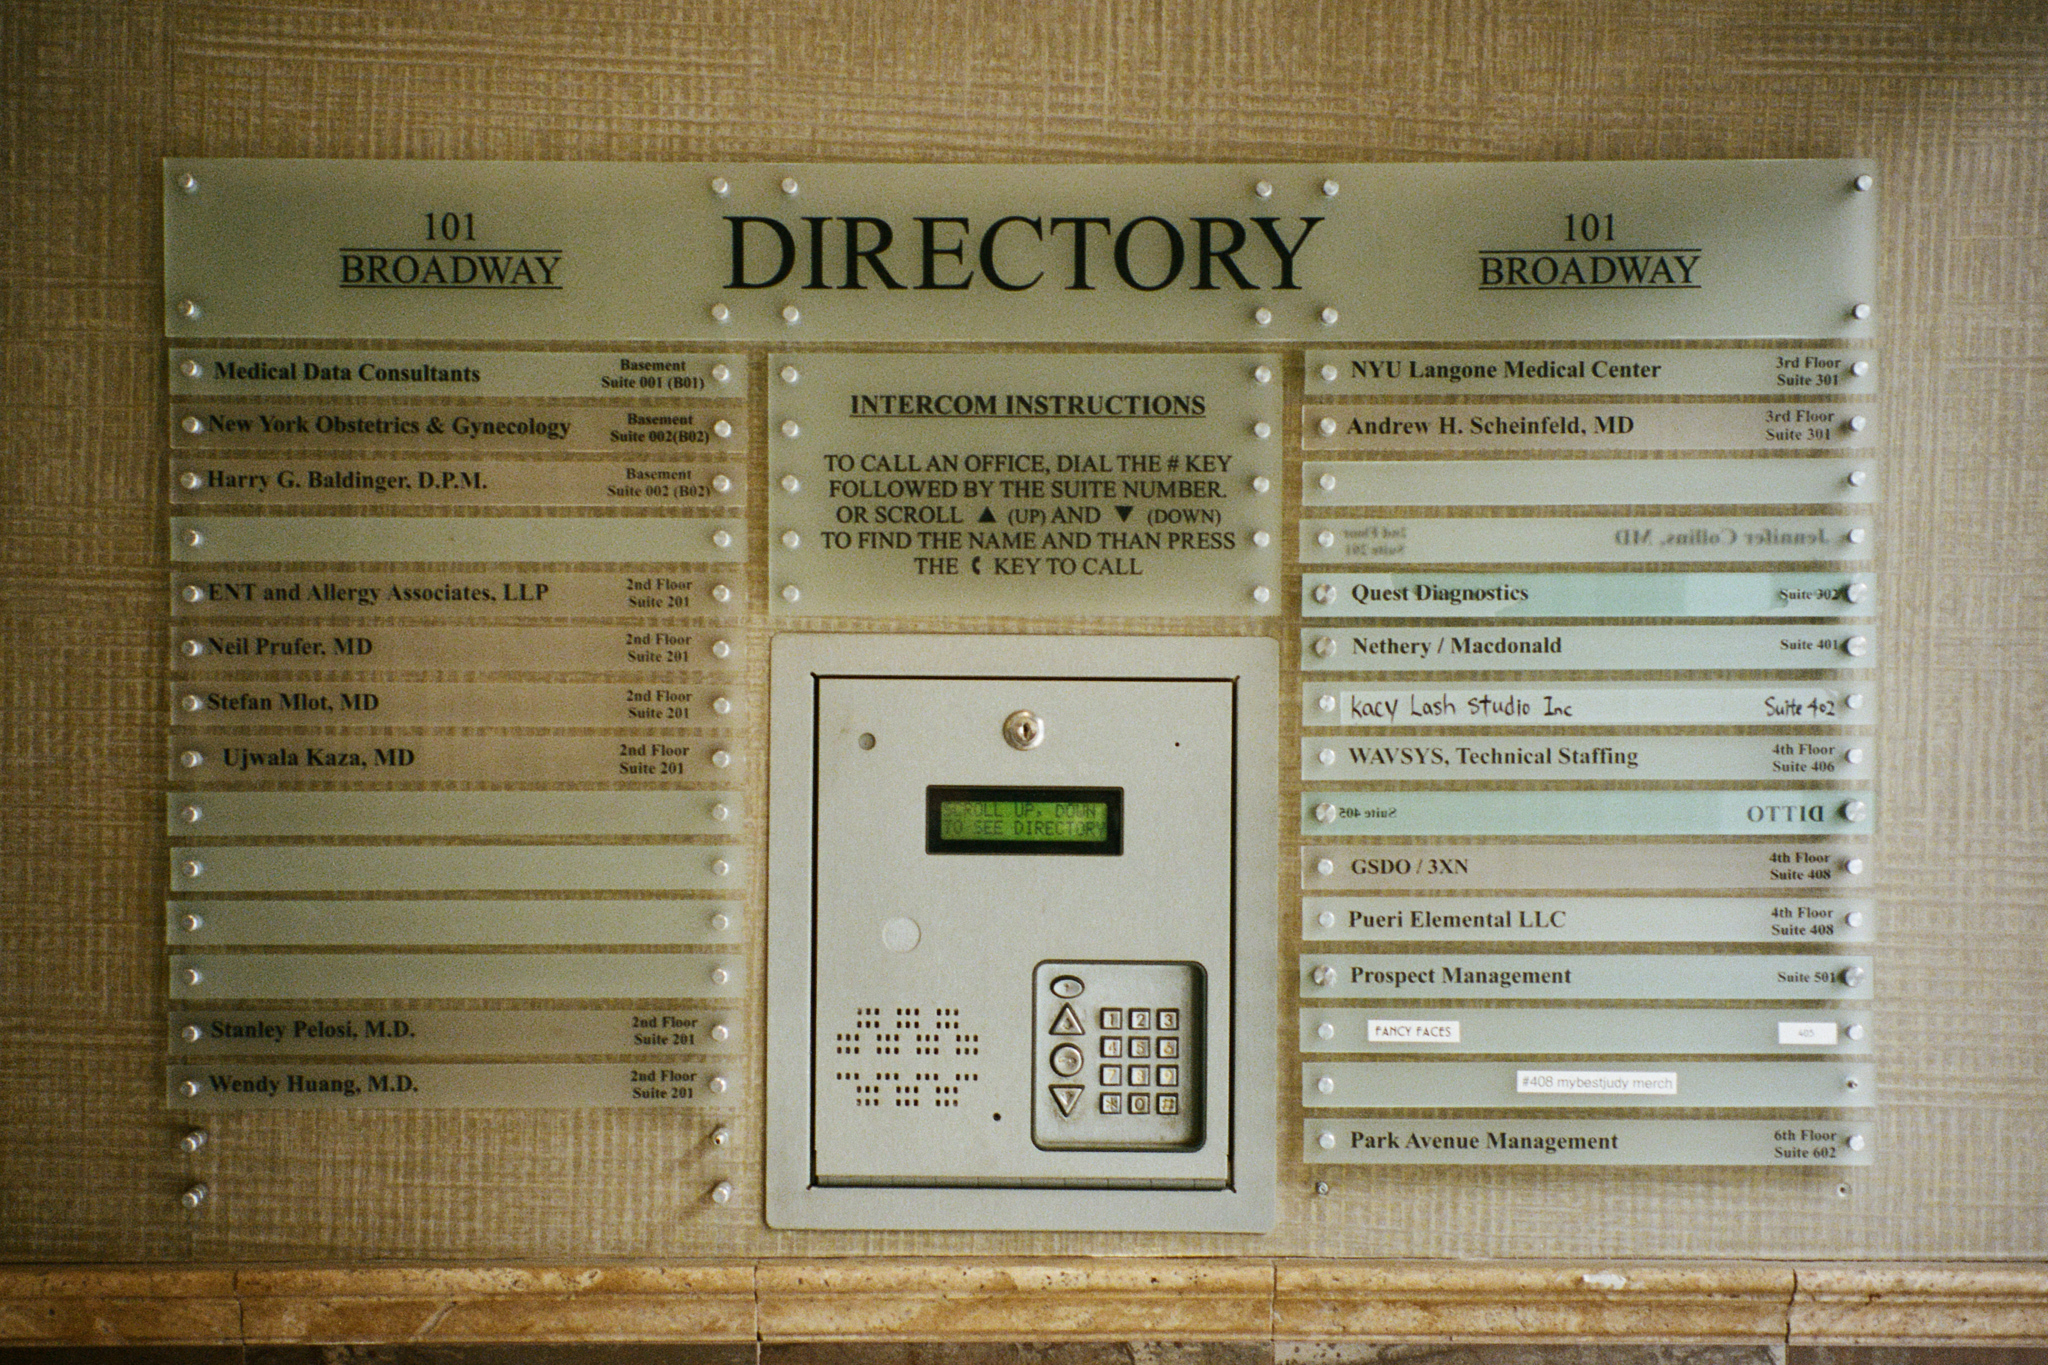
Bob Michaeli’s Urban View Development Group Inc. is registered at 101 Broadway in South Williamsburg. The company’s name doesn’t show up in the directory. Based on Google reviews, it is likely associated with Prospect Management at the bottom left.
Top Owner’s Address
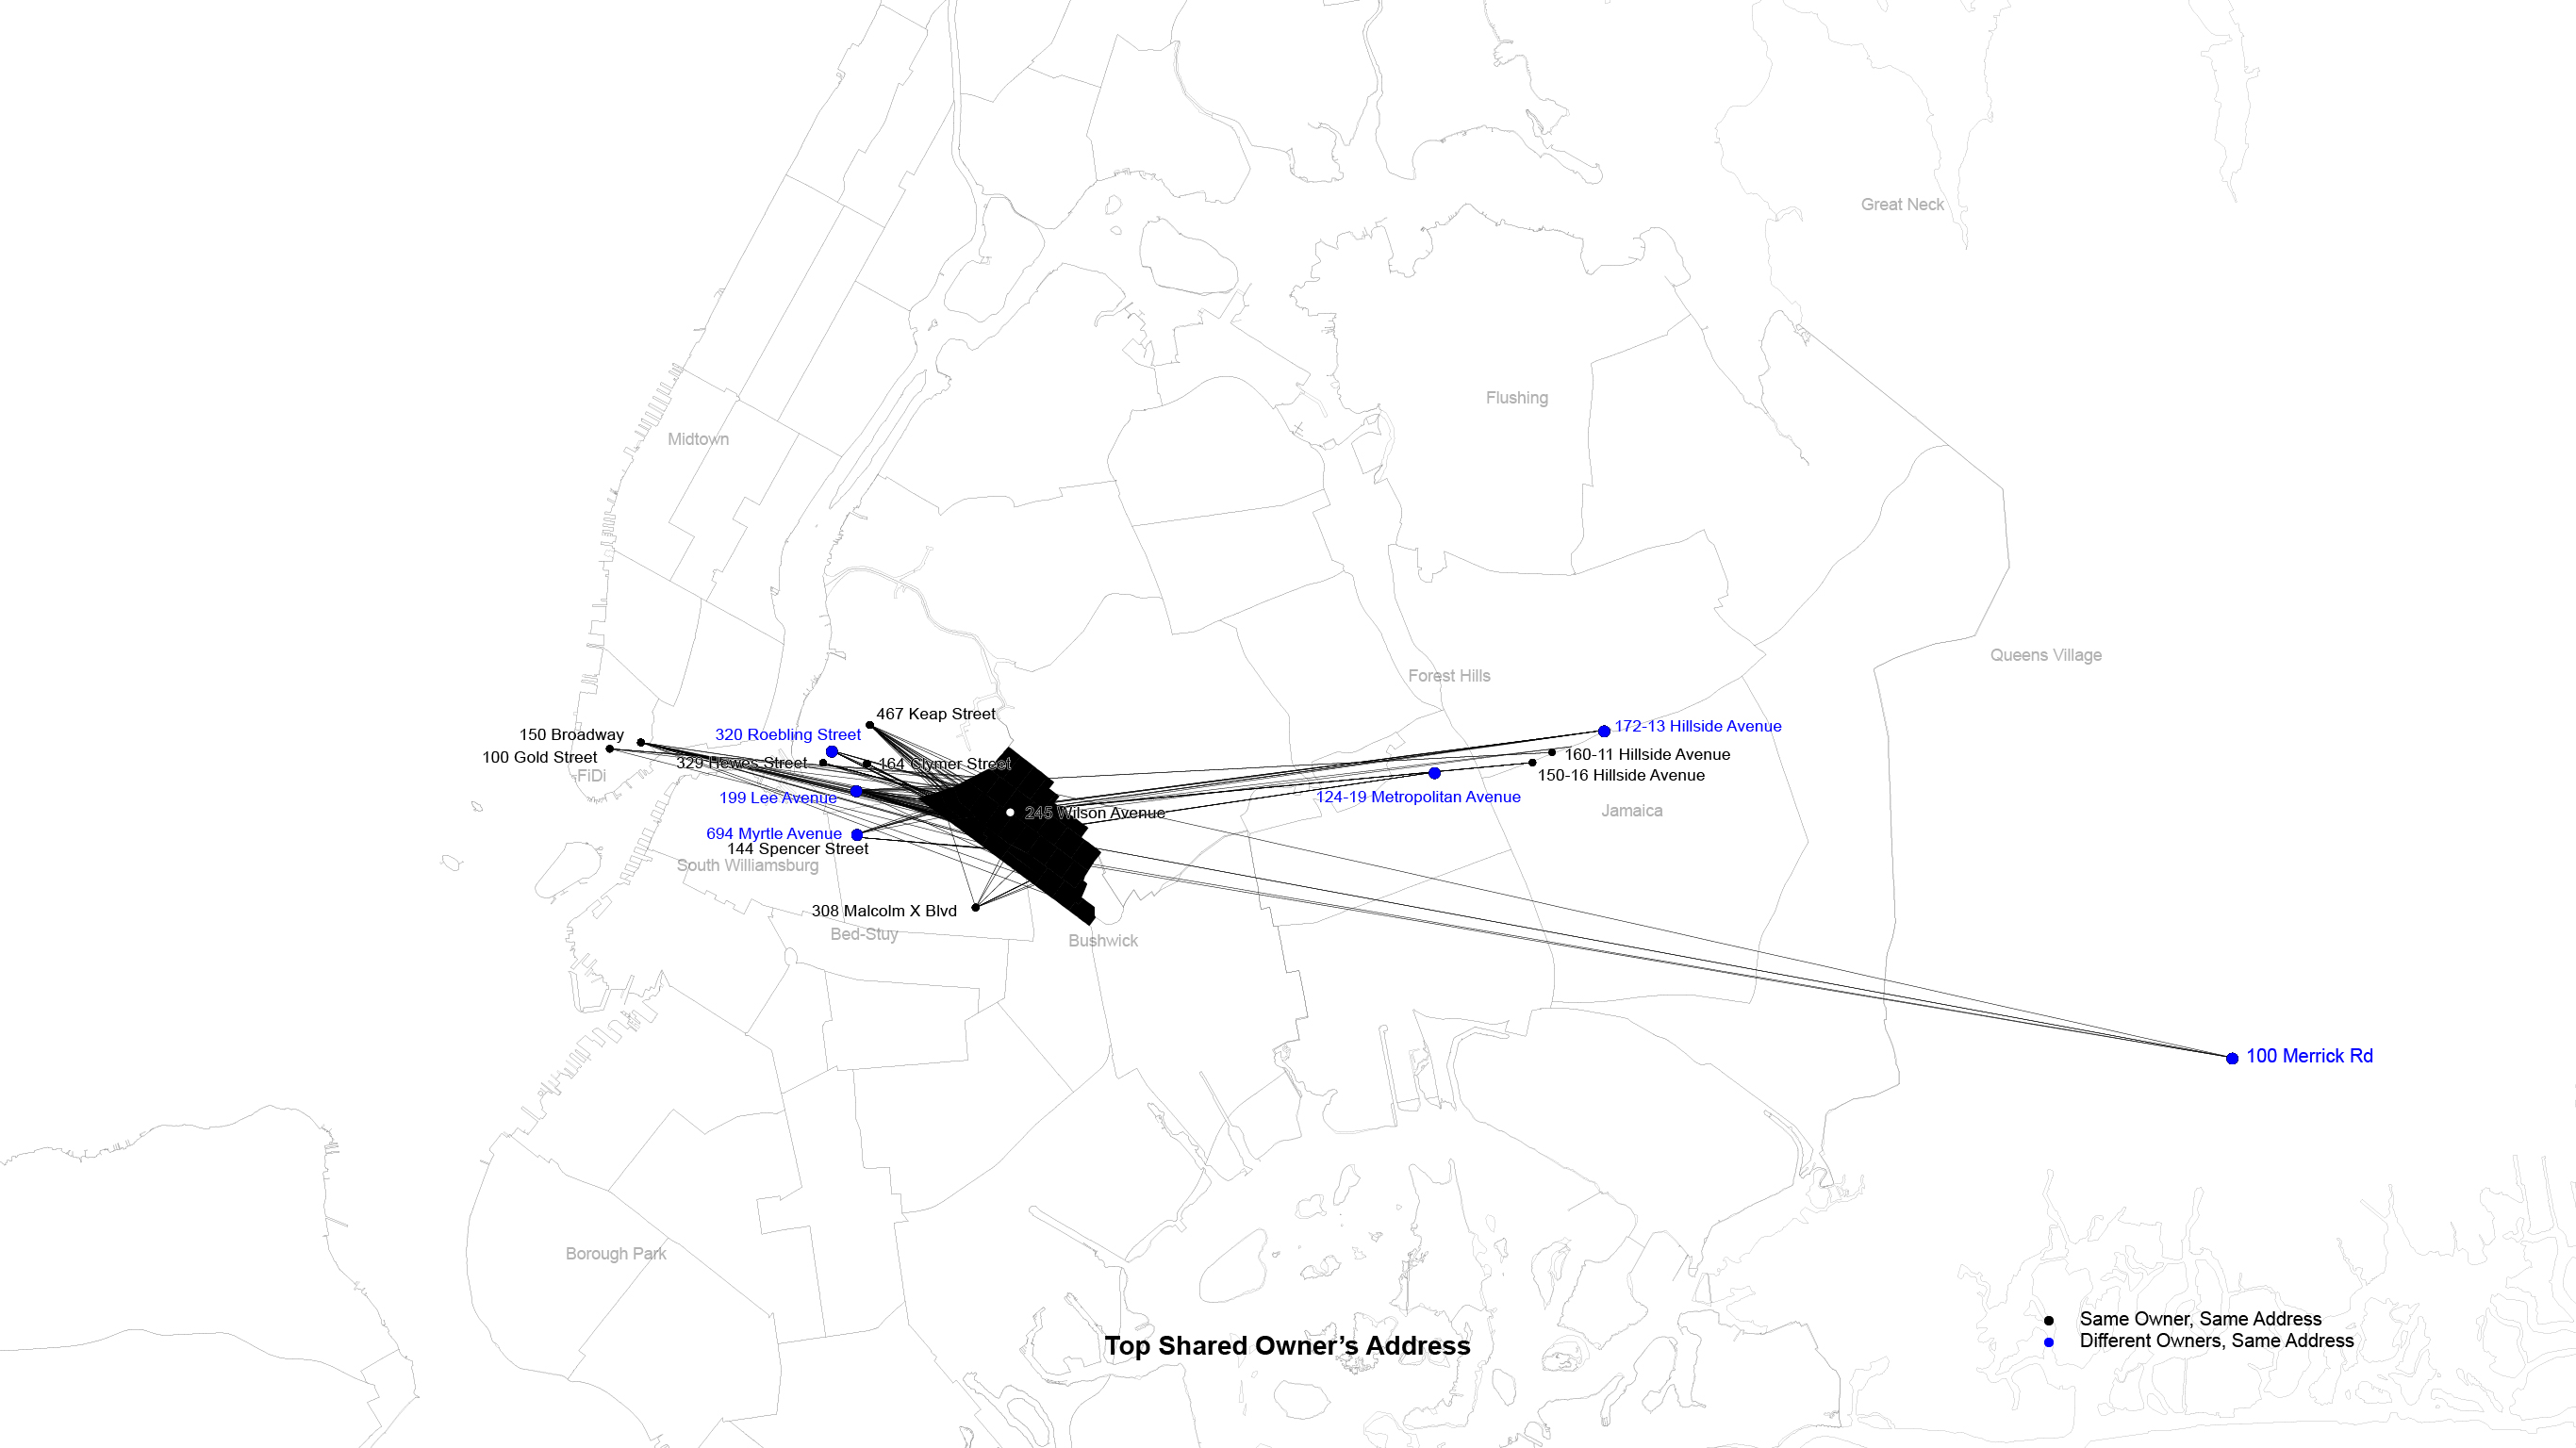
The map shows the top owners’ (outliers) addresses. The blue color indicates they have multiple owners at the same address.
There are 291 unique owner’s (business) addresses compared to 299 individual owners for 536 new buildings. It indicates there are shared owner’s addresses at the same buildings. There are two possible scenarios. First, the shared address has private mailboxes for different LLCs. Addresses like 320 Roebling Street and 199 Lee Avenue provide mailing service on the first floor. Second, there are other fee developers for the same real estate firm, and they all use the real estate firm’s address as the owner’s address. 12 top owner’s addresses (outliers) developed 161 buildings, which took around 30% of the entire Bushwick’s new buildings. The top shared owner’s address is 199 Lee Avenue in South Williamsburg. 37 new building LLCs are based at this address.
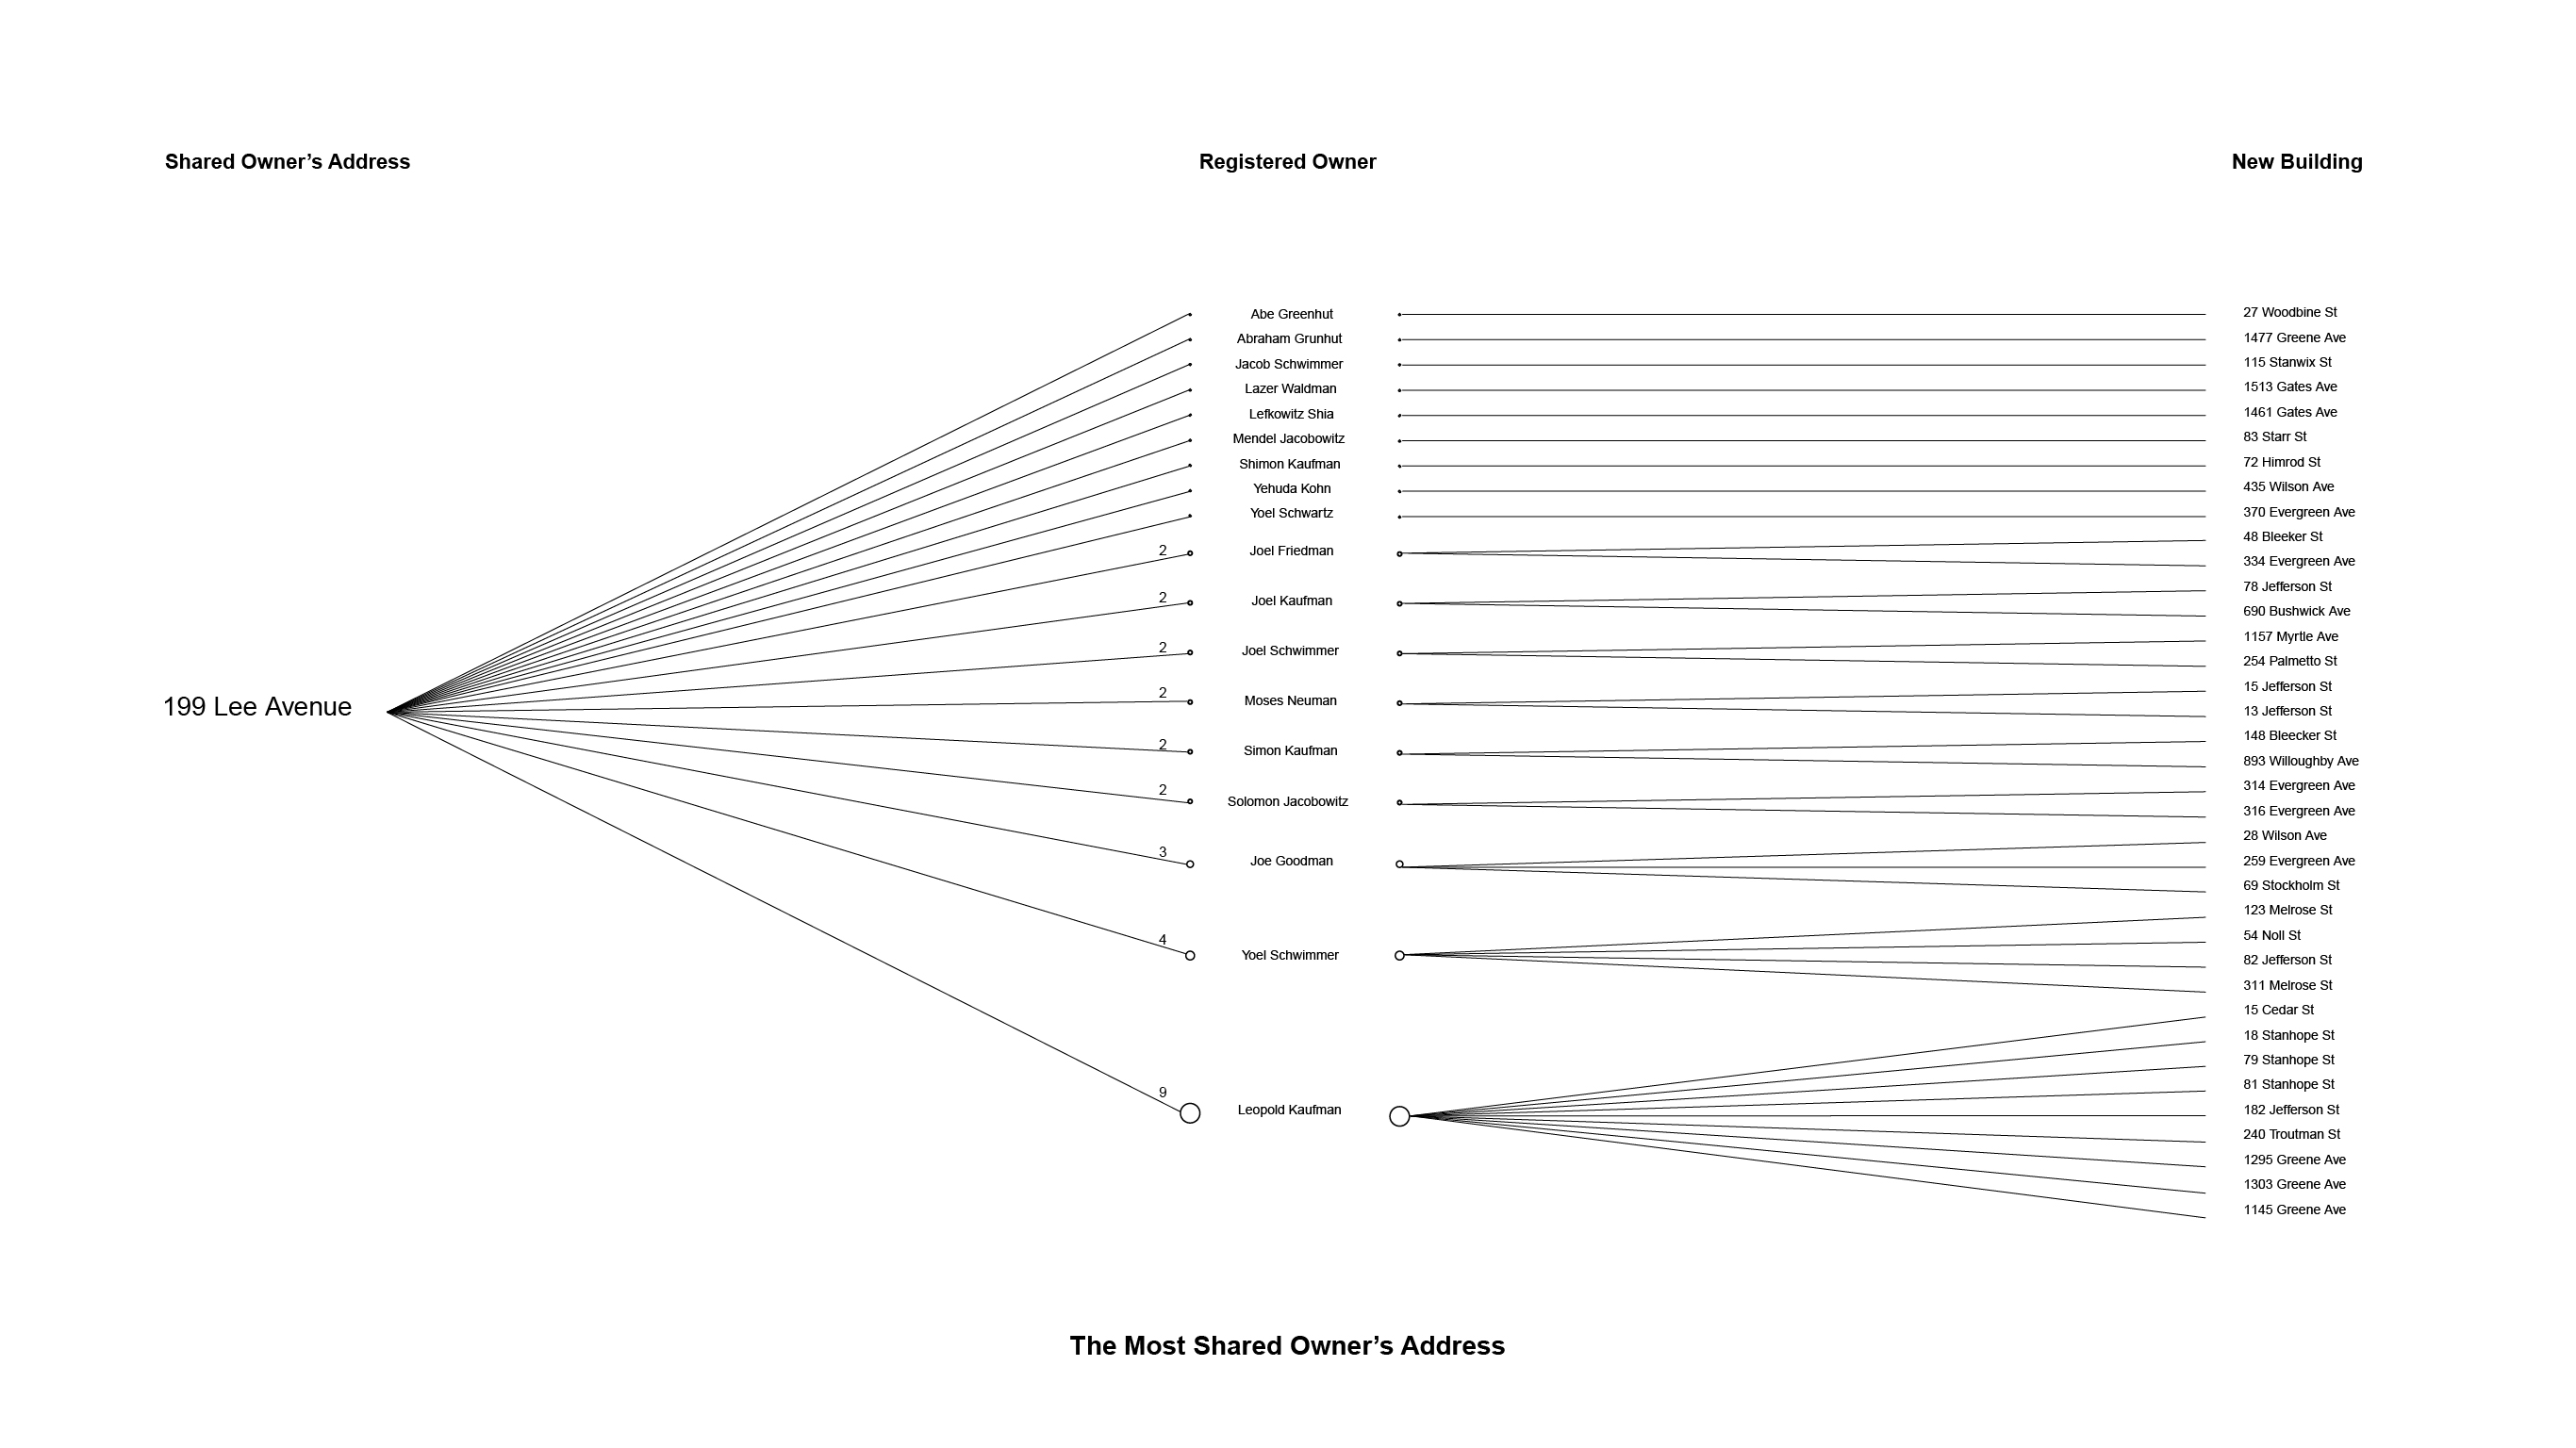
The diagram shows 199 Lee Avenue’s network with the registered owner and the new building.
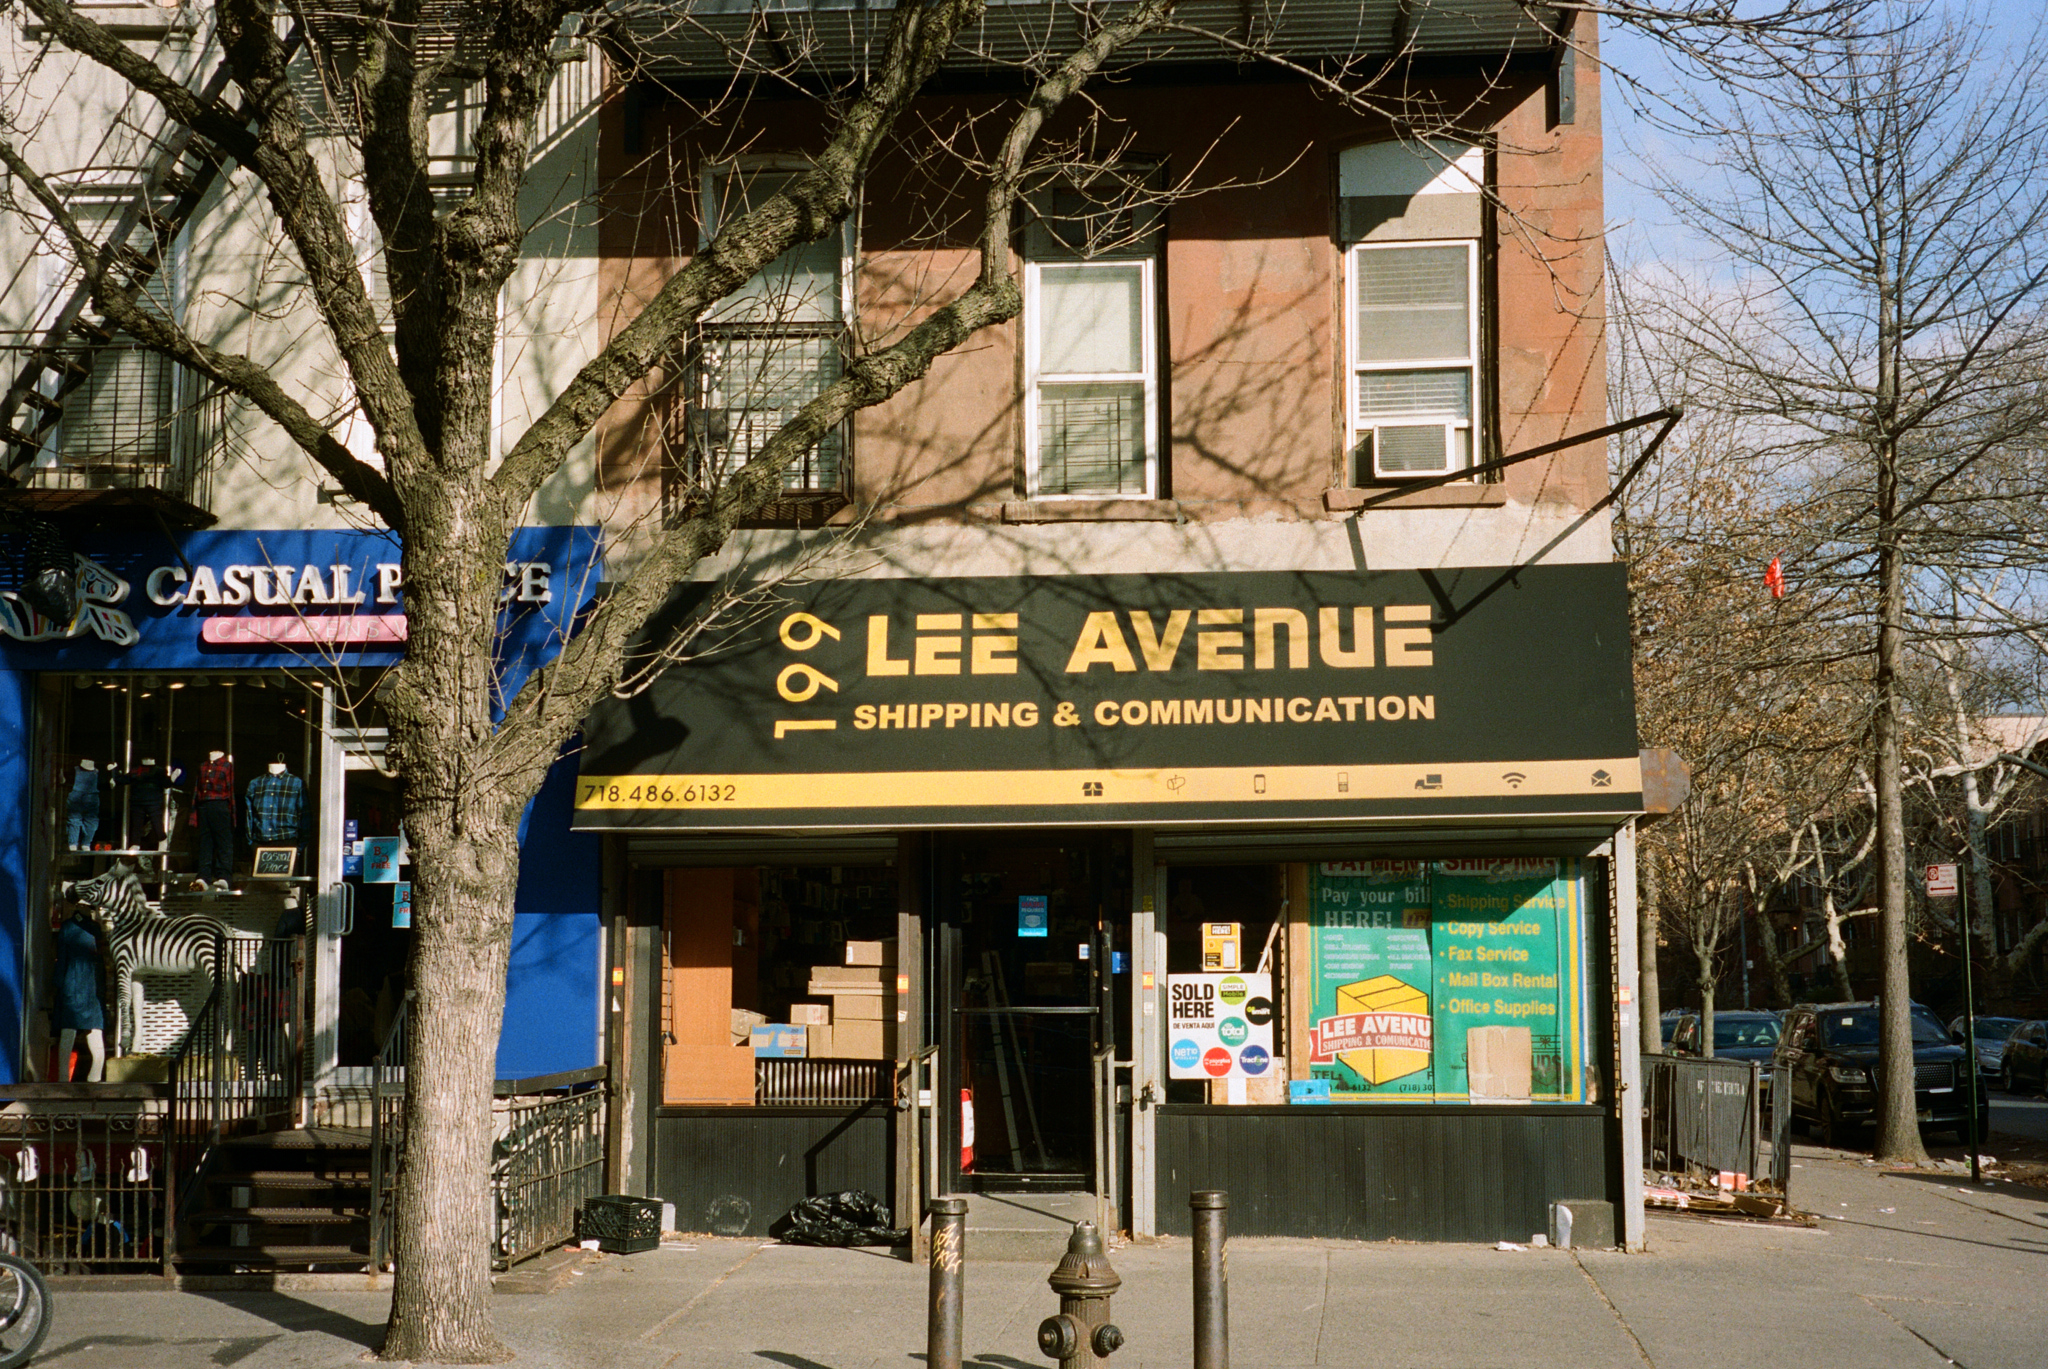
The storefront of 199 Lee Avenue is a shipping store. There are multiple building LLCs registered at this location.
Top Builder
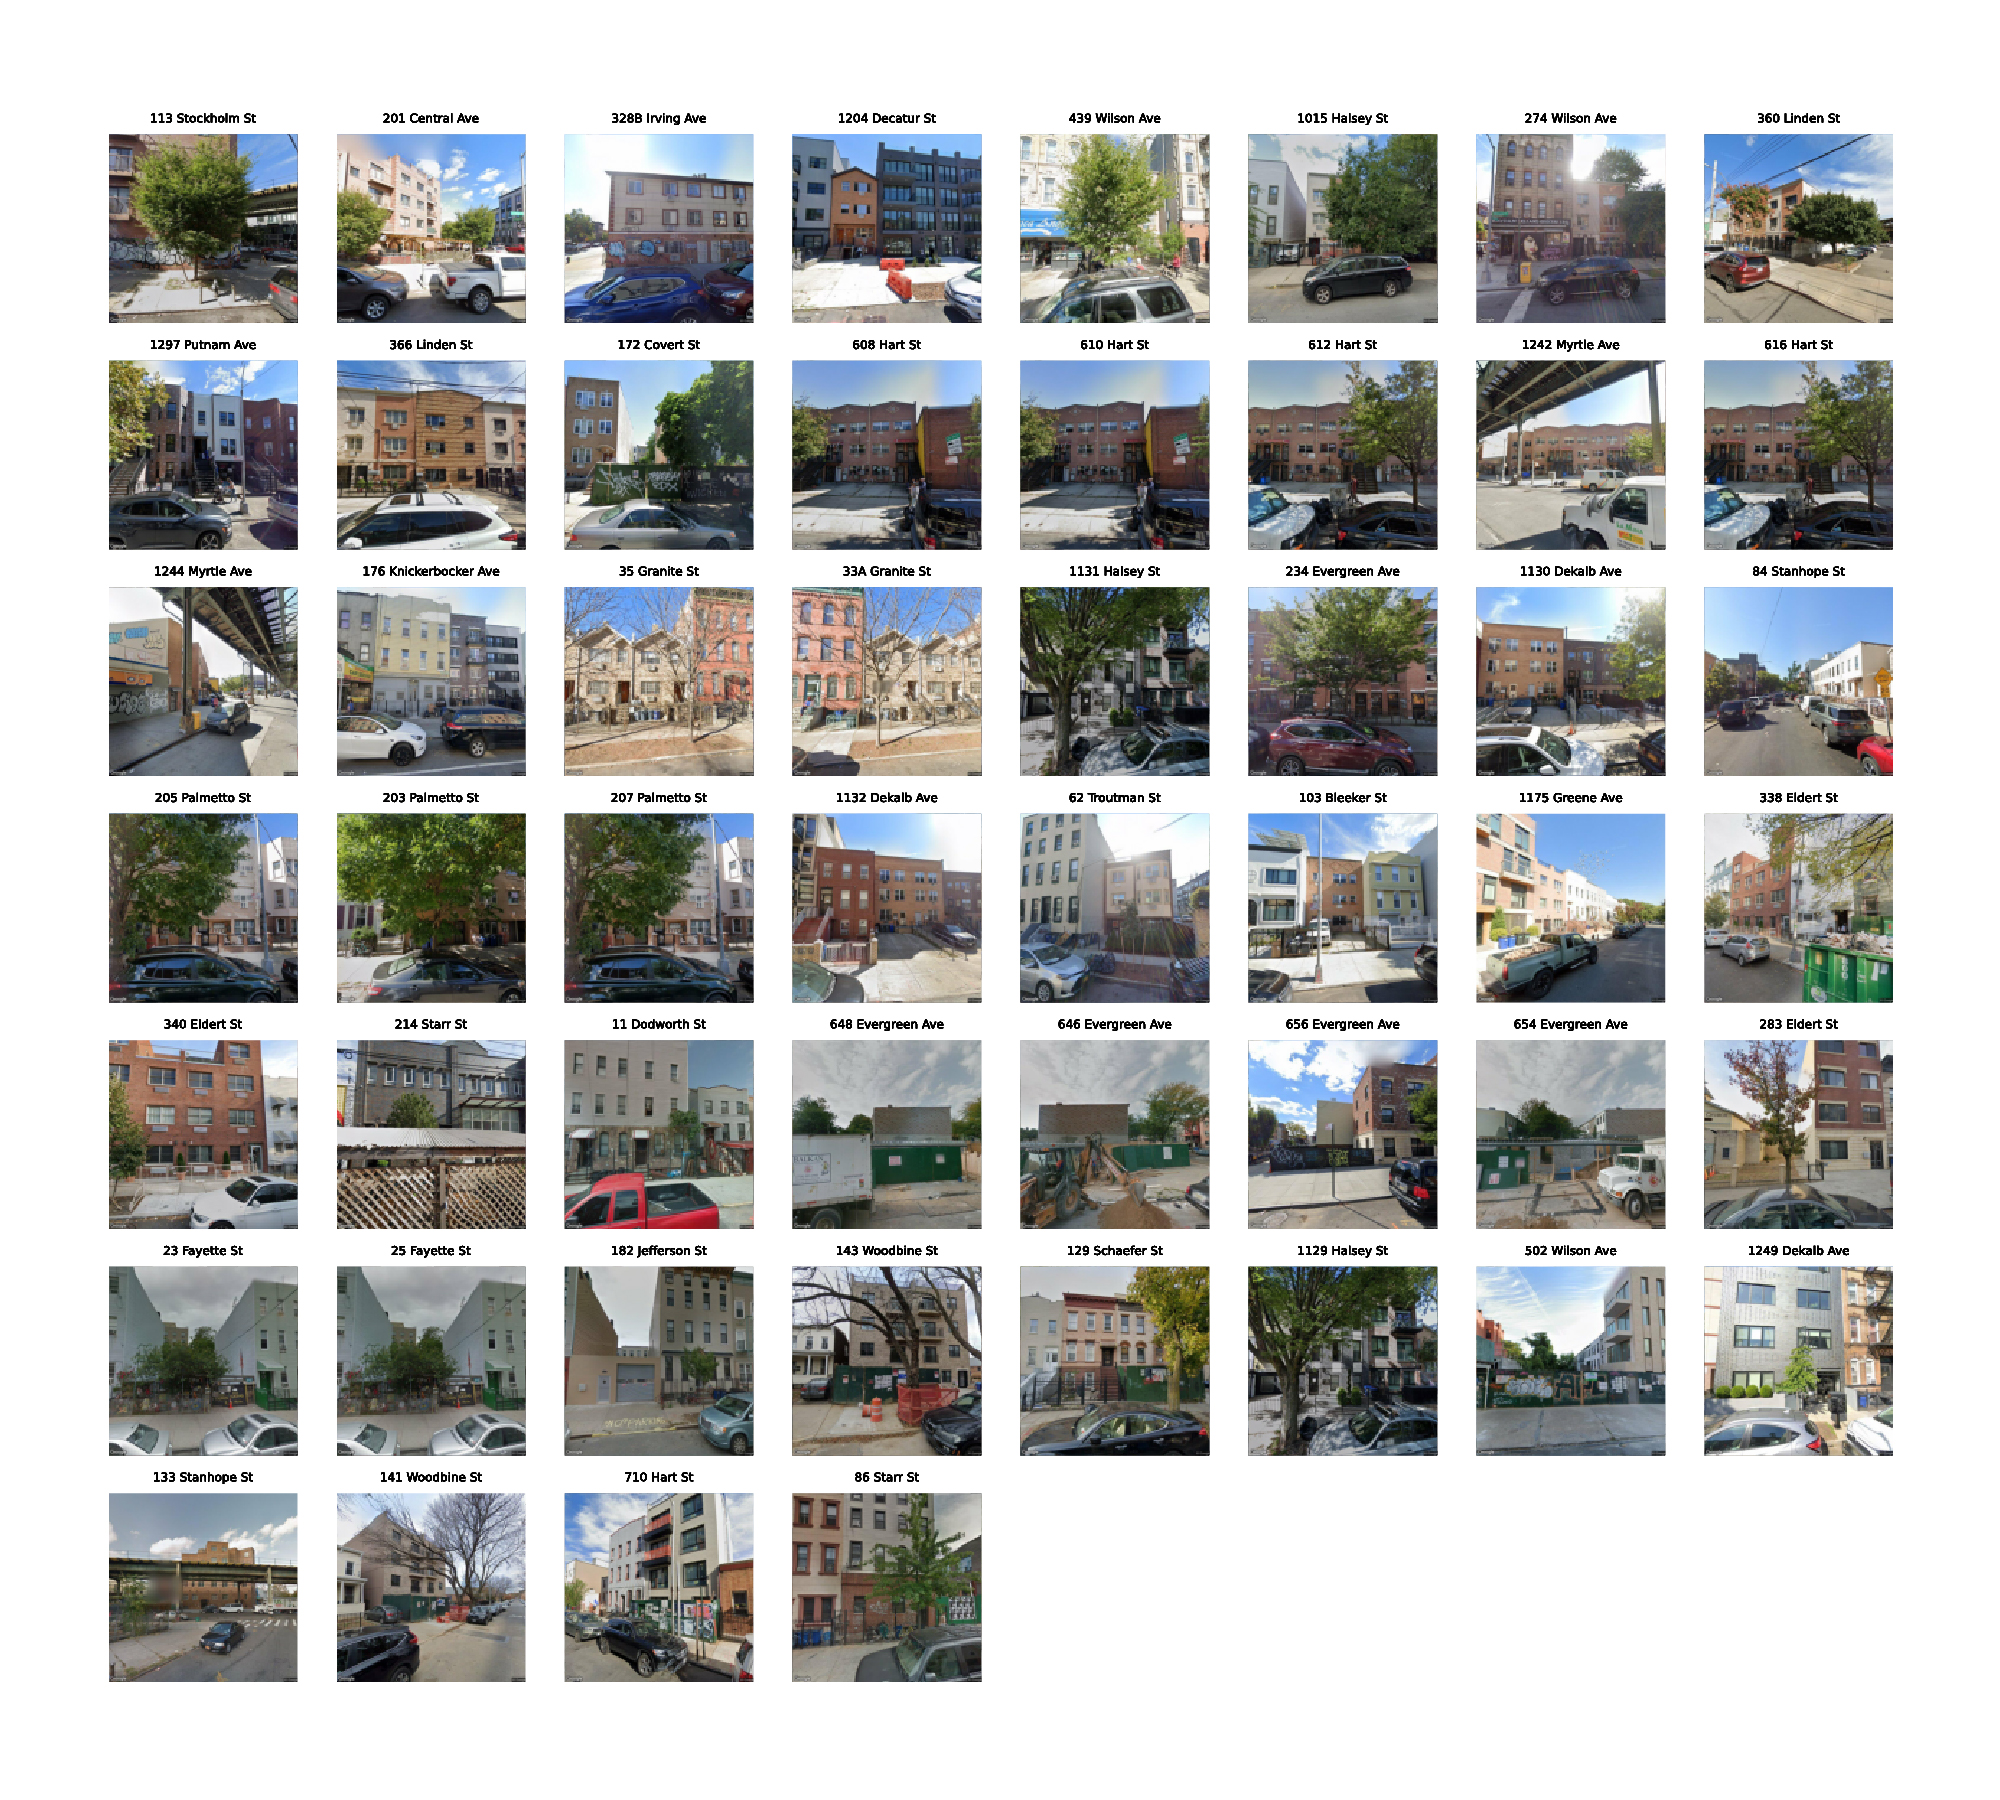
The plot shows properties built by Gerald J Caliendo. Most buildings are multi-family housing with a humble look.
There are 152 builders, including architects or contractors, for 536 new buildings. The top builders (outliers), sorted descendingly, are Gerald J Caliendo (52), Bahram Tehrani (31), Wu (Woody) Chen (30), Olabanji Awosika (28), Diego B Aguilera (21), Suresh Manchanda (19), Charles Mallea (16), Boaz Golani (15), Robert Bianchini (14), Aryeh Siegel (10), and Douglas Pulaski (10). 45.9% of the new buildings were built by the listed builders. Gerald J Caliendo tops the chart by building 52 new buildings in Bushwick.
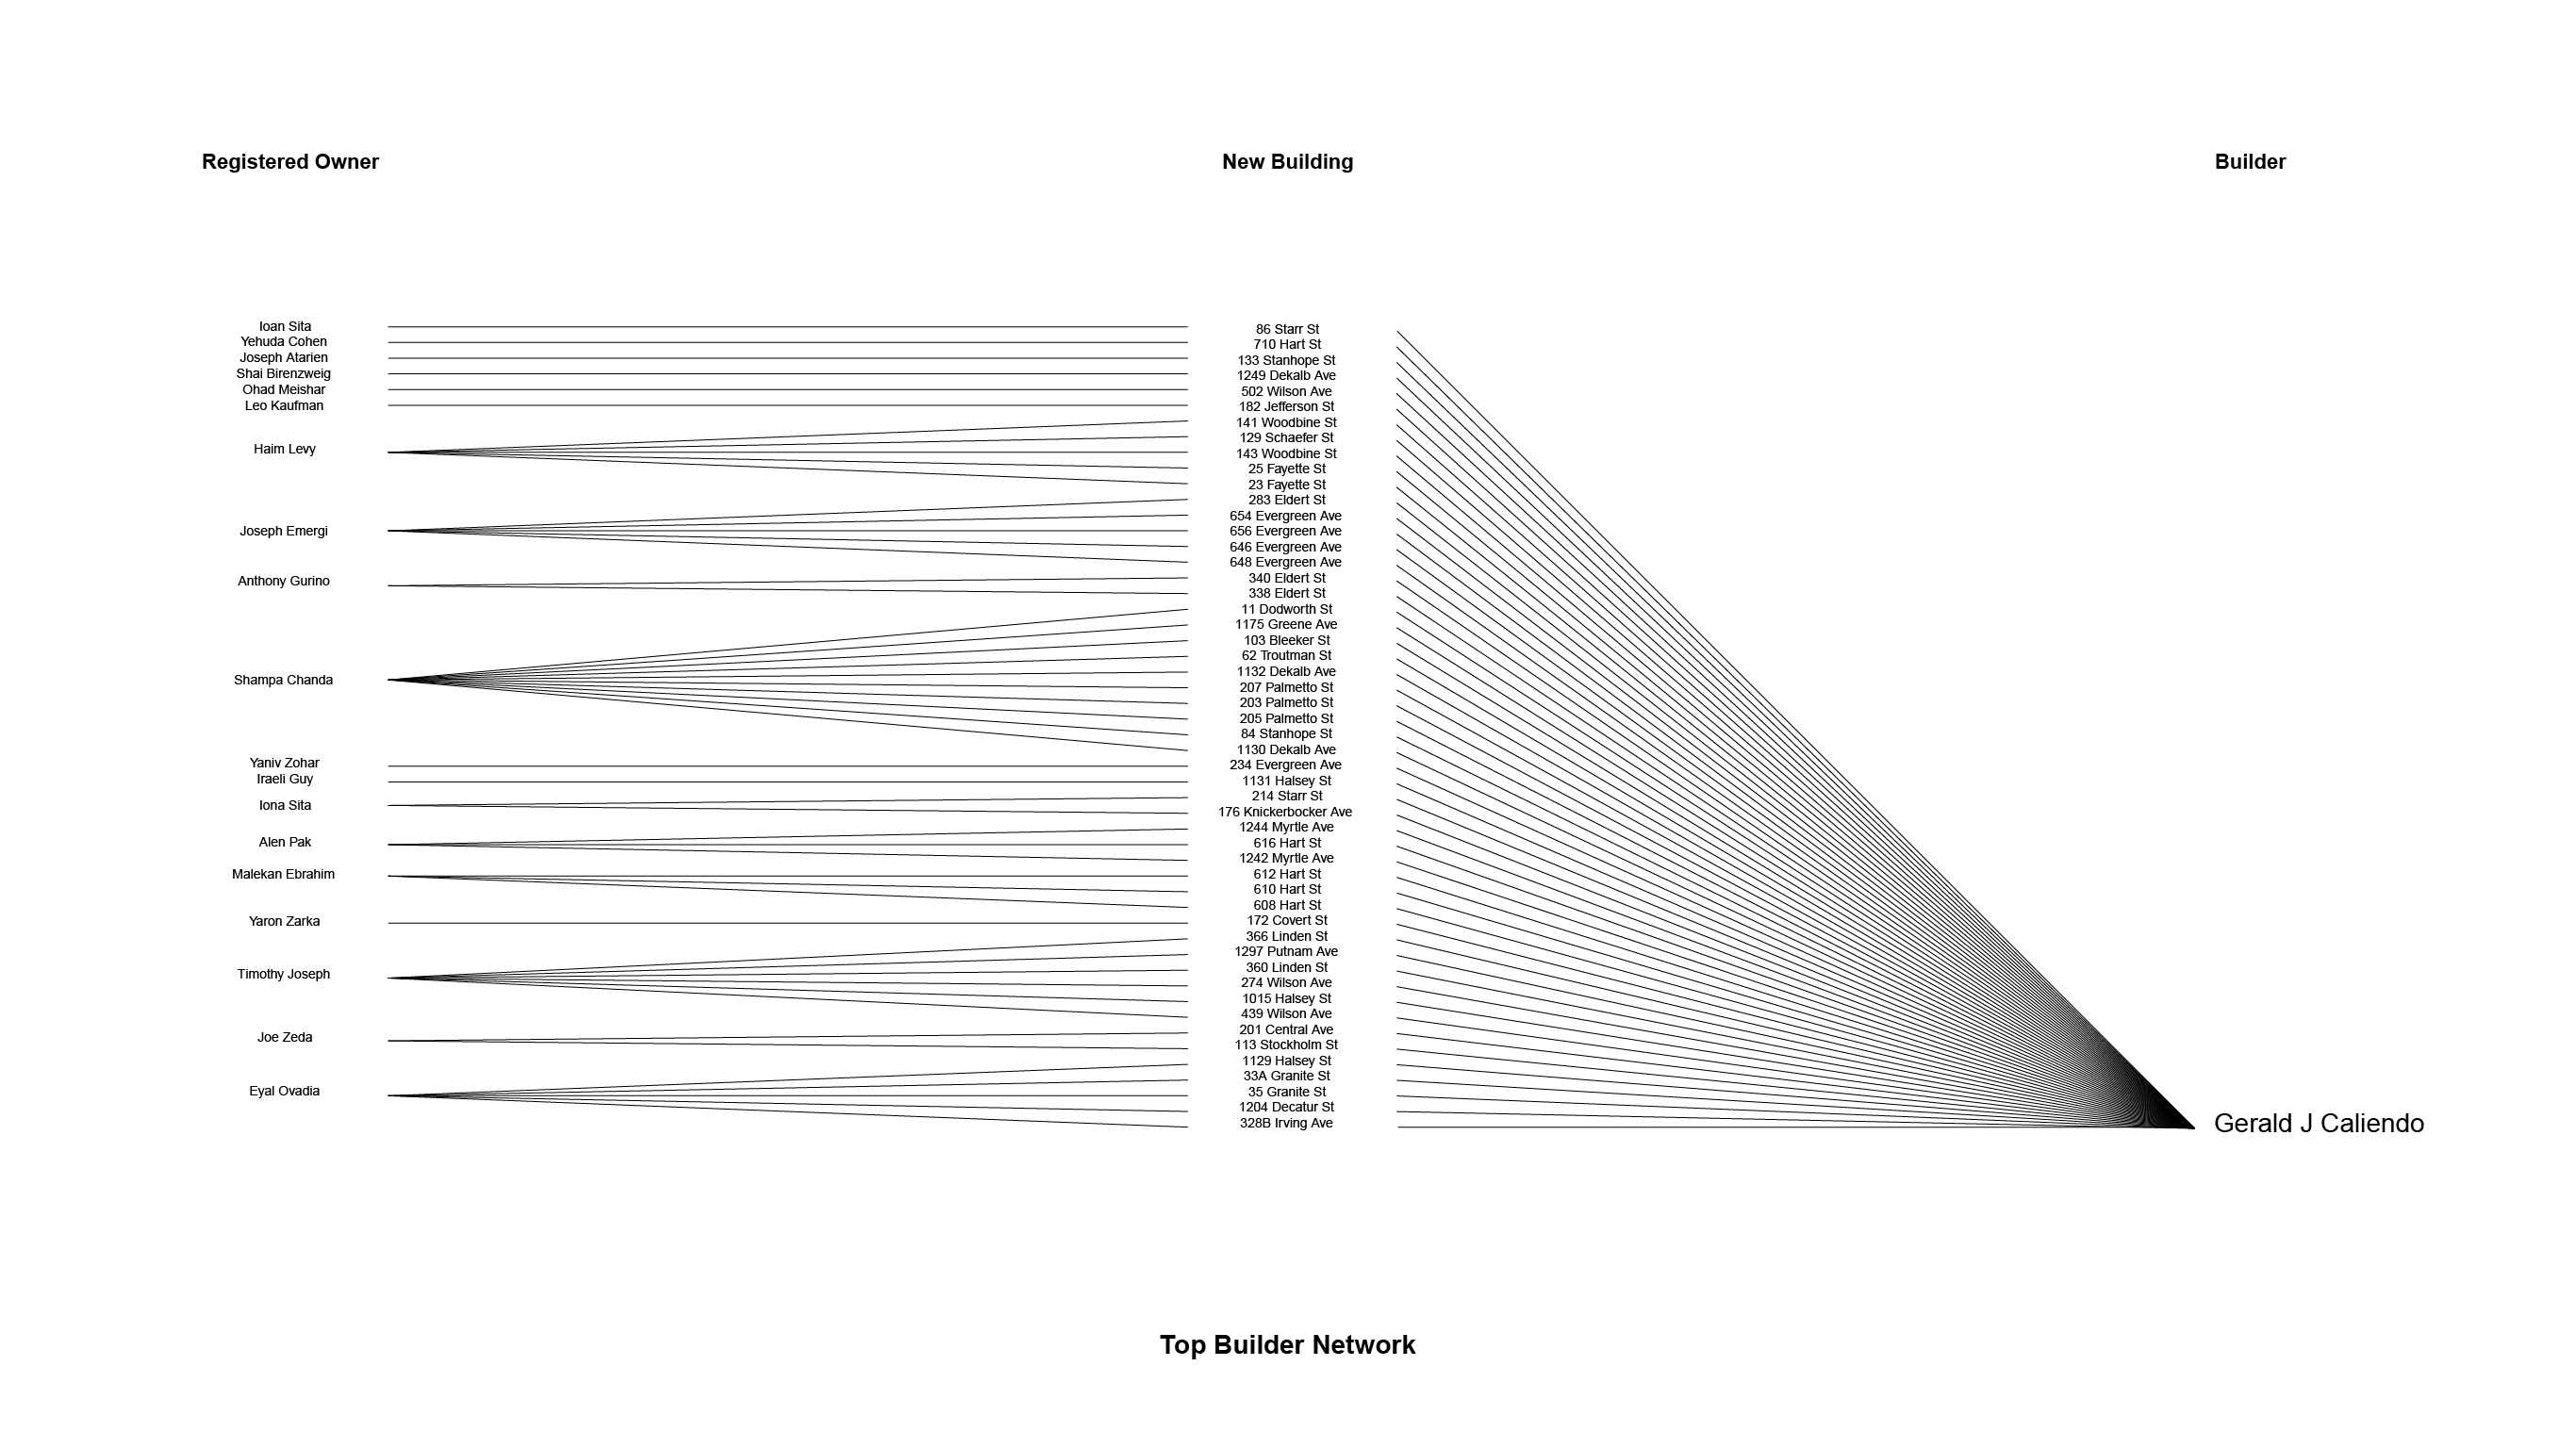
The diagram shows Gerald J Caliendo’s network with the owner and the building.
Conclusion
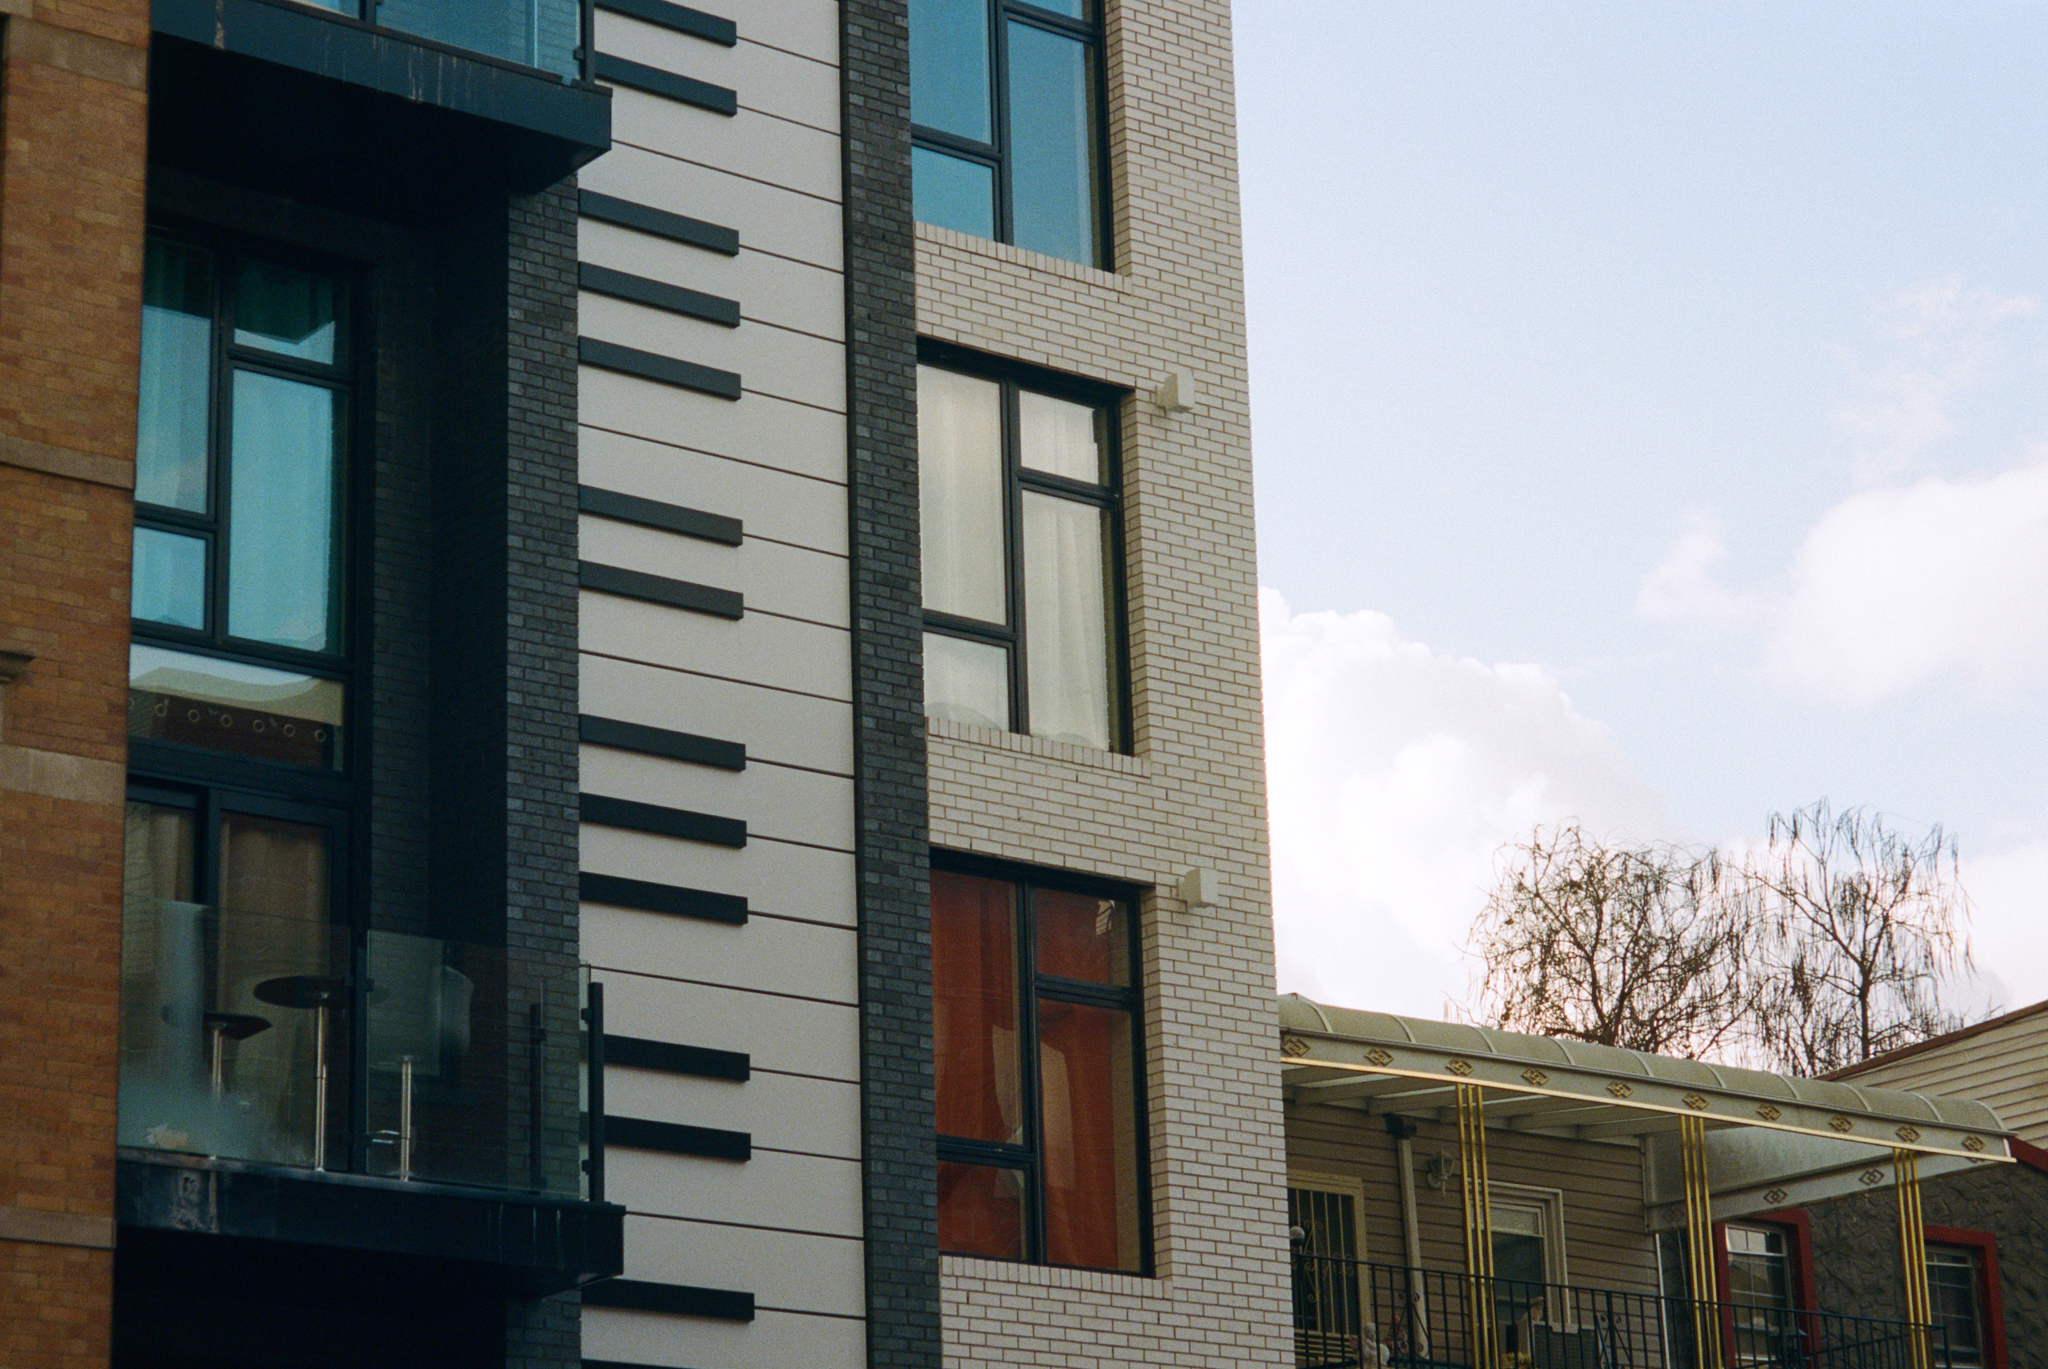
The piano building at 334 Evergreen Ave was developed by Joel Friedman and built by Shawn E Stiles.
Bushwick’s development provides a snapshot of recent economic trends. Following COVID-19, the surge of new developments seems to have slowed down considerably, although Bushwick still is more active than the city average. Despite the concentration of the area’s development, the excess of new housing in outer borough pockets appears to be insufficient to meet the saturated demand city-wide. Searching for the next work-in-progress may be a more practical task. The project aims to uncover who initially developed and owned Bushwick’s new buildings that were too ephemeral to capture by the public eye. The quantitative initiation to remake a place into something different is the phenomenon I want to capture.
To clarify my standpoint and acknowledge the bigger topic of gentrification, the first is the causation. The project is simply about discovering new building trends in Bushwick; many other factors contribute to gentrification. In addition, there is no scientific metric to define gentrification; I would need to insert my perspective besides the available data. The project encourages viewers to have their interpretation and question whether the trend is good or not for the city’s demand. The second is about Bushwick’s ownership. The capital structure from financial institutions, equity models, and subsequent buying and selling patterns may have a greater impact on the true ownership of those properties. However, the capital structure of real estate development, the complexity of gentrification, and changes in economic and demographic characteristics in the neighborhood are beyond the scope of this project.
Methodology
It is important to address the methodology for data collection and analysis in the project for transparency.
For data collection, first, the primary data was downloaded from NYC Open Data, DOB Permit Issuance. I selected community district “304,” which is equal to the neighborhood of Bushwick. Then, I filtered only “NB,” which meant new building in the permit type column, and the permit sequence to “01” to avoid any duplication. Second, in order to fill out the missing data, which was mostly in the owner’s address column, I used several websites like MSCI Real Capital Analytics, OpenCorporates, and Realty Hop to find the owner’s (company) address. Since most of the building permits had either owner’s name or the owner’s business name, it was possible to find out the owner’s (company) address by cross-referencing. Third, to add and find out the architect or contractor for the building, I created a new column and used Market Proof, CheckPermits, and the Real Deal website to find information. Finally, I used Python and OpenStreetMap API to find the coordinates of each owner’s address. The data set was ready to use for mapping and network analysis at this stage.
There were three main parts to my analysis. The first was mapping. To calculate clusters for mapping, I converted the owner’s address coordinates into XY points in ArcGIS. Then, I used clustering in an aggregation function to make dynamic point clusters. Since the owner’s points had apparent aggregation, the dynamic point clusters were enough to distinguish where the clusters were located in which neighborhoods. It was unnecessary to count how many points were in the precise neighborhood boundary. Second, to calculate outliers for the owner’s name, owner’s address, and contractor, I used the interquartile range method. Due to the spikes that caused non-normal distribution in the data set, the IQR method was more ideal to find outliers than the standard distribution method. The formula for the IQR method was: Q3 + 3 IQR. The Third was network analysis. For network analysis, I used an R script to convert the focused columns into nodes. Then, I calculated the degree of the vertex. Finally, I plotted the graph as a tree layout.
Acknowledgments
The project was advised by Professor Laura Kurgan and Adjunct Assistant Professor Josh Begley at Columbia University. To complete the data set, Adam Lawrence Fried from M.S. Real Estate at the Graduate School of Architecture, Planning, and Preservation (GSAPP) granted the MSCI Real Capital Analytics account access. I would like to thank many GSAPP faculty and students who reviewed the project. However, the text, the data accuracy, and any further issue of this project is my sole responsibility.
Data Source
References
-
Board of Governors of the Federal Reserve System (US), Federal Funds Effective Rate [FEDFUNDS], retrieved from FRED, Federal Reserve Bank of St. Louis; https://fred.stlouisfed.org/series/FEDFUNDS, May 1, 2023.
-
Housing Market Recovery in the Region - FEDERAL RESERVE BANK of NEW YORK. (n.d.). Retrieved May 3, 2023, from www.newyorkfed.org website: https://www.newyorkfed.org/regional/hpi-recovery#tabs-2
-
Drucker, J., & Lipton, E. (2019, August 31). How a Trump Tax Break to Help Poor Communities Became a Windfall for the Rich. The New York Times. Retrieved from https://www.nytimes.com/2019/08/31/business/tax-opportunity-zones.html
-
NYC Construction Dashboard. (n.d.). Retrieved May 3, 2023, from www.nyc.gov website: https://www.nyc.gov/assets/buildings/html/dob-development-report-2021.html
-
Kobrin, R. (2018). Jewish Immigrant Bankers, New York Real Estate, and American Finance, 1870–1914. In S. J. Ross, H. R. Diner, & L. Ansell (Eds.), Doing Business in America: A Jewish History (pp. 49–76). Purdue University Press. https://doi.org/10.2307/j.ctvh9w101.7
-
Deutsch, N., & Casper, M. (2021). A Fortress in Brooklyn. Yale University Press.