Housing, a Silent Weapon of Mass Destruction
INTRODUCTION
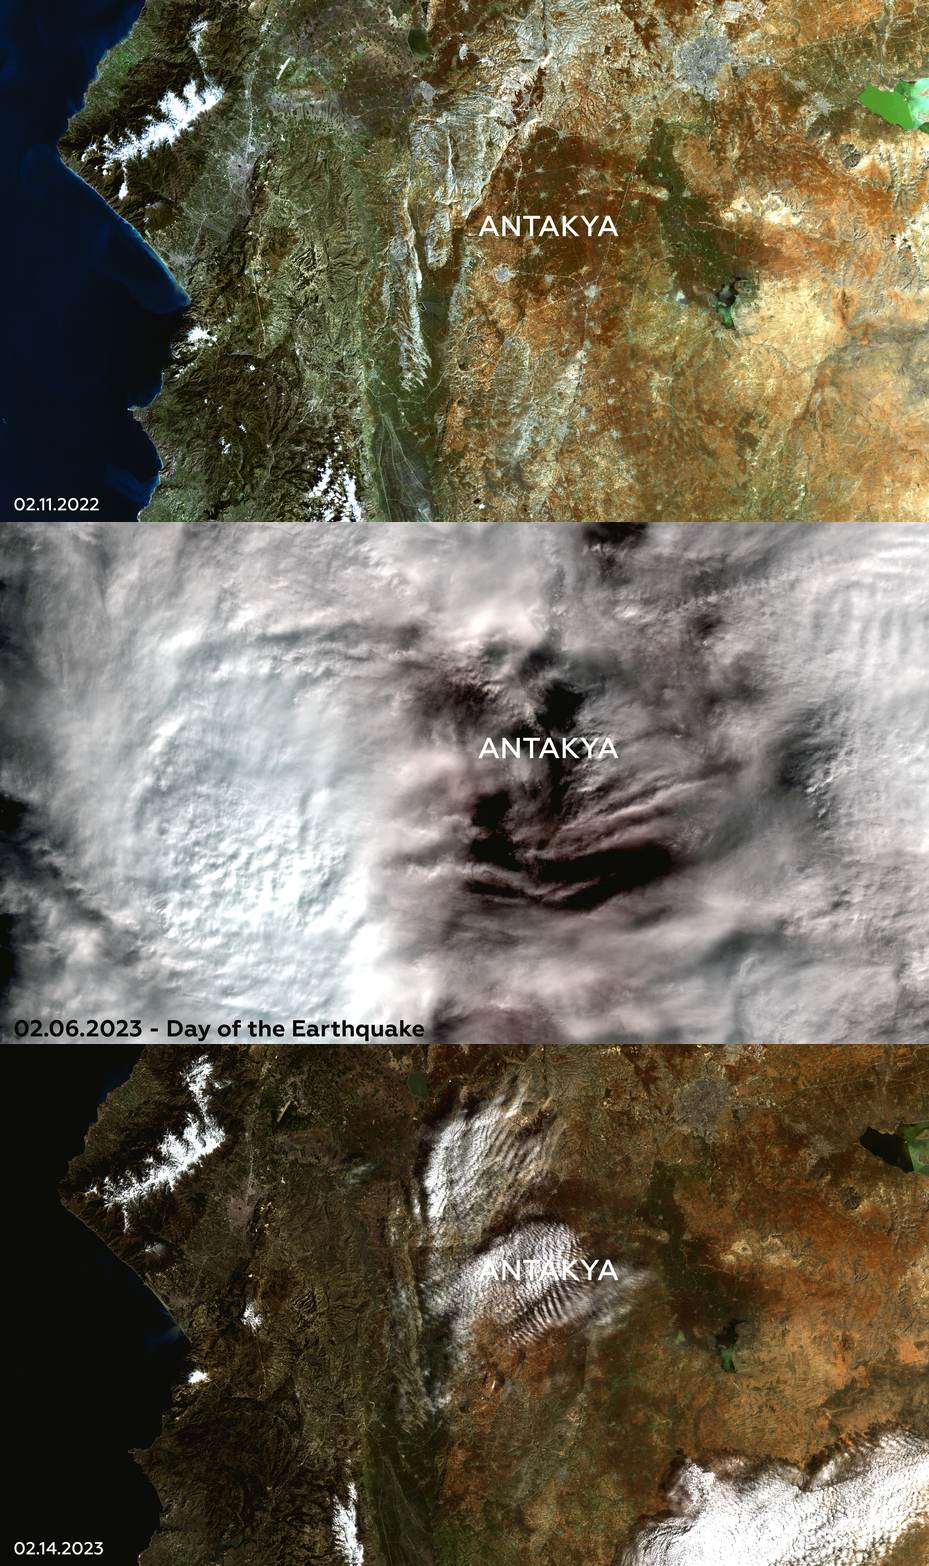
Gif made by Heer Shah, Reya Singhi
On February 6, 2023, a severe earthquake with a Richter scale reading of 7.7 devastated Turkey and Syria, killing more than 50,000 people and displacing millions across more than a dozen cities. According to the World Bank, the damage is estimated to be worth $34 billion.
The number of fatalities and property losses from this earthquake has eclipsed all previous records, exposing the cause of this immense catastrophe - HOUSING.
Figure 1: Deadliest earthquakes in the world
Maps made by Heer Shah, Reya Singhi
Since 2005, several places worldwide (Figure 1) have experienced similar events to Bhuj and Turkey, with a common factor being the construction of soft storey structures. Despite the known risk associated with such buildings, they continue to be built, and little action has been taken to address the conditions of such existing structures. The majority of these structures can be attributed to corrupt practices, with the primary motivation being the pursuit of rapid financial gain. The devastating earthquakes in Gujarat in 2001 and Turkey and Syria in 2023 have highlighted the destructive power of poorly constructed housing, which has resulted in numerous fatalities and extensive property damage. It’s important to note that most of the highly collapsible buildings have been in areas that consist of economically and socially vulnerable communities.
What is a Soft Story Structure?
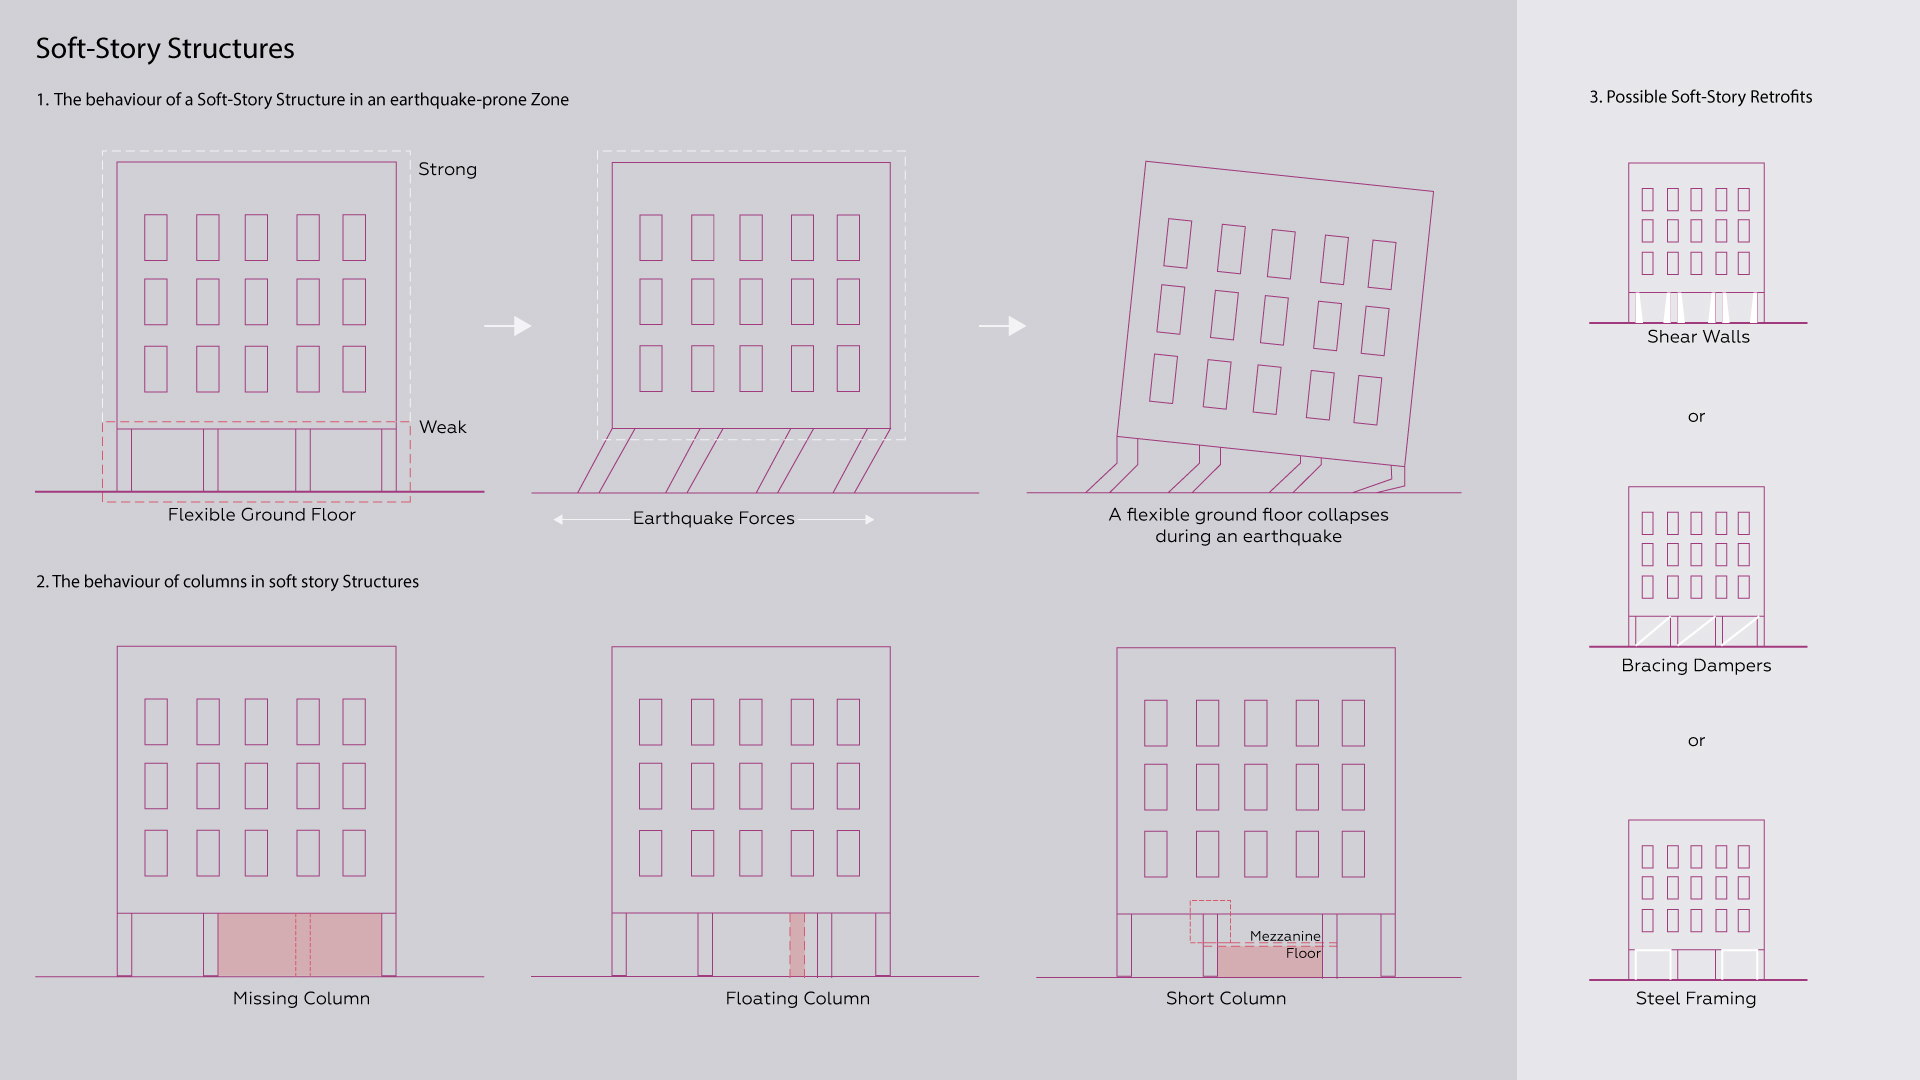
Figure 2: Understanding Soft Story Structure
Diagram made by Heer Shah, Reya Singhi
Soft story constructions, so named because the first floor is substantially less stiff than the stories above, are vulnerable to damage in earthquake-prone zones due to massive unreinforced apertures. These areas are typically used for parking or other commercial reasons. Such constructions are far less able to withstand the lateral forces (forces that push a structure side to side) generated by earthquakes if they are not adequately designed. When the first floor collapses, the upper floors collapse on top of it, crushing anything beneath, commonly known as the pancake construction.
Despite what we know about the behavior of soft story structures in earthquake zones, why do we keep building them? Why are housing policy based on short-term commercial objectives rather than long-term social and environmental concerns?
AHMEDABAD, GUJARAT
Figure 3: LANDSAT Images of cities affected by the Bhuj Earthquake
Video made by Heer Shah, Reya Singhi
On January 26, 2001, an earthquake in Gujarat, India’s Kachchh district, massacred over 35,000 people and significantly damaged the state’s housing stock. More than 1 million houses either needed extensive repairs or were destroyed.
Understanding Geographies
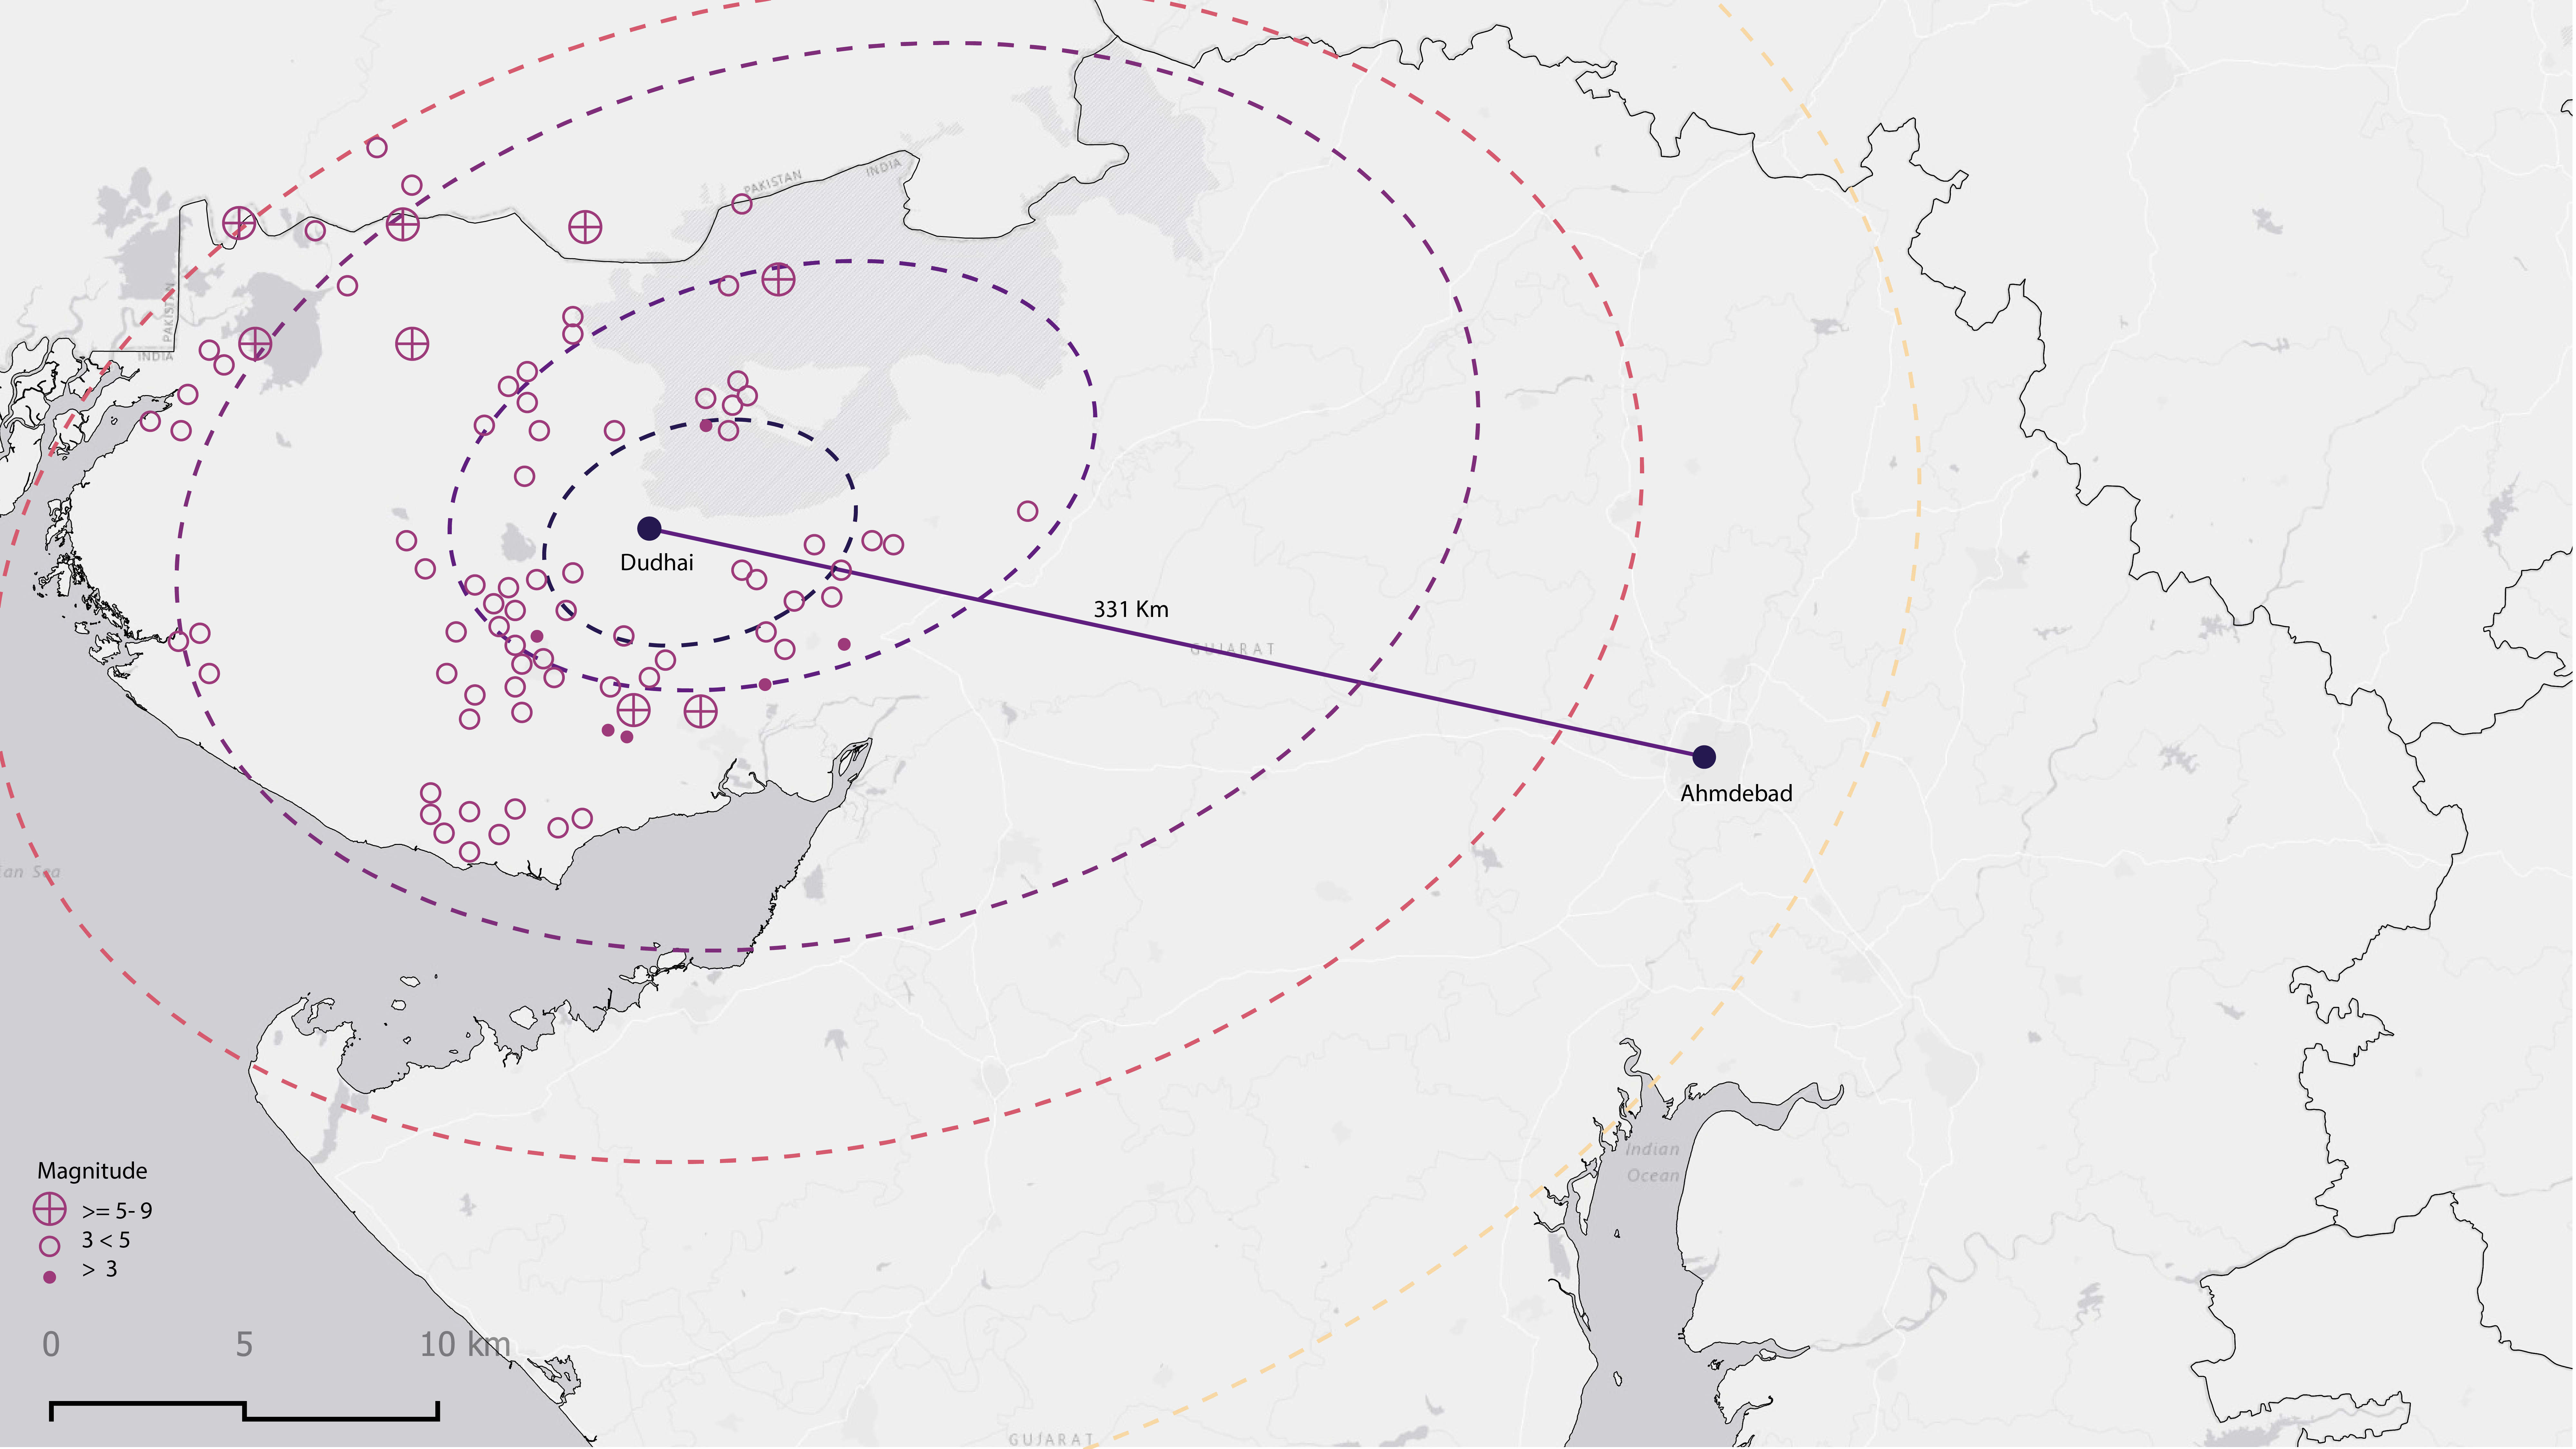
Figure 4: Bhuj Earthquake, 2001
Map made by Heer Shah, Reya Singhi
According to the Bureau of Indian Standards, India has five seismic zones, with Zone V being the most severe. The seismically active Kachchh region, on the western end of the Indian subcontinent, accounts for around 22% of Gujarat State’s (45,930 km2) total land area, is in Zone V, and suffered the most substantial damage. Among the Kachchh towns and cities that suffered severe damage were Bhuj, Bhachau, Rapar, Anjar, and Gandhidham even though the IS 4326: 1993 “Earthquake Resistant Design and Construction of Structures -Code of Practice” outlines a comprehensive list of standards and laws that control the earthquake-resistant design of buildings in India. It’s important to note that these codes are just recommendations, not prerequisites. Several other areas of the state were also severely damaged by the earthquake, most notably Ahmedabad, a large urban Centre in Gujarat that was in seismic Zone III and about 300 kilometers to the east of Bhuj.
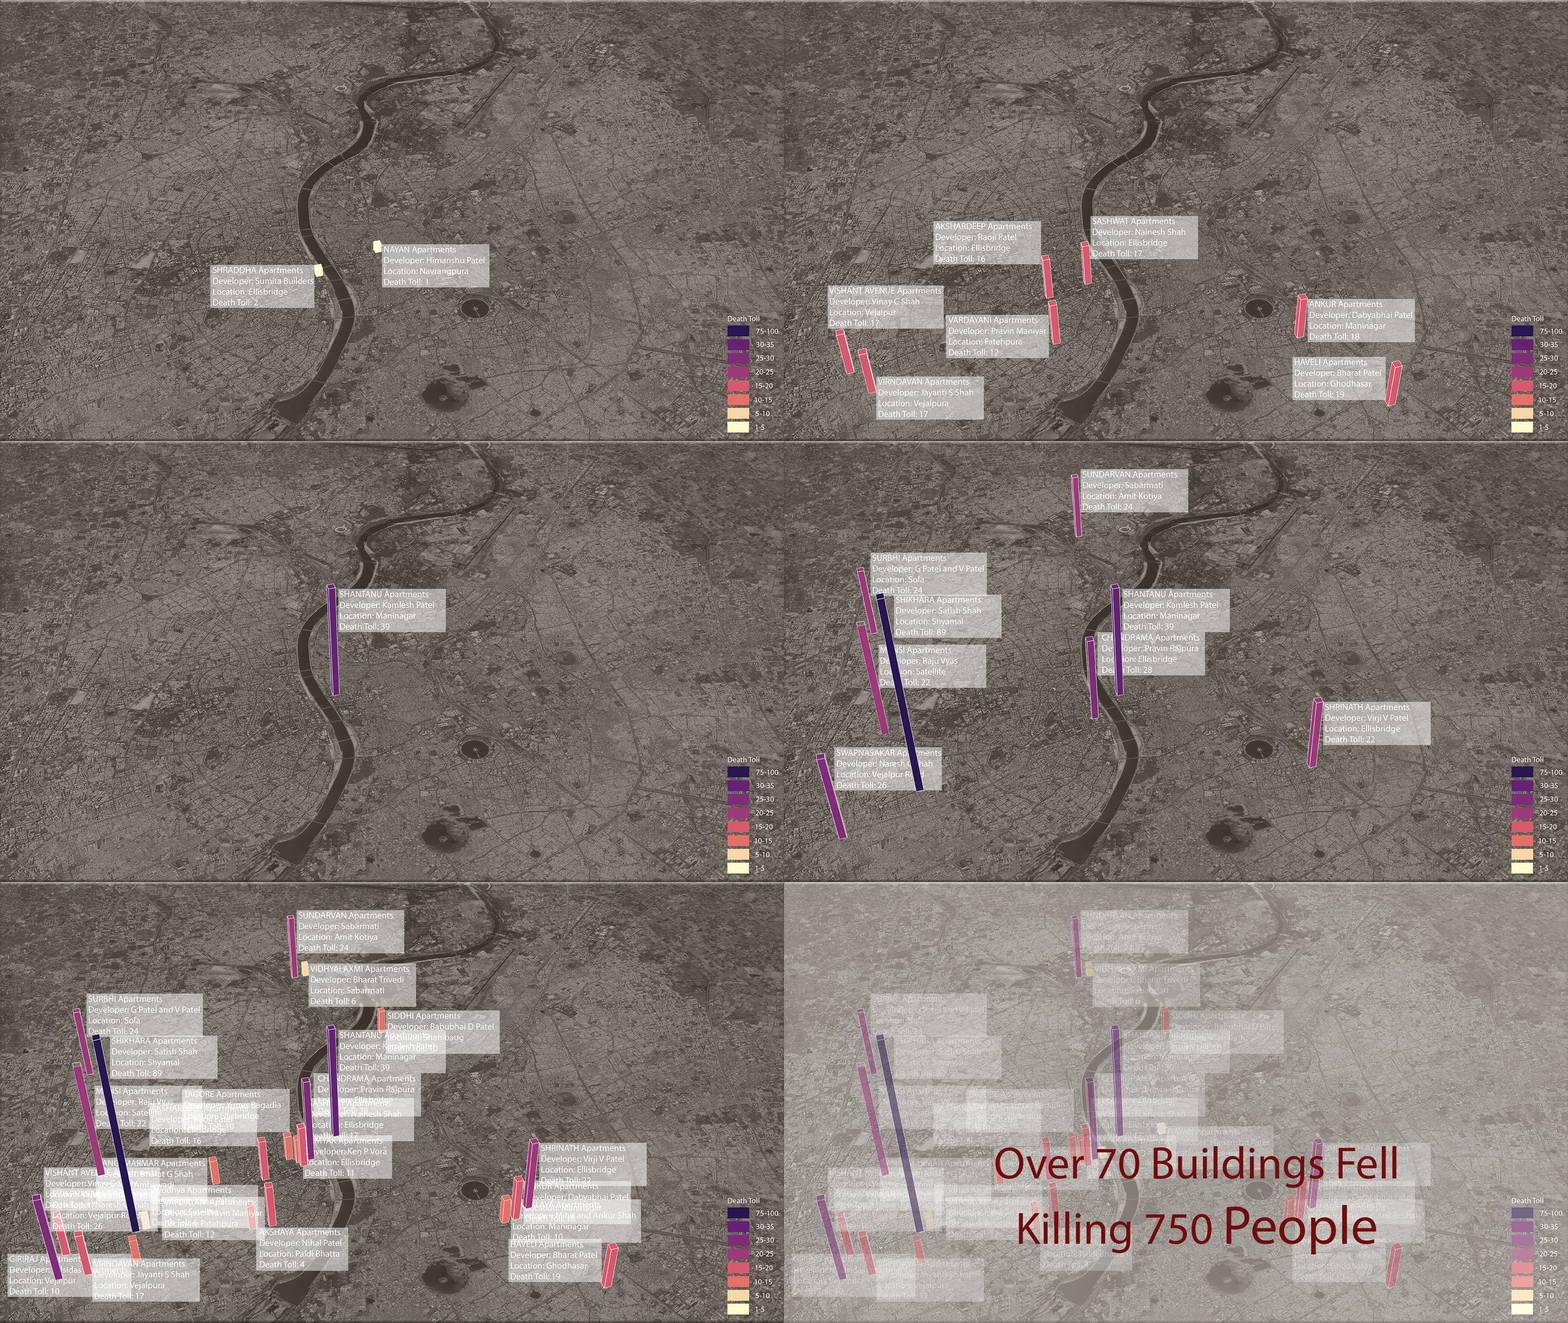
Figure 5: Buildings affected by the Earthquake in Ahmedabad
Map made by Heer Shah, Reya Singhi
The strength of ground motion would not be anticipated to be strong at such a distance, but despite this, 70 multistory residential buildings collapsed, killing 750 people with heights that ranged from the ground plus four to ground plus ten levels. One thing all seventy buildings had in common was that they were all reinforced concrete-framed buildings with an open first story, inadequate column-beam junction detailing, and average construction quality.
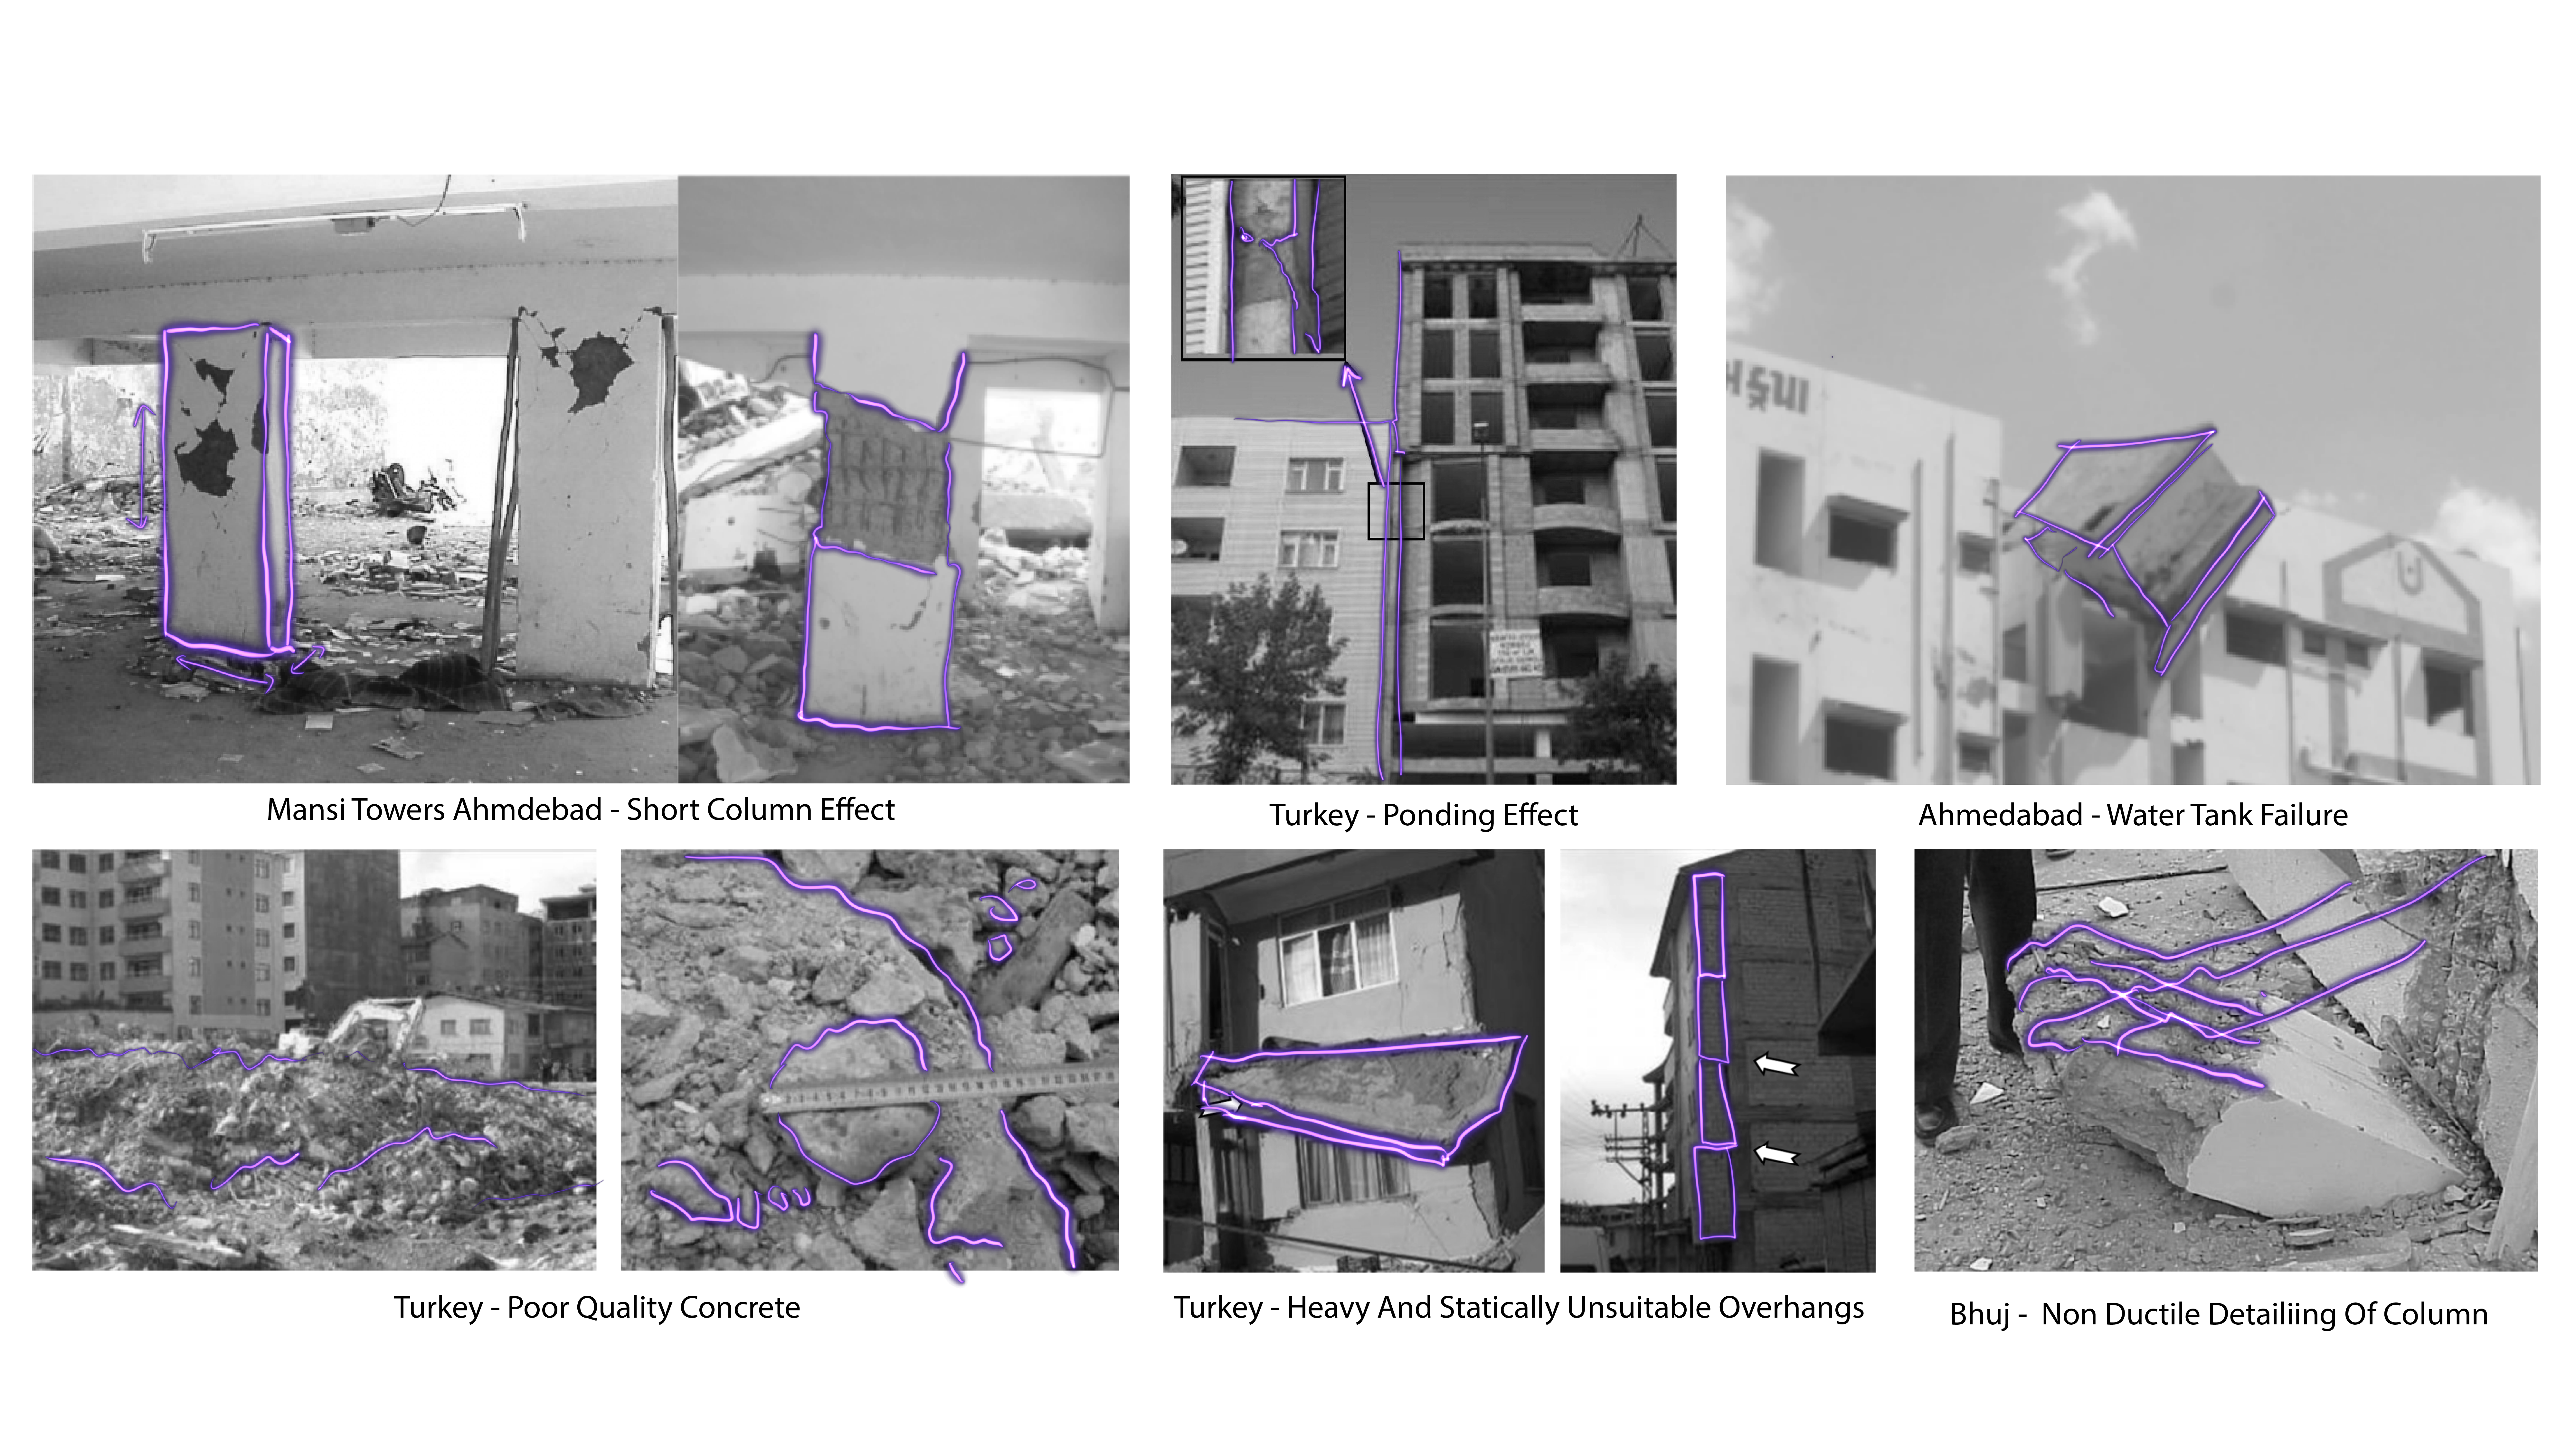
Figure 6: Aftermath of the Bhuj earthquake
Photo Illustration made by Heer Shah, Reya Singhi
After the earthquake, all soft-story structures in Ahmedabad suffered significant damage. Further investigation and the findings of an inspection of two such towers, Mansi and Shikhara Towers, reveal major flaws that occurred as a result of a violation or ignorance of interim codes.
The following consequences, alone or in combination, were the causes of the failure:
1. Flexible ground floor (Soft-story)
2. Short column effect
3. Lack of proper detailing
4. Poor workmanship
5. Ponding effect
6. Appendage effects
Case Study: Mansi Towers
A four-block residential complex, one of which collapsed completely. According to observations of the remaining parts of this building, the soft first story was the cause of the collapse. Because such structures are typically constructed on small lots that do not permit open parking, almost all multistory residential buildings in Indian cities have an open ground floor designated for parking. As a result, no ground-level wall infills are present, resulting in a stiffness discontinuity or a soft story. The masonry infills in the upper stories, on the other hand, stiffened the structure, attracting significantly higher earthquake forces. Furthermore, with proper permissions, a swimming pool was built on its terrace, resulting in an asymmetrical distribution of loads and heavy mass concentration at the top of the structure.
The first-story columns of the other three blocks also suffered severe damage, which eventually forced the demolition of the structures and resulted in the displacement of hundreds of people.
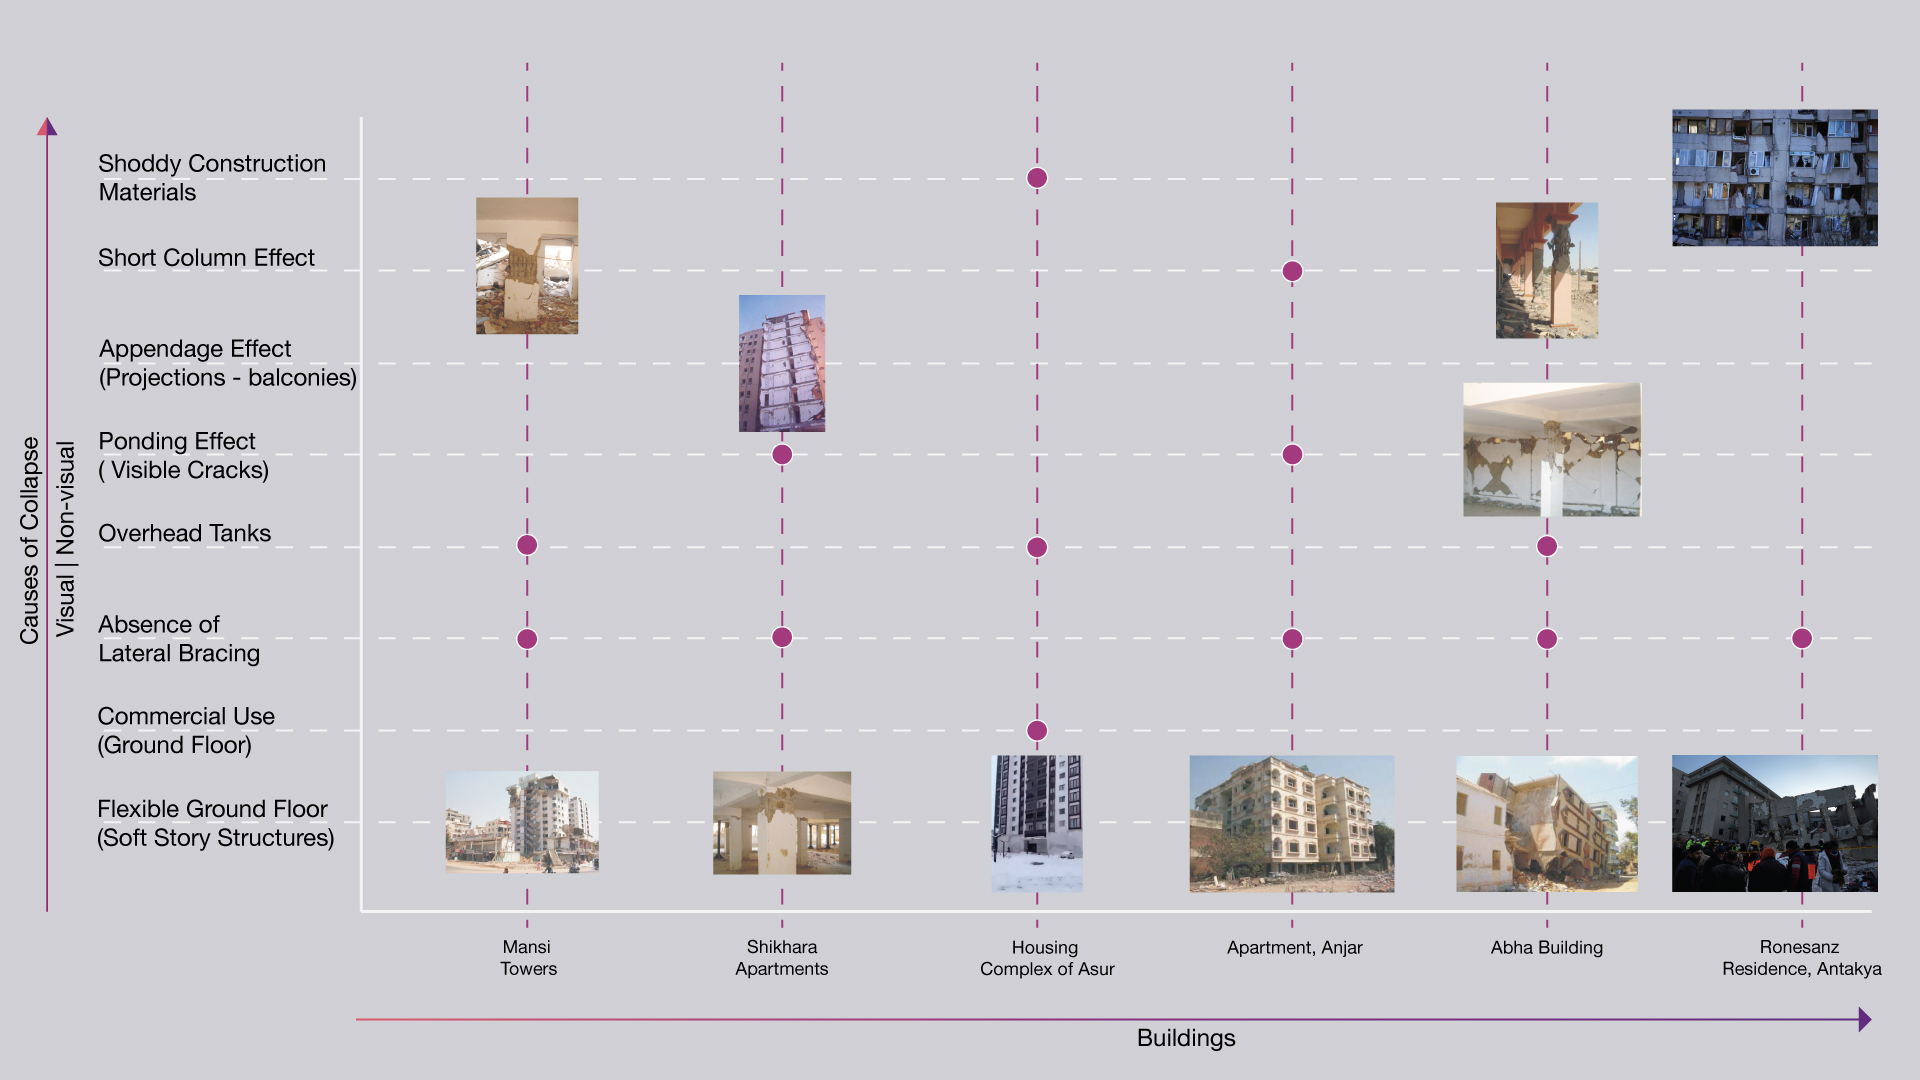
Figure 7:Visual Directory
Photo Illustration made by Heer Shah, Reya Singhi
A visual directory is made using the lessons learned from Ahmedabad. Identification of likely visual reasons for the collapse is aided by using the visual toolkit as a reference. While evaluating a building solely on the basis of visual impressions is challenging, it brings the process of identifying a structure that might collapse during an earthquake one step closer. For instance, doing an engineering survey becomes essential if a building exhibits nearly all of the visual flaws listed in the directory.
THE IMPENDING EARTHQUAKE, PUNE
Following the Turkey-Syria earthquake, seismologists forecast severe earthquakes in numerous cities within earthquake zones worldwide. Istanbul, Pune, and Dhaka were just a few of the international cities mapped as part of an investigation for a New York Times article . Each city with a million or more residents and a sizable portion of substandard housing, typically in minority neighborhoods, predicts a death toll that, given their population density, could surpass the disaster earlier this year.
We delved deeper into research for Pune, India, to better comprehend the statement “Where shoddy construction could mean death,” coined in the article.
Understanding Geographies
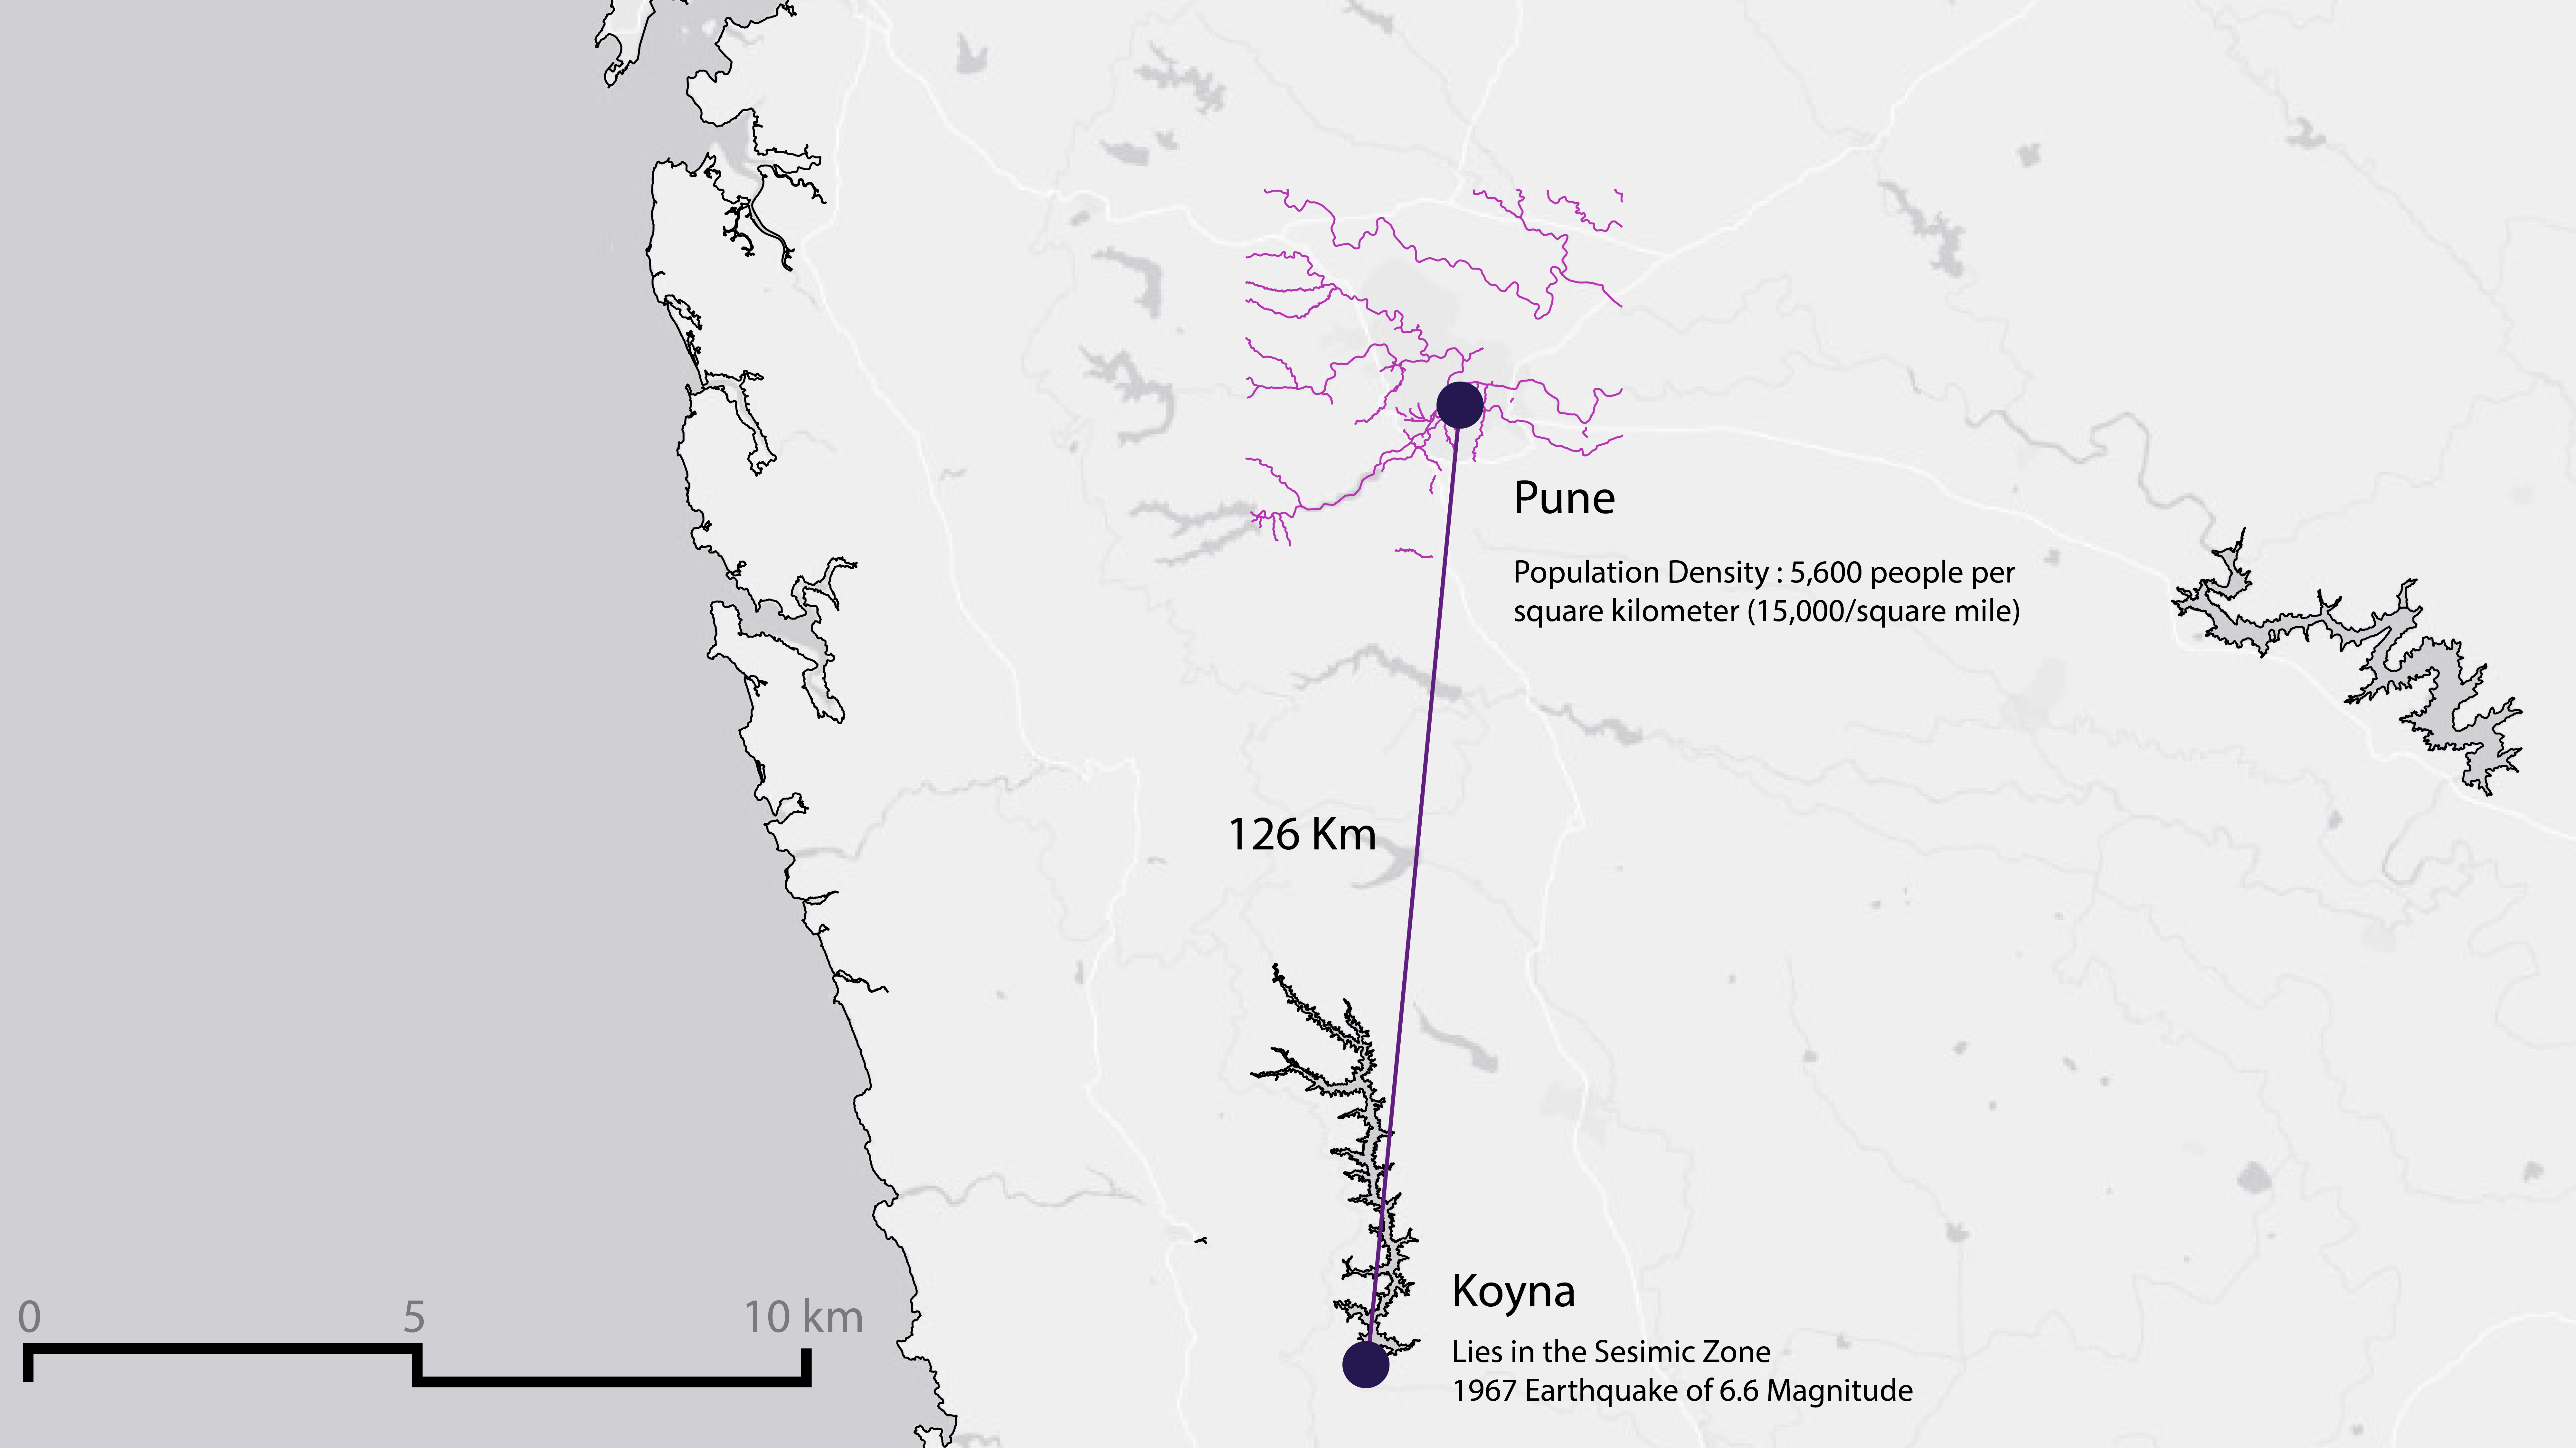
Figure 8:Distance between Pune and Koyna
Photo Illustration made by Heer Shah, Reya Singhi
According to the Bureau of Indian Standards, Pune is in seismic zone III, about 24 miles from Koyna, which is in seismic zone V. At such a distance, the strength of ground motion would not be expected to be strong. However, as seen in the case of Ahmedabad, moderate shaking of soft story structures can have severe negative consequences.
Pune, the second-largest city in Maharashtra after Mumbai and the state’s cultural center, is a sprawling city in western India. The town has many educational institutions, earning it the title of “The Oxford of the East.” Pune’s proximity to Mumbai and the urbanization of the surrounding area, which has transformed Pune into a satellite town for Mumbai, are further factors that have fueled the city’s economic boom. The government has been working on significant infrastructure projects to shorten the distance between the two cities for the past few years. After Infosys was established in 1981, Pune also experienced a boom in the IT sector. In 2017–2018, Pune was ranked third for software development with the highest IT growth rate, behind Bangalore and Hyderabad.
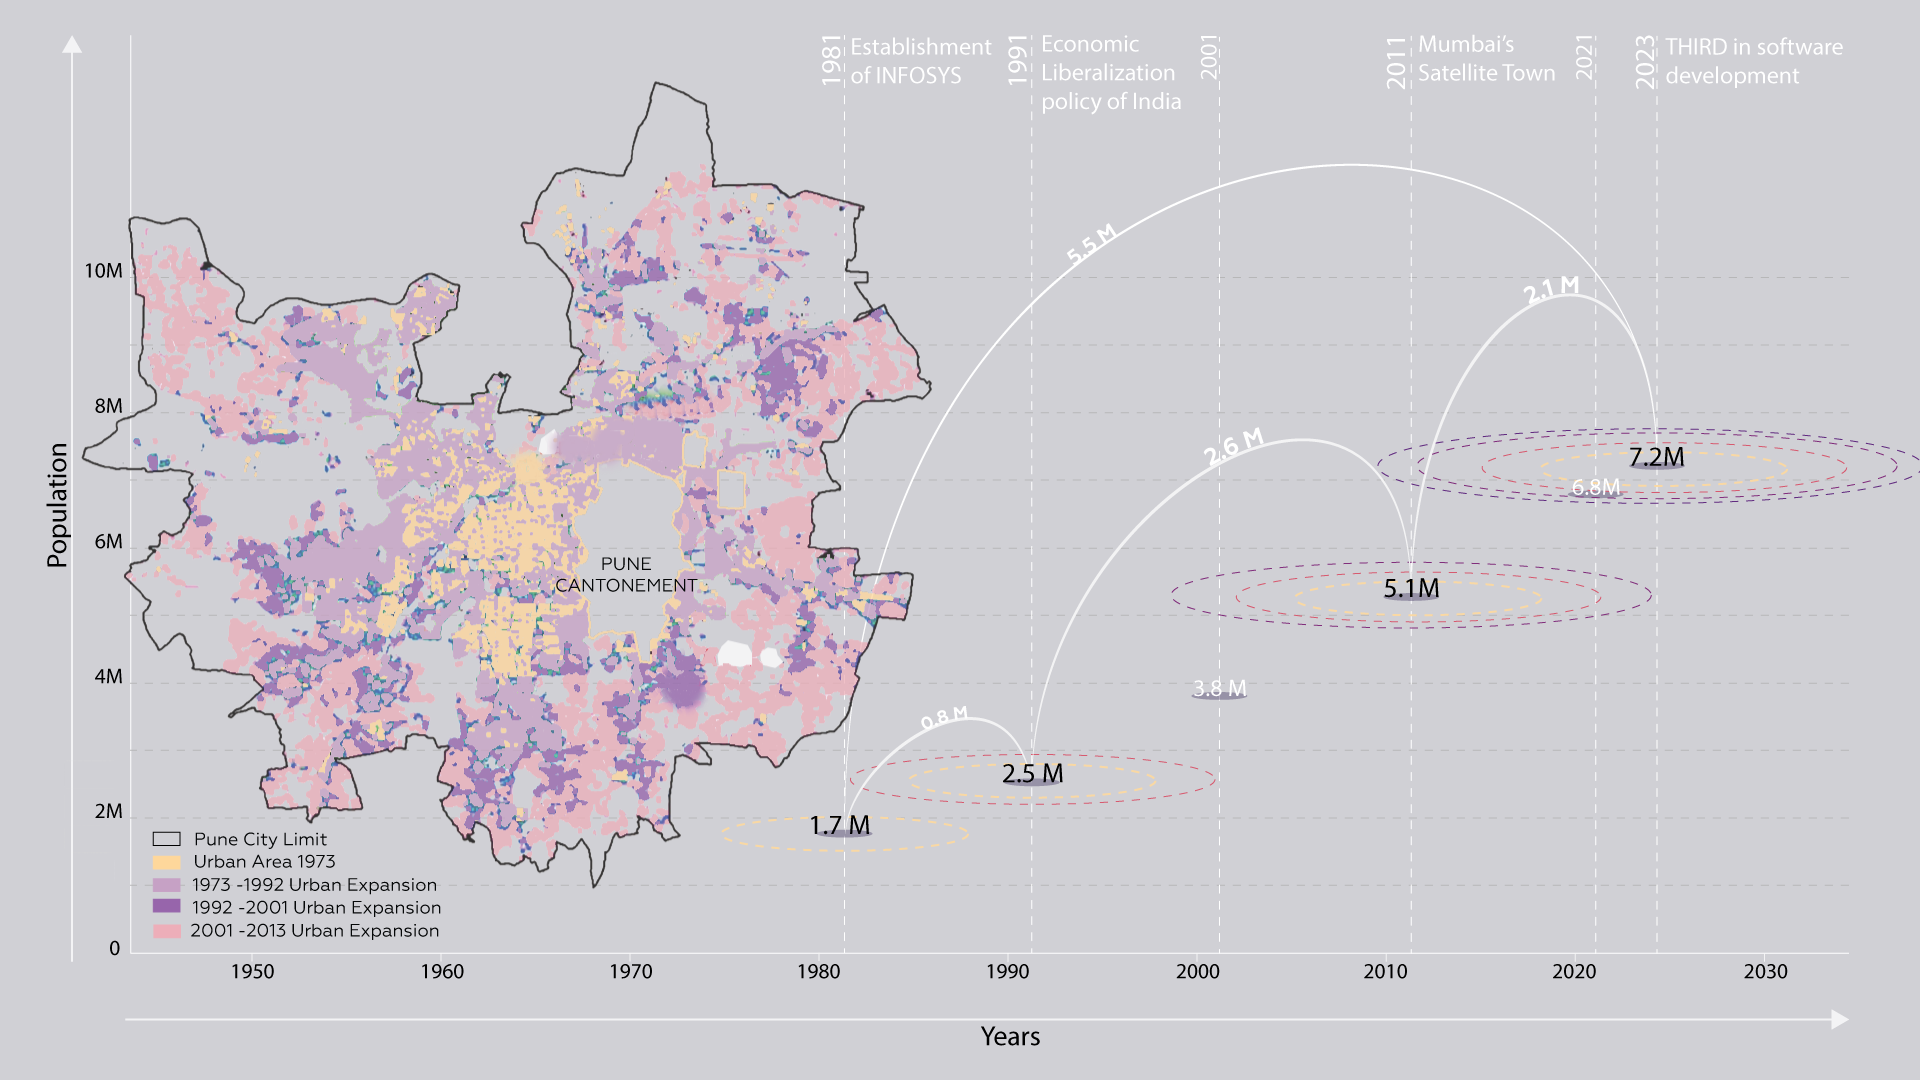
Figure 9:Population Growth, Pune
Illustration made by Heer Shah, Reya Singhi
As a result, Pune has considerably urbanized over the past three decades. Economic and population growth occurred over time and are strongly intertwined. Most housing stock built between the 1980s and the early 2000s was part of the urban boom. Unaccountable private developers built many buildings with inferior materials and low structural integrity. With the population growth, the city expanded and more recent developments were made as townships along the city periphery. While constructing more housing is the need of the hour, it is just as essential to safeguard already-built structures as it is to construct more.
Area of Focus: Kothrud
To better understand the inter-city dynamics of the urban expansion and housing typology, we analyzed a neighborhood in Pune - Kothrud. One of the oldest districts, it underwent significant urbanization between 1981 - 1991 when buildings with ground plus three or four floors were built around an industrial unit. Housing in the neighborhood was built with the working class in mind, primarily for industrial workers. While Pune’s settlement has historically been segregated by caste and income, these buildings had small lots with a flexible ground floor frequently used for parking. They lack infill walls and bracing, making them vulnerable to failure in an earthquake.
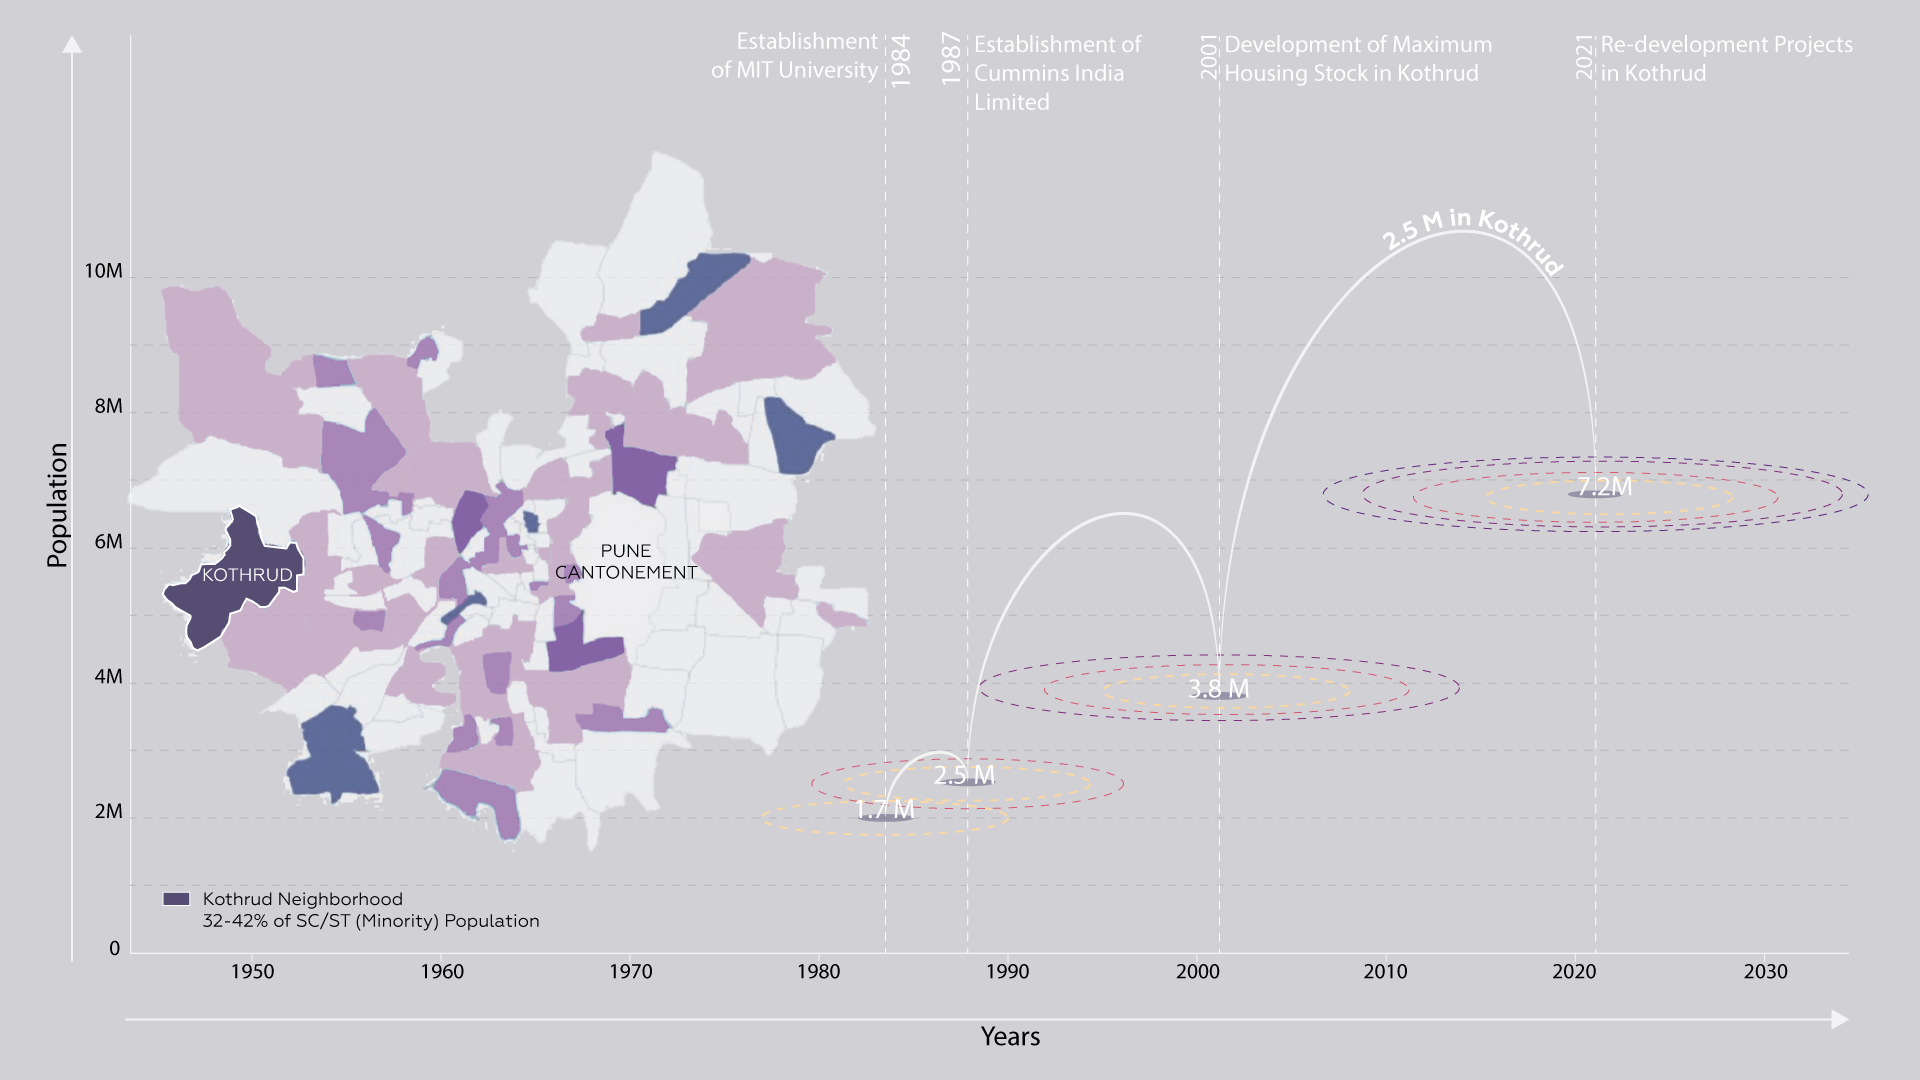
Figure 10:Kothrud location
Illustration made by Heer Shah, Reya Singhi
Our initial research focuses on identifying some of the buildings through images and ground level usage.
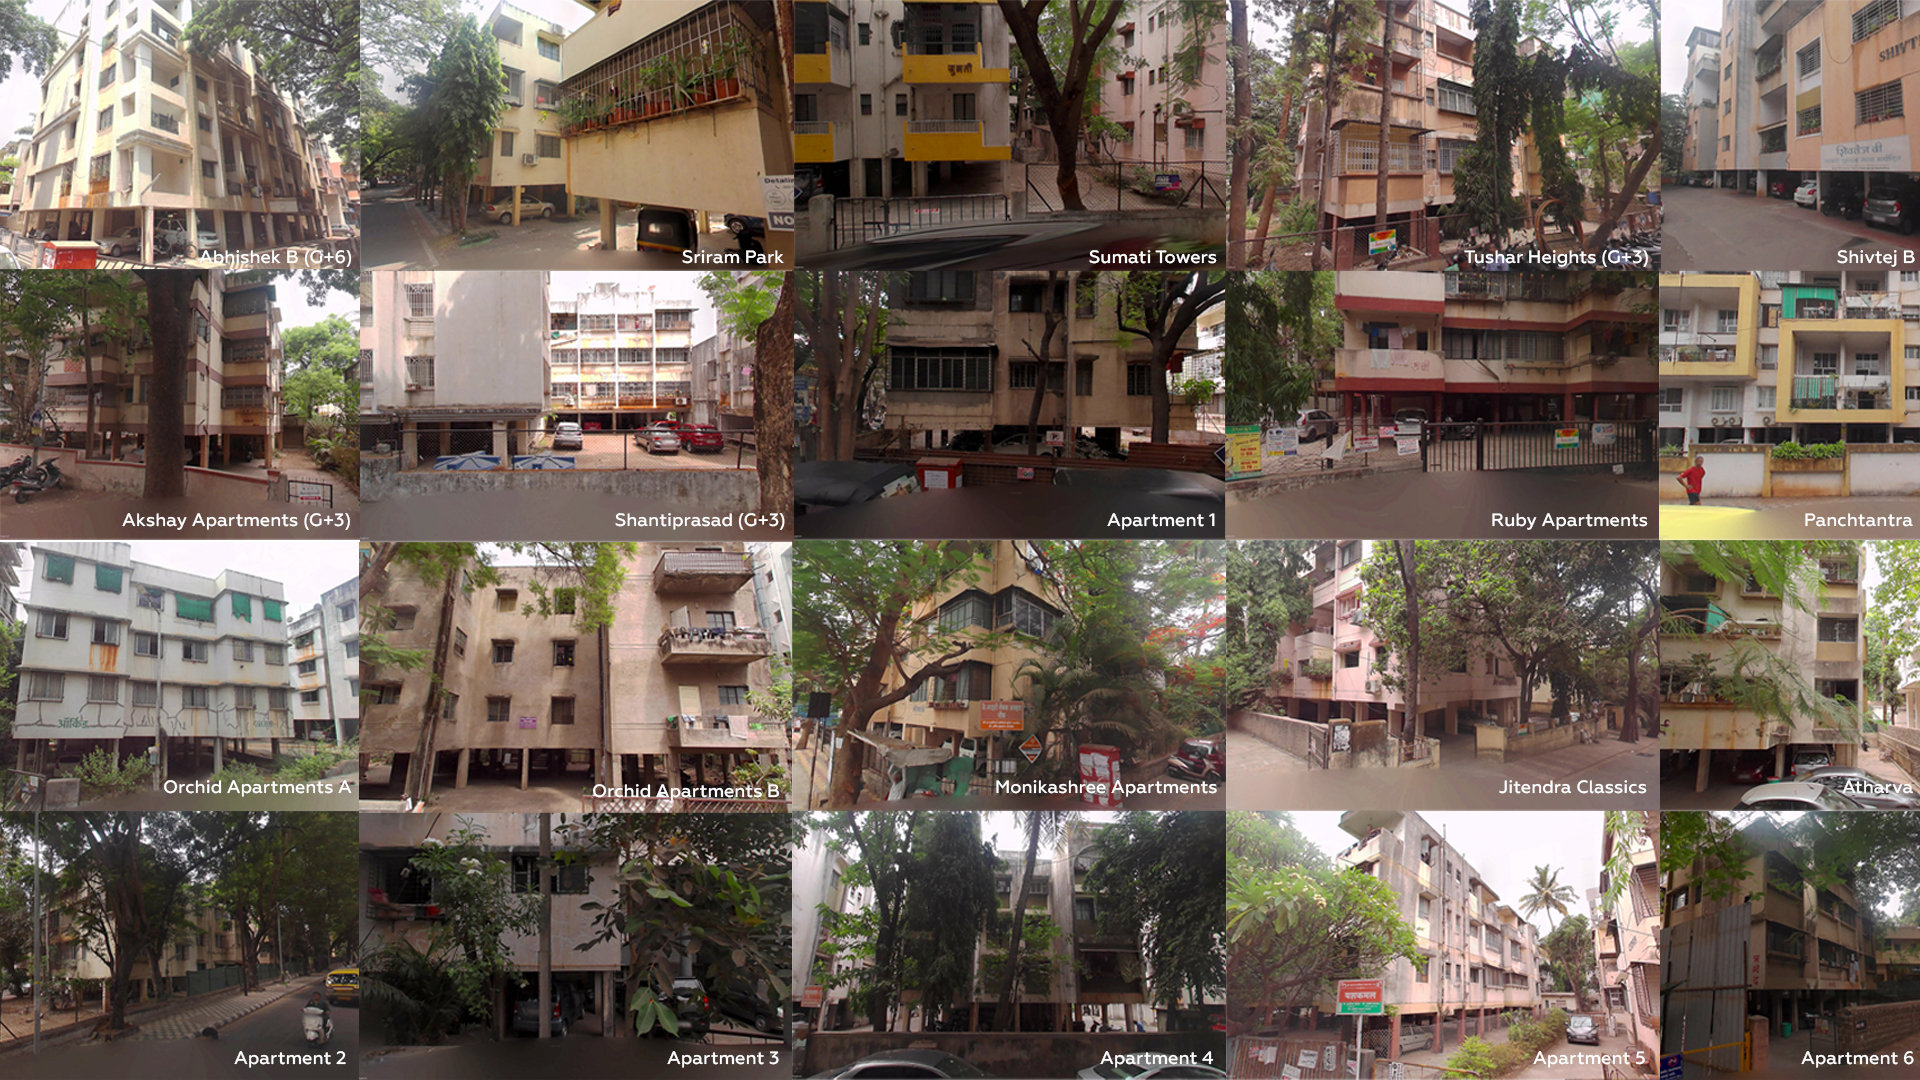
Figure 11:Potential Buildings at Risk in Kothrud
Illustration made by Heer Shah, Reya Singhi
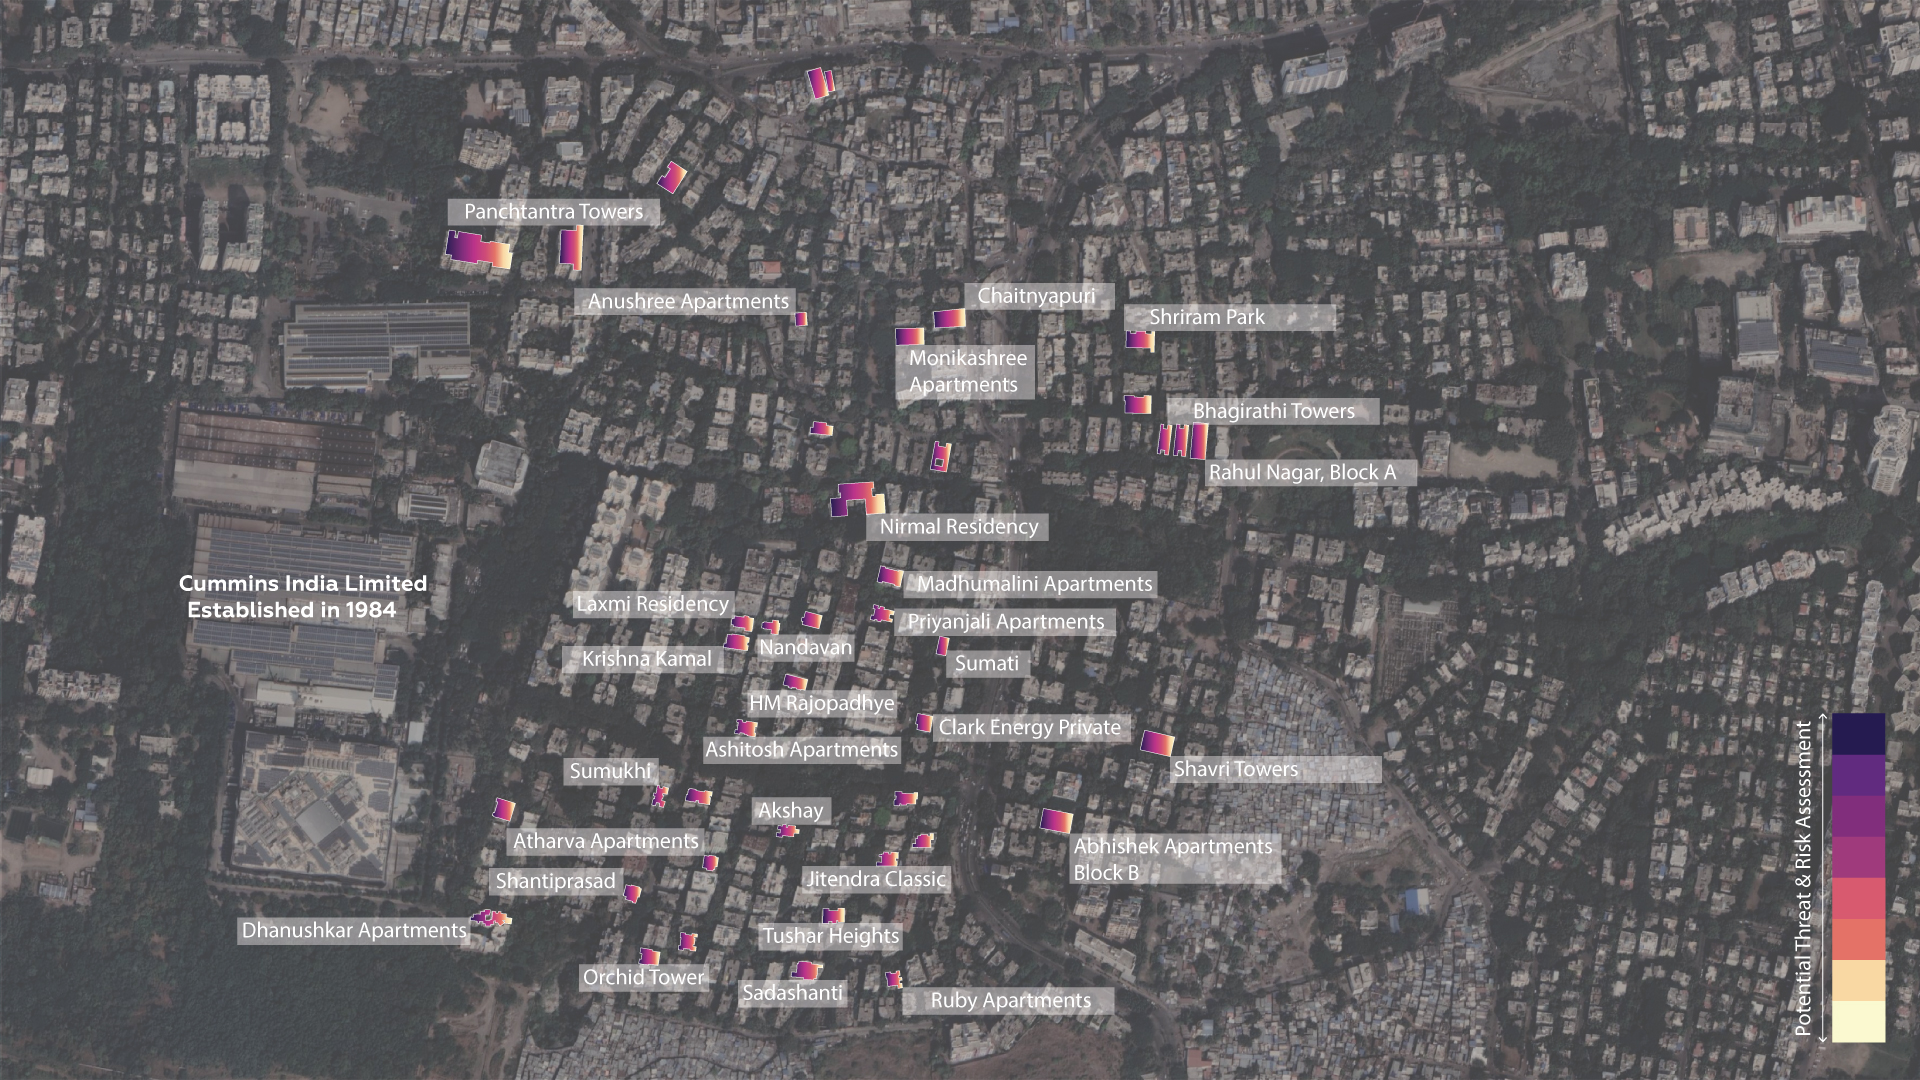
Figure 12:Mapping Potential Buildings at Risk in Kothrud
Map made by Heer Shah, Reya Singhi
AIM OF THE ANALYSIS
While the initial focus of our research was on gathering information and understanding the housing situation in the neighborhood, we believe that, beyond economic segregation, power is concentrated in the hands of a small number of people and that this is a problem that needs to be addressed. Through the pilot project in Pune, we seek to empower the residents of Kothrud by reducing the effects of the earthquake and raising awareness of the current state of housing.
Call for Action
Our call to action is based on a dual approach:
- Working with college students from engineering and design programs to crowdsource data utilizing the Kobo Toolbox. They will accomplish this by responding to a series of inquiries while on the ground, adding an analysis layer to the prior study.
- Depending on the findings, an engineering survey will be carried out with the Kothrud area ward office.
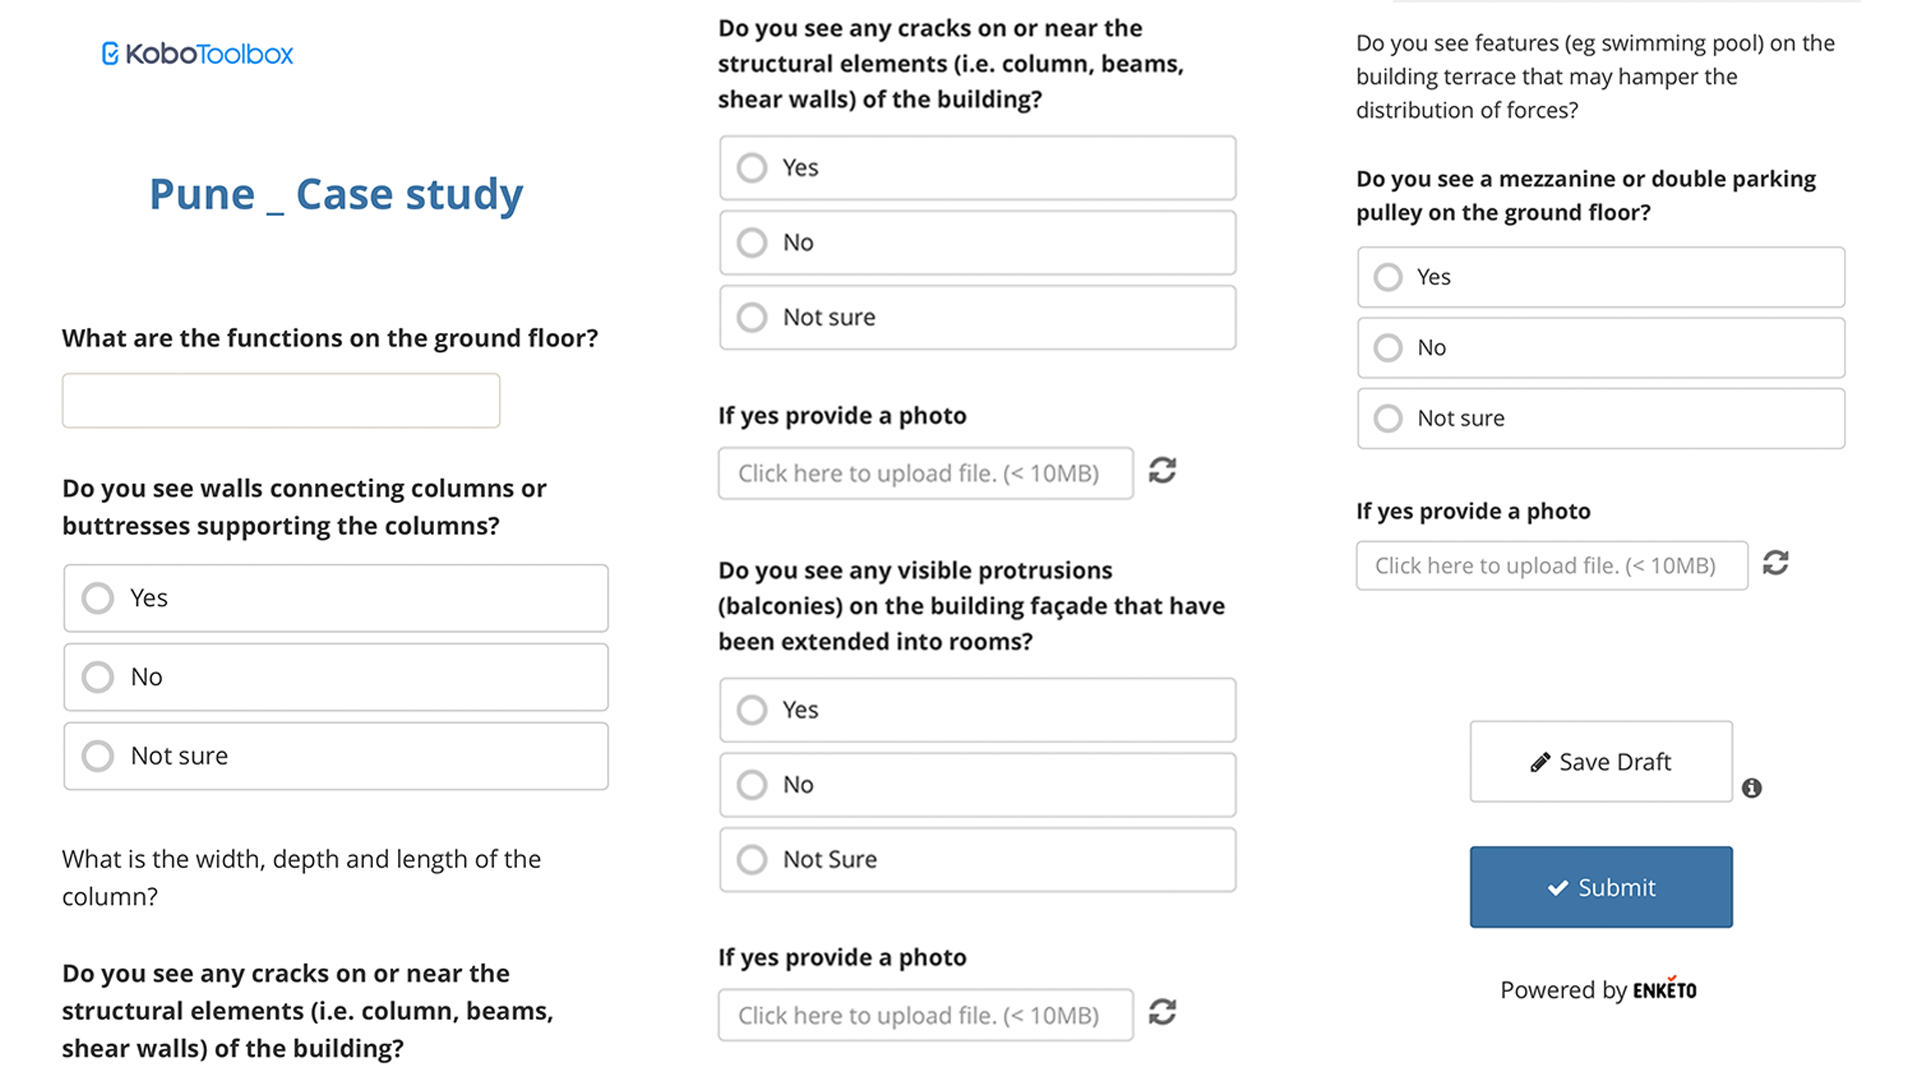
Figure 13:Survey Questions on KOBO Toolbox
Illustration made by Heer Shah, Reya Singhi
The survey is just the beginning of efforts to lessen the effects of an impending earthquake; it is a step forward to help reduce the damage and fatalities when it occurs. The on-ground will empower citizens and motivate city officials to take appropriate action.
Data Sources
- Manifestation of Spatial Inequality in Pune; Aseem Deodhar; Apr 24, 2019;
- Koeri-Bogazici University, Istanbul (Istanbul analysis); Center for International Earth Science Information Network and Center for Hazards and Risk Research, Earth Institute at Columbia University
- What were the world’s deadliest earthquakes?; by Hannah Ritchie; October 05, 2018
- Earthquake Data; US Geological Survey
- Population and Demographics; 2011 Census. Indian Census Bureau
Bibliography
- Jag Mohan Humar, David Lau, and Jean-Robert Pierre; Performance of buildings during the 2001 Bhuj earthquake;
- S. K. Ghosh, Ph.D.Northbrook, Illinois; Observations From the Bhuj Earthquake of January 26, 2001
- ANDREW C. REVKIN; Published: February 24, 2010; Disaster Awaits Cities in Earthquake Zones