Those Who Live and Travel in the Dark


INTRODUCTION
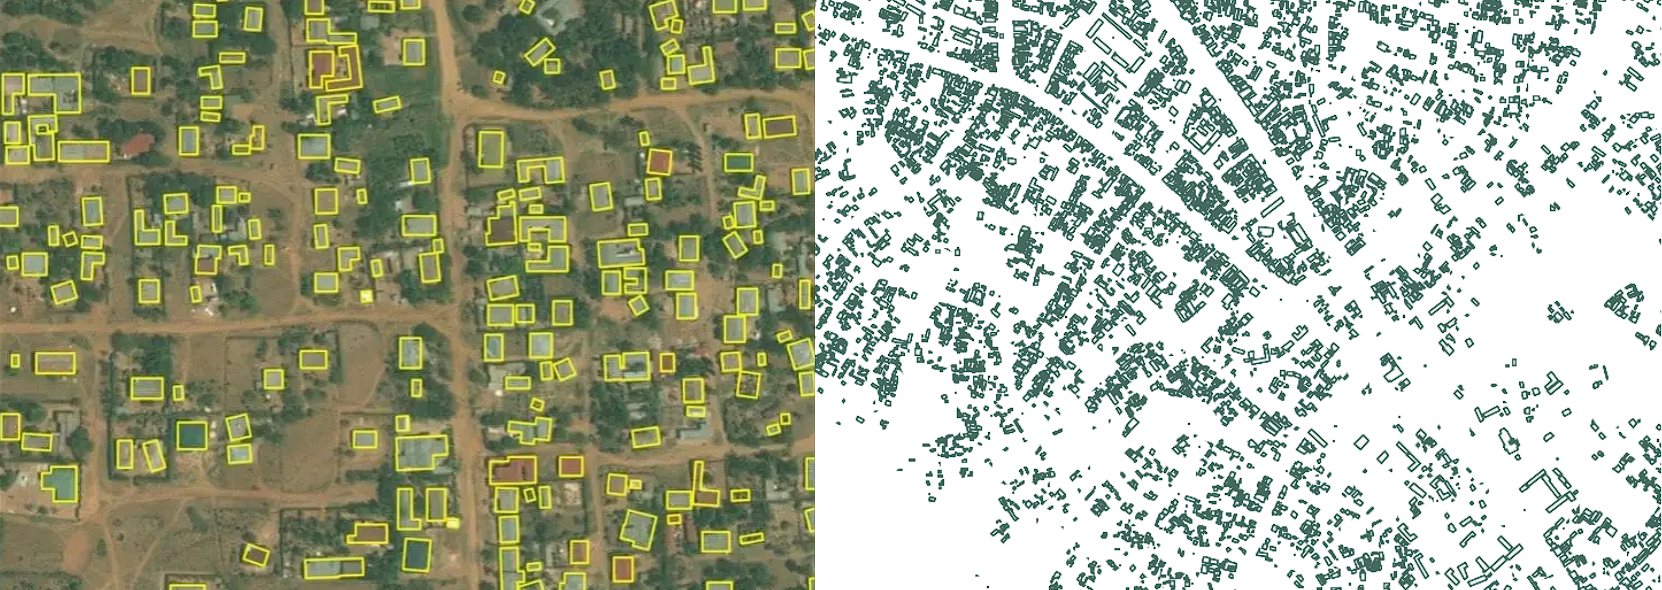
Nighttime satellite imagery has been commonly used to estimate population density and economic activity (Liu et al., 2021; Elvidge et al., 2007; Elvidge et al., 2012; Zhao et al., 2019). However, this approach has limitations, as it may often fail to capture areas that are inhabited but lack adequate infrastructure. In response, the In Plain Sight project, a collaboration between Diller Scofidio + Renfro and the Center for Spatial Research, has pioneered an innovative approach to night light imagery by revealing the gaps in the network and highlighting individual lights and zones where lights are missing.
Building on this novel approach, this project seeks to challenge the conventional use of night light imagery by integrating other sources of datasets to provide a more comprehensive understanding of the lives and infrastructure behind nighttime activities. Specifically, the project aims to compare nighttime light satellite imagery with informal mobility network datasets, census grid counts, and building footprint datasets produced by governments and researchers worldwide. By examining the relationship between the built environment, infrastructure, and human settlement at the scale of satellite imagery, the project aims to challenge existing assumptions about the geographies of belonging and infrastructure exclusion.
This comparative analysis across different datasets will enable the project to identify global patterns and reveal untold stories of places where people live but lack adequate infrastructure at night. The project zoomed in on five case study cities in Africa, examining the intersection of nighttime activity and the built environment to reveal new insights into the spatial and social dimensions of urban life in these contexts. Overall, this project seeks to contribute to a more nuanced and comprehensive understanding of urban infrastructures or the lack thereof and the lives they shape.

Areas of Focus
“African cities are characterized by incessantly flexible, mobile, and provisional intersections of residents that operate without clearly delineated notions of how the city is to be inhabited and used. These intersections, particularly in the last two decades, have depended on the ability of residents to engage complex combinations of objects, spaces, persons, and practices. These conjunctions become an infrastructure — a platform providing for and reproducing life in the city.”
– People as Infrastructure (Simone 2004, 407)
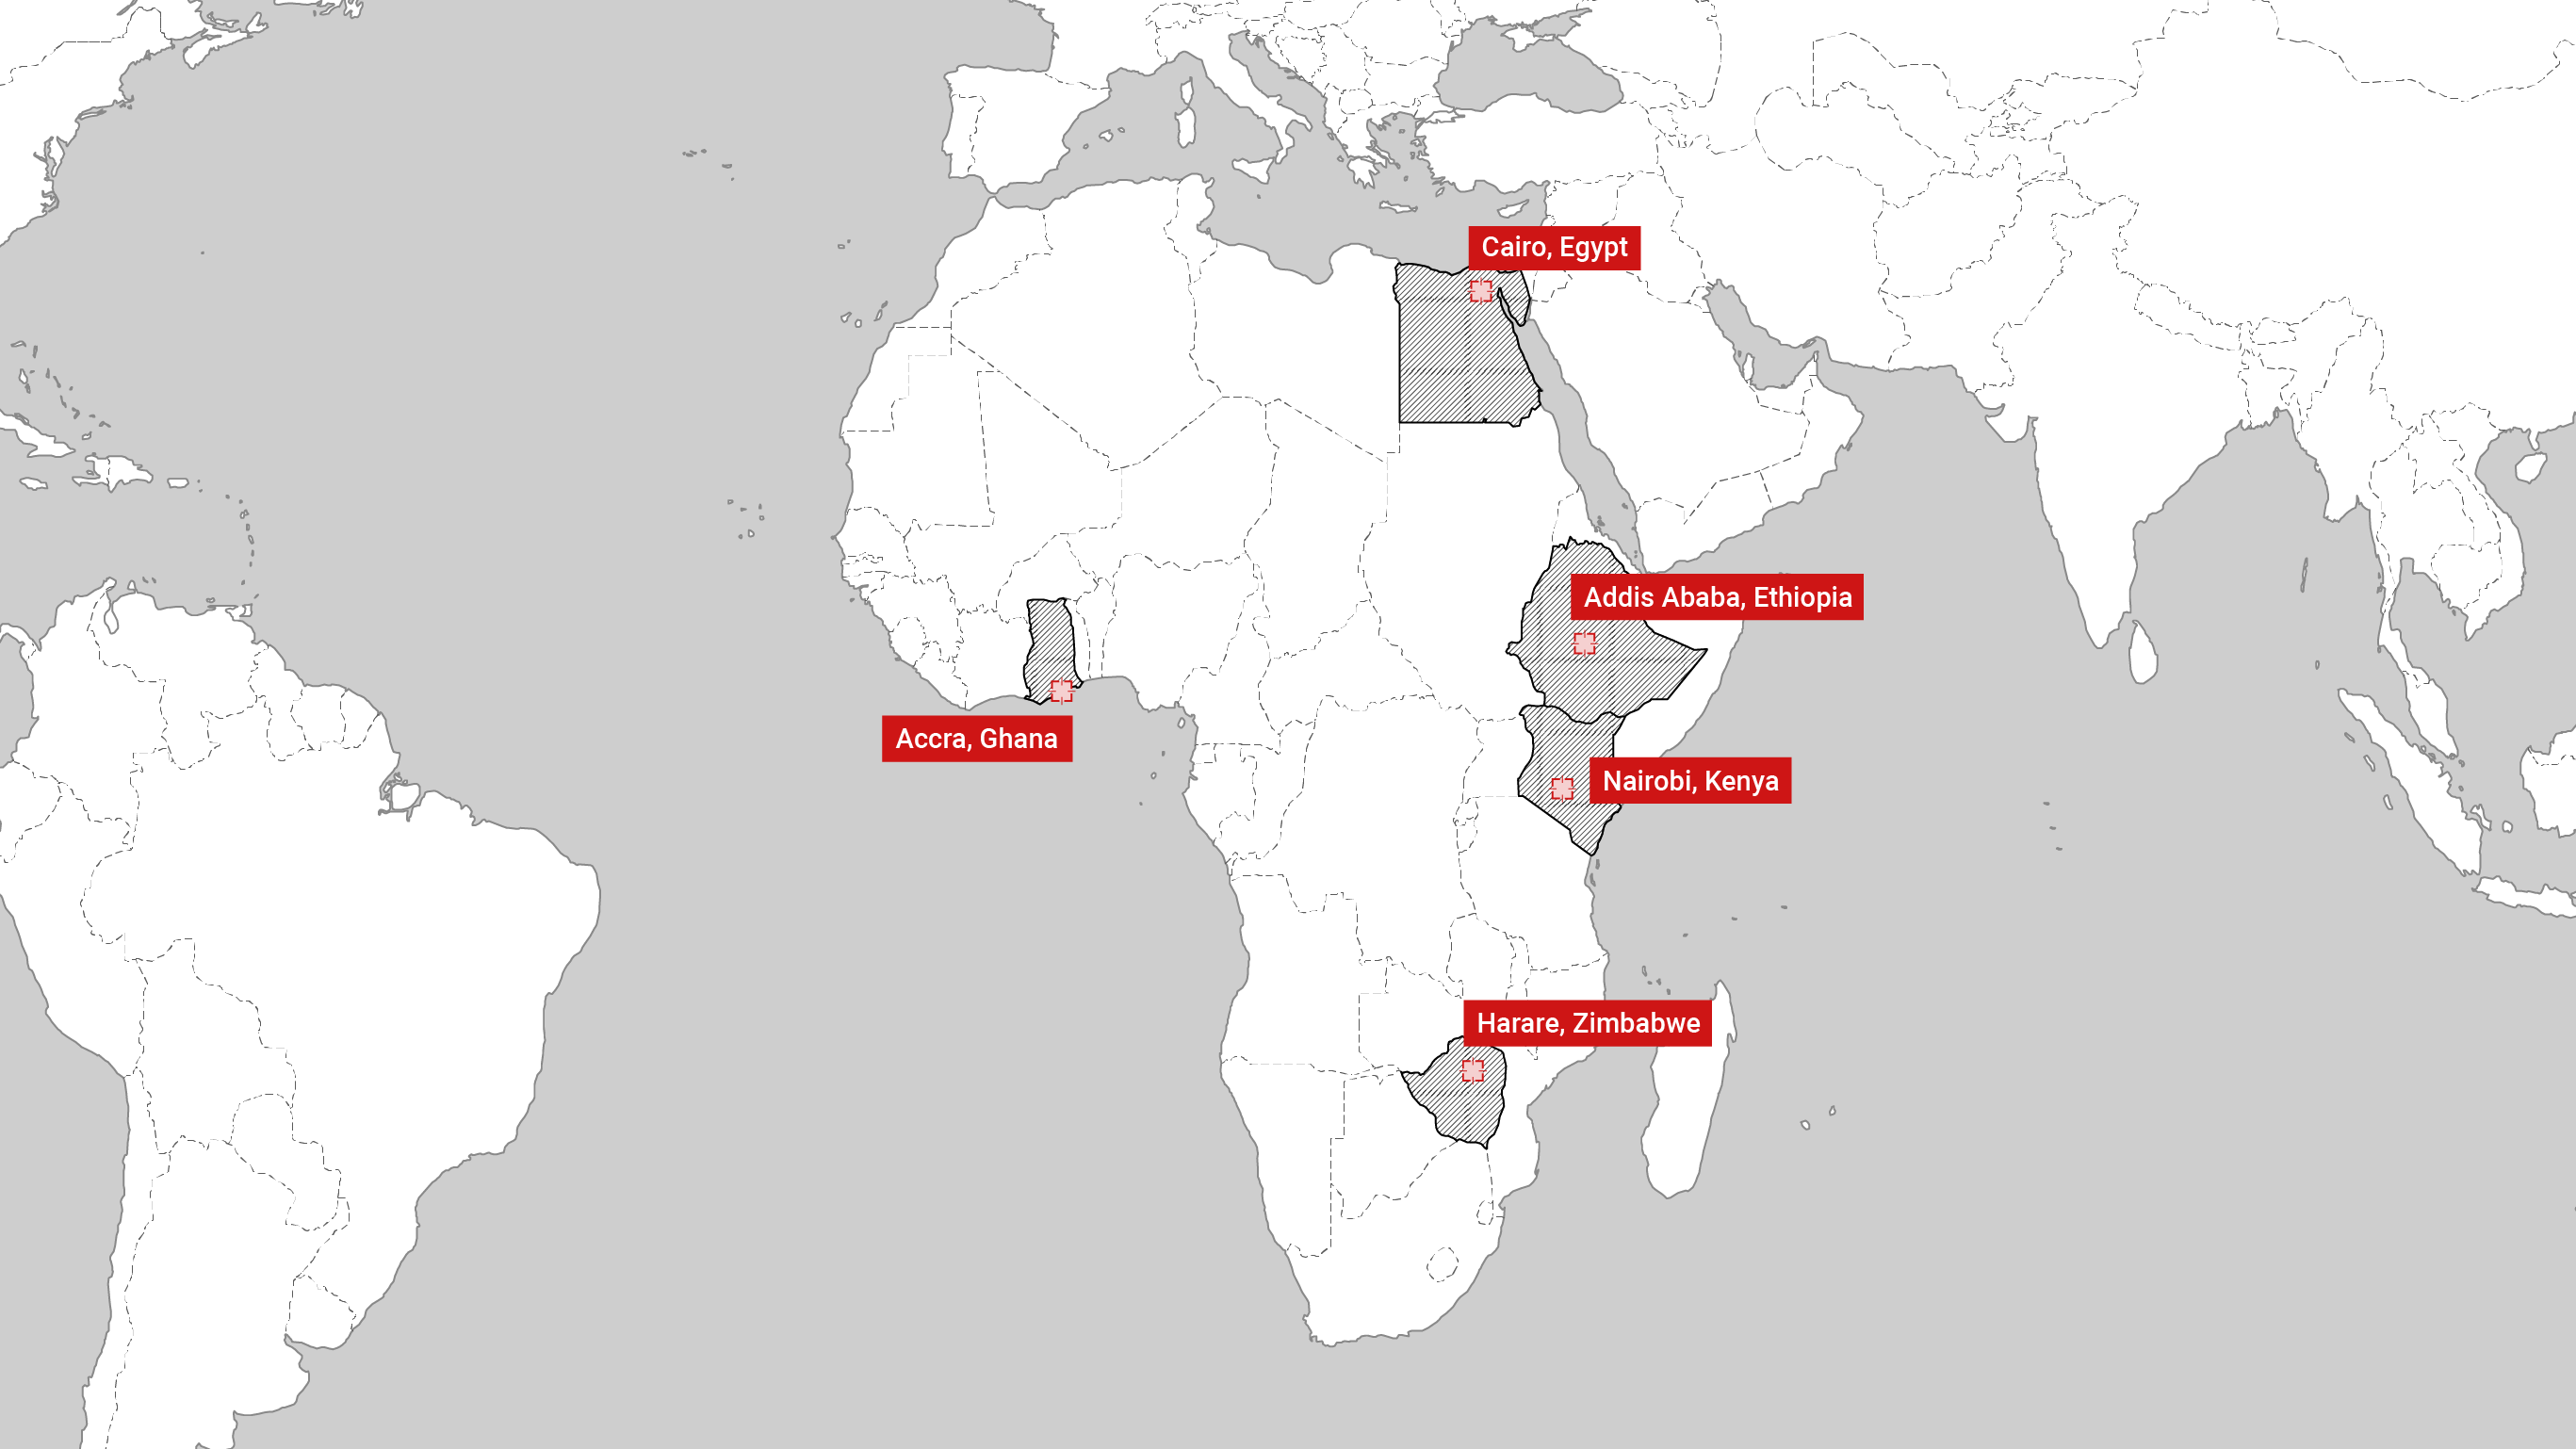
Map made by Alan Ren, Candice Siyun Ji, Kelly Shining Hong, Wei Xiao
The five African case study cities are Accra in Ghana, Addis Ababa in Ethiopia, Cairo in Egypt, Harare in Zimbabwe, and Nairobi in Kenya.

Research Questions
- Are there areas where urban clusters exist, but lacking access to infrastructural light and not considered as urban zones? Which of these areas are serviced by informal buses?
- What are the transportation options and conditions in these areas?
- How does the built environment pattern in these areas compare to their respective city centers?

Methodology
Diagram made by Alan Ren, Candice Siyun Ji, Kelly Shining Hong, Wei Xiao
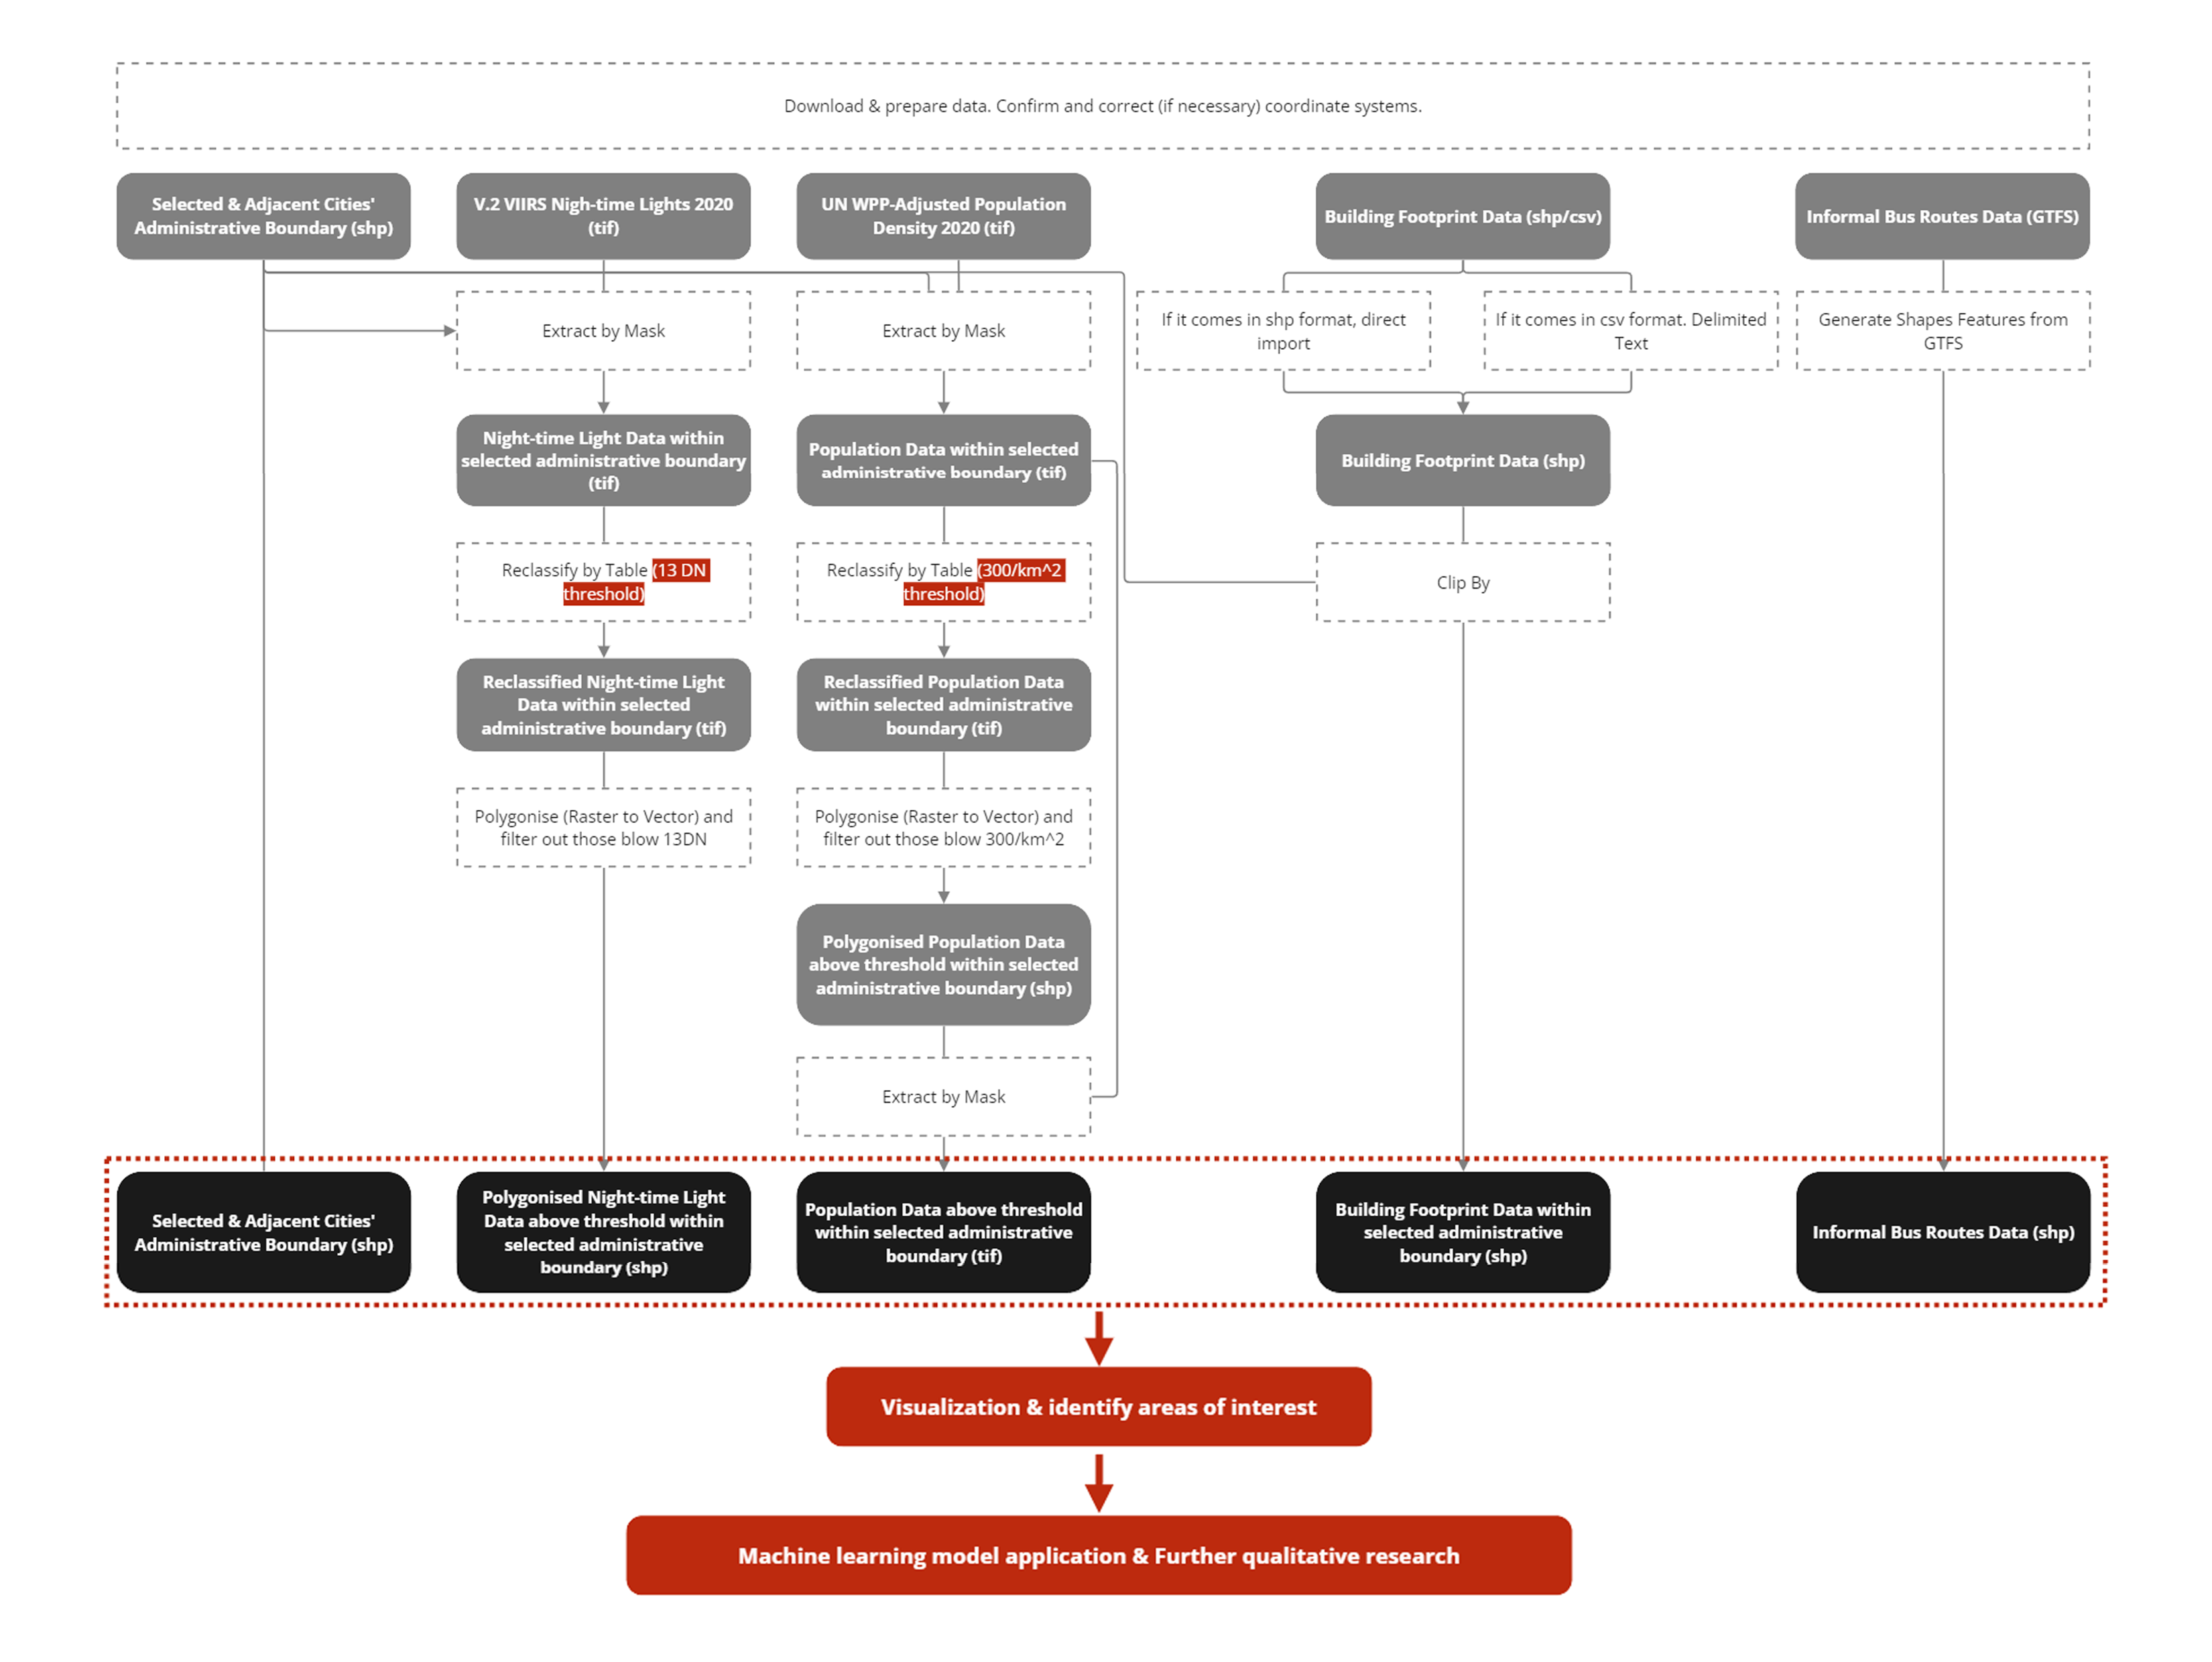
The above diagram illustrates a detailed step-by-step methodology breakdown of the research project. Overall, the methodology of this project can be divided into four main steps.

Step 1: Raw Data Collection
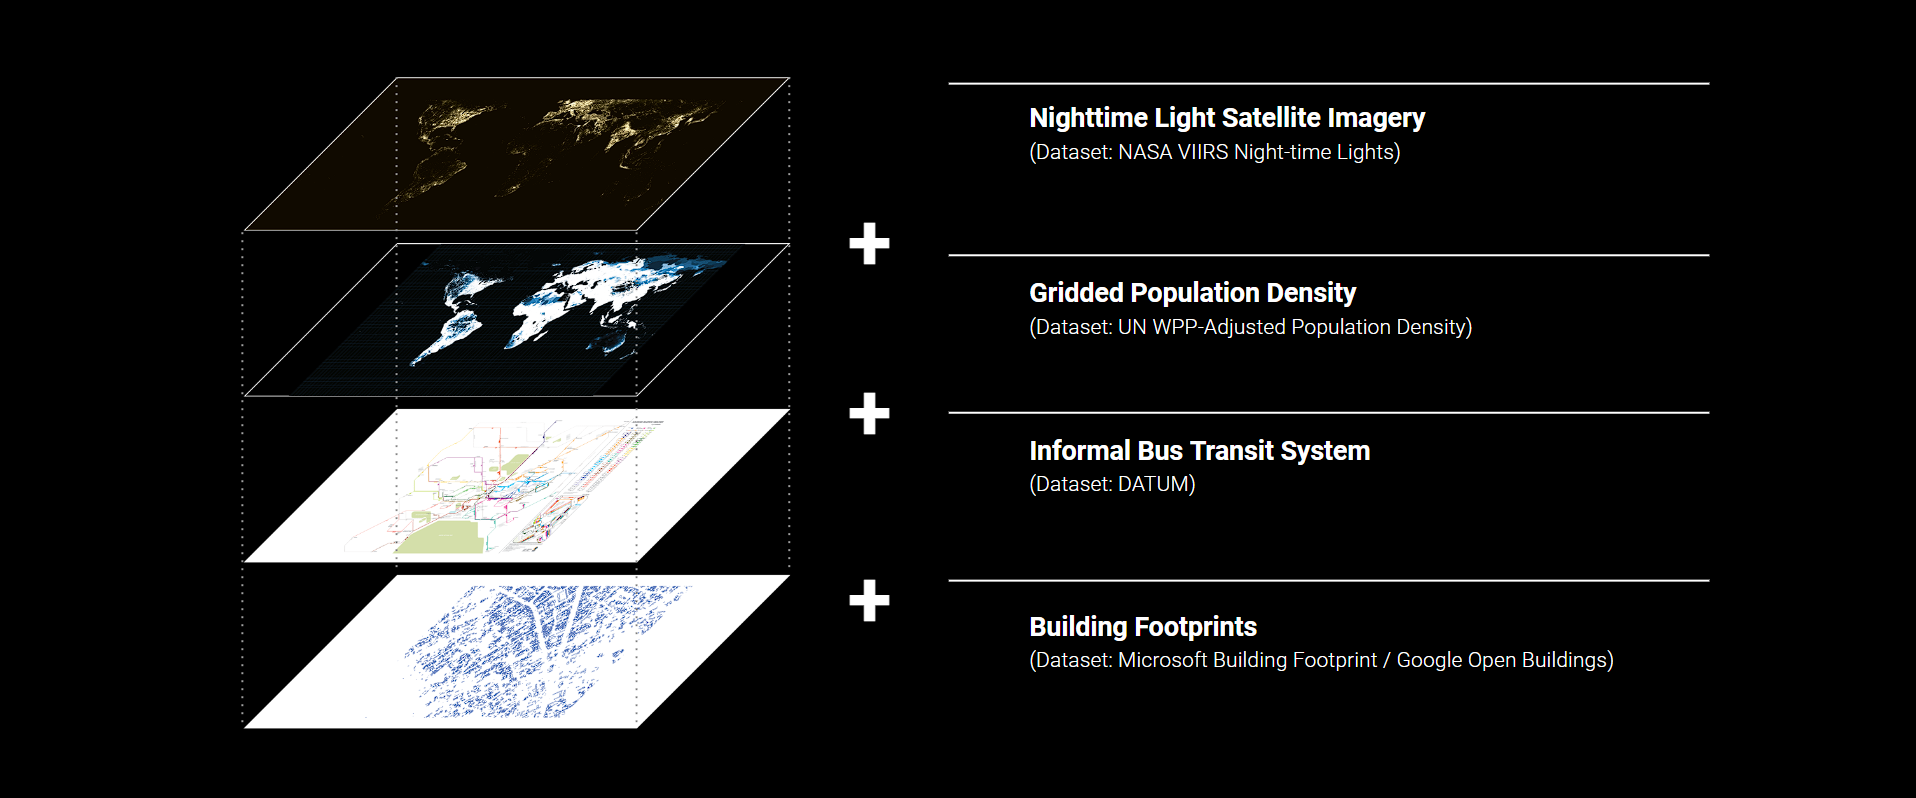
In this step, five primary datasets are collected from each source’s website, including V.2 VIIRS Nighttime Lights, UN WPP-Adjusted Population Density, Building Footprints, Informal Bus Routes, and City Administrative Boundaries. Besides nighttime and population data at the global scale, other datasets should be collected locally depending on each study city.
Diagram made by Alan Ren, Candice Siyun Ji, Kelly Shining Hong, Wei Xiao

-
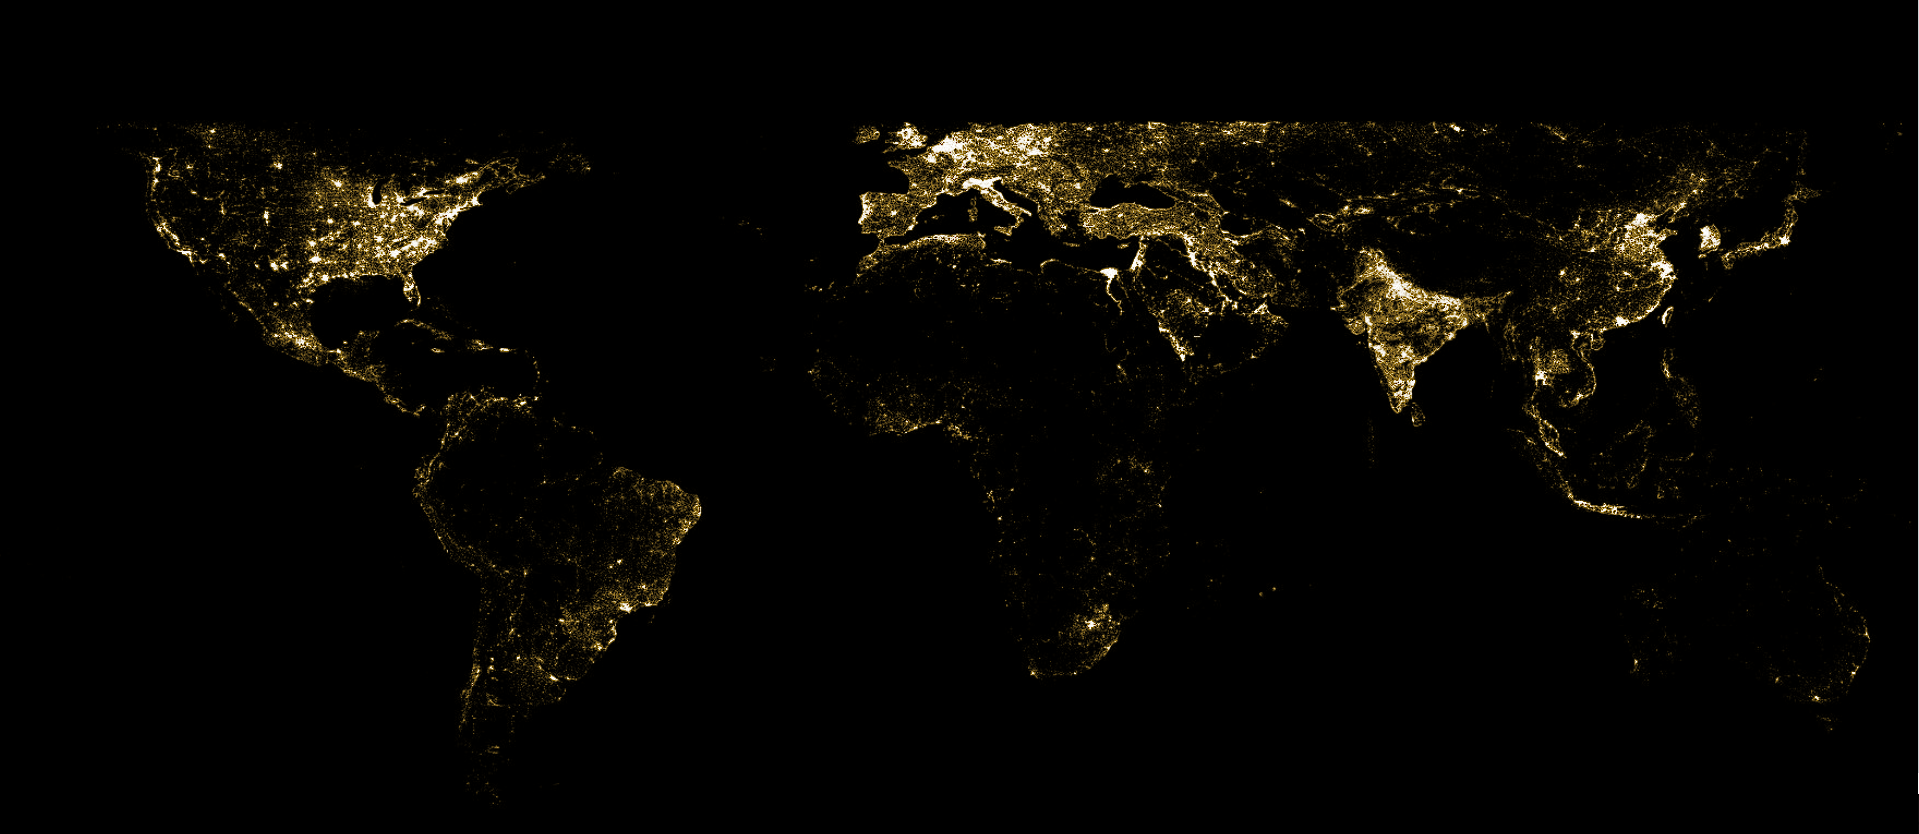
Layer 1: Night-time Light Satellite Imagery
Data Source: NASA VIIRS Night-time Lights (C. D. Elvidge et al., 2017)

-
Layer 2: Gridded Population Density
Data Source: UN WPP-Adjusted Population Density (Center for International Earth Science Information Network, Columbia University, 2018)

-
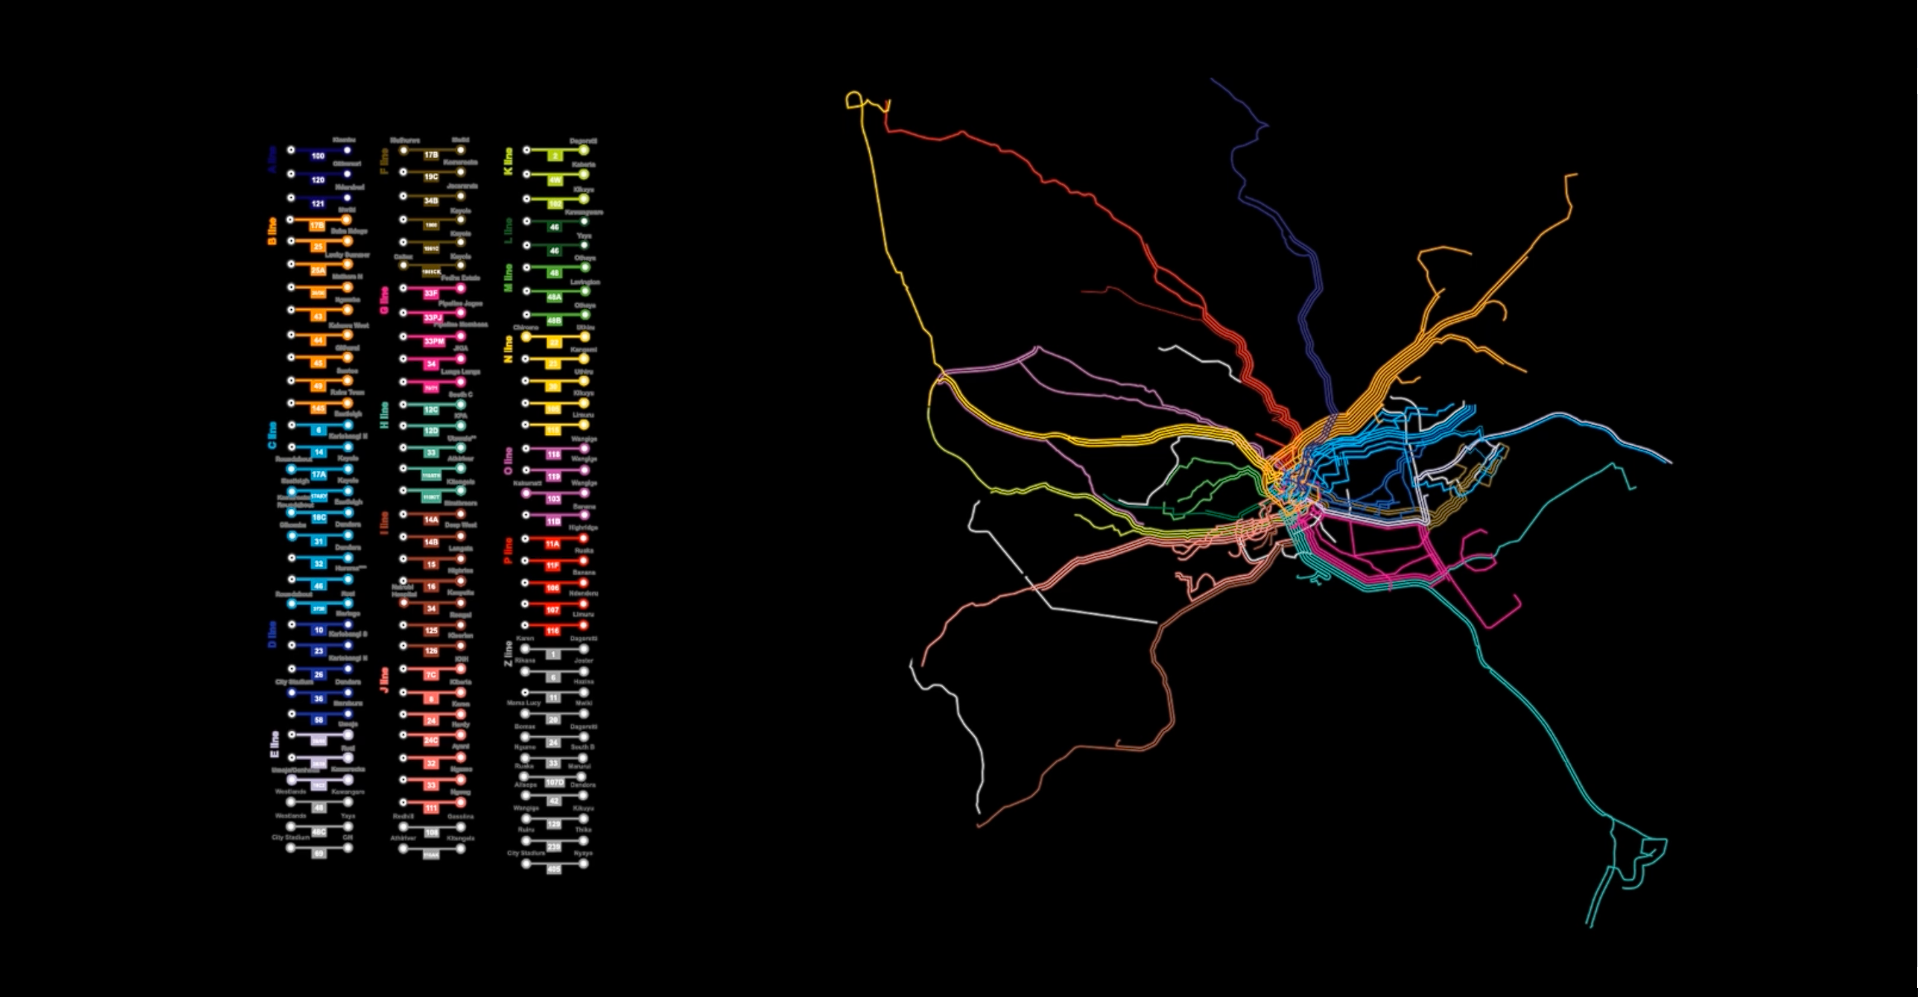
Layer 3: Informal Bus Transit System
Data Source: DATUM. Image Source: digitalmatatus, Civic Data Design Lab MIT, 2014

-
Layer 4: Building Footprints
Data Sources: Microsoft Building Footprint, Microsoft Maps & Geospatial; Open Buildings, Google

-
Layer 5: City Administrative Boundries
Varies based on each city.

Step 2: Data Processing
This step requires raster (image) and vector manipulation with geoprocessing software, including QGIS and ArcGIS. The datasets that require raster processing are V.2 VIIRS Nighttime Lights and UN WPP-Adjusted Population Density, which come in tif format with geo-referencing systems. For the nighttime light data, a threshold of 13DN (Columbia Climate School) is used as the light intensity indicator for urban zones. For the gridded population, a threshold of 300 people per square kilometer (European Union) is taken as the population density indicator for urban clusters. For identified urban clusters, a classification system was applied to all studied cities to visualize population density. The rest of the vector dataset generally requires less processing, as shown in the methodology breakdown diagram.
GIF made by Alan Ren, Candice Siyun Ji, Kelly Shining Hong, Wei Xiao

Step 3: Data Visualization
After all datasets are processed into the ideal formats, they are overlaid to identify areas of research interests based on the following criteria - places where urban clusters are presented but without nighttime light, while informal bus routes reach to the spots.
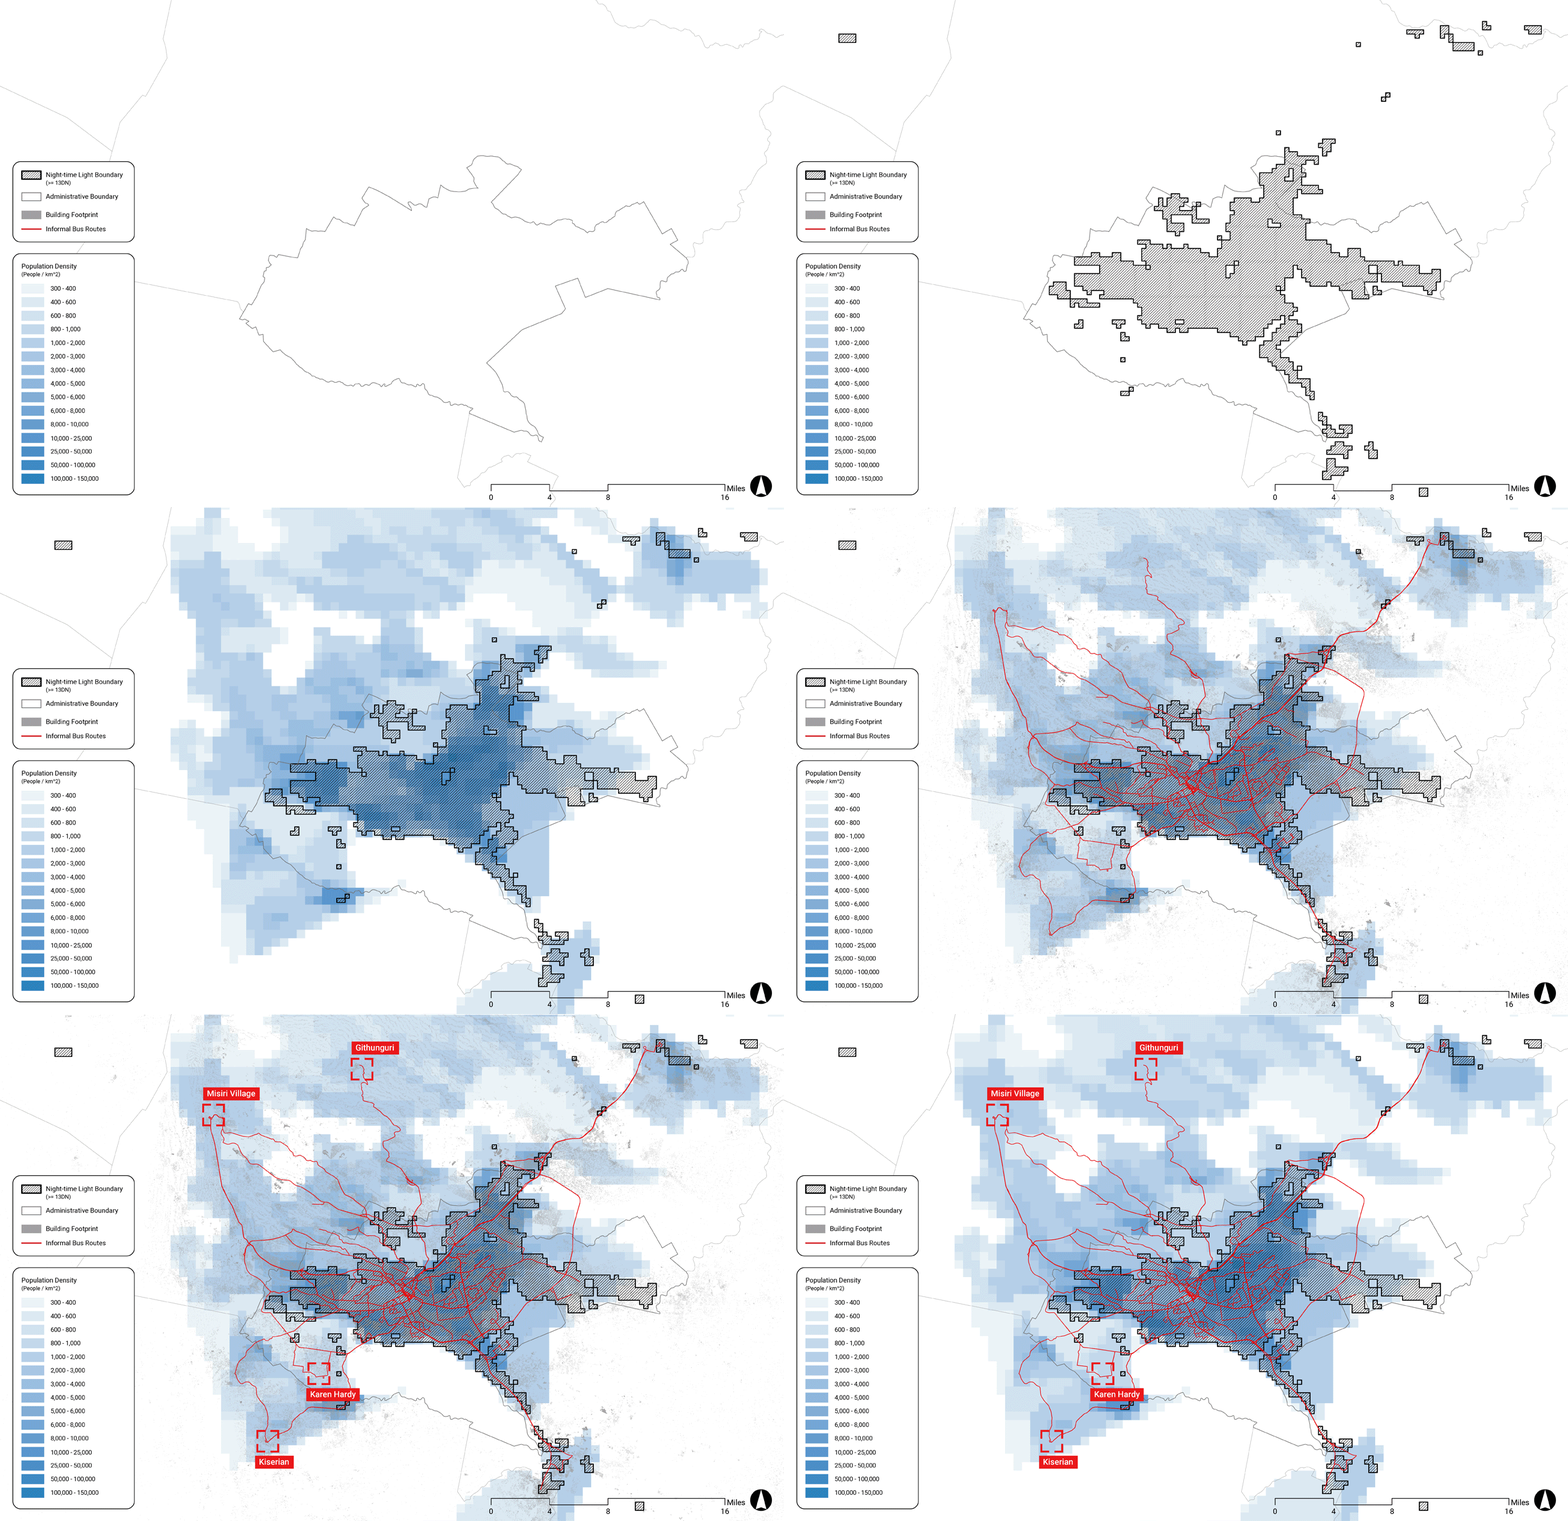
GIF made by Alan Ren, Candice Siyun Ji, Kelly Shining Hong, Wei Xiao

Step 4: Machine Learning
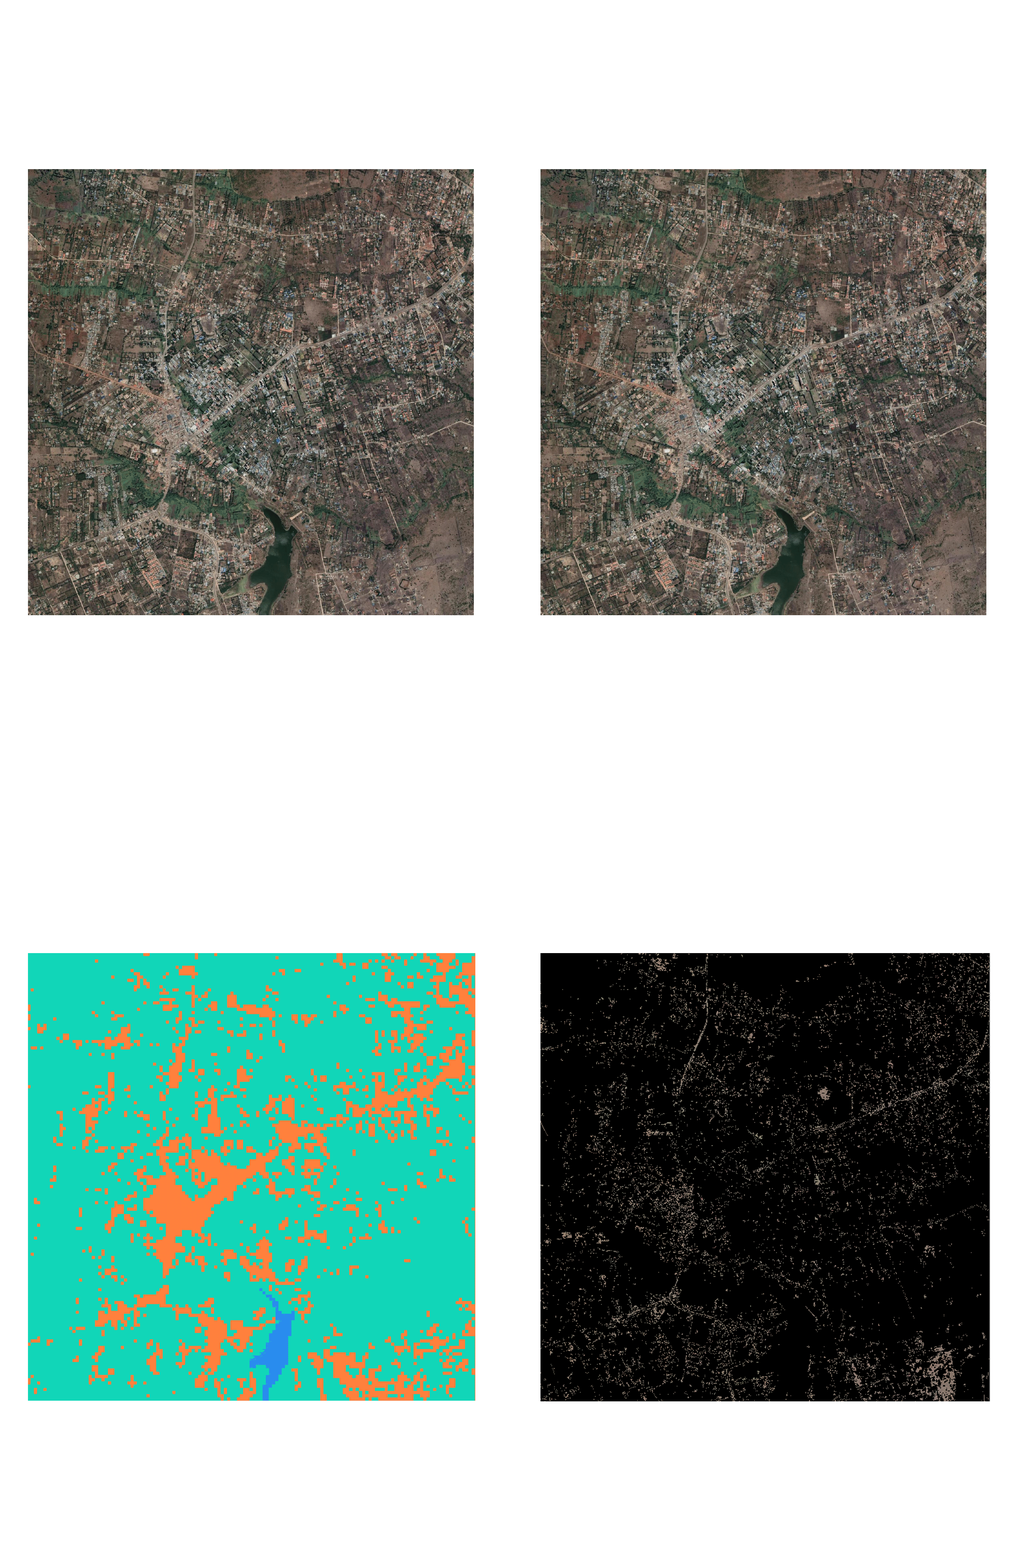
Further research is then done to explore the urban fabrics and materiality of the built environment. Two machine learning classification models are employed in this step, both at the satellite scale in the unit of two kilometers by two kilometers square from the central coordinate of each city and selected towns. The first model reclassified the urban patterns into built, vegetation, and water coverage using Landsat 8 images by breaking it down into individual bands and extracting pixels based on an existing training set, from which we can investigate the degree of urbanization from the categories identified. The second model selects pixels from satellite images with a predetermined color range - in this study, a brownish tone with an RGB value of (139, 117, 103) and an additional 15 buffer to recognize earthy material in the urban context. The result can be treated as an indicator of potential under/undeveloped areas or roads and buildings constructed out of raw earth.
GIF made by Alan Ren, Candice Siyun Ji, Kelly Shining Hong, Wei Xiao

Case Study Site Selection Results
This project selected five Global South cities as case study sites, examining the relationship between NASA nighttime light images, informal bus trip routes and stops, population density, and building footprints. The findings reveal diverse urban development patterns and challenges, including correlations among these factors.

Accra, Ghana
GIF made by Alan Ren, Candice Siyun Ji, Kelly Shining Hong, Wei Xiao
In Accra, Ghana, informal bus routes are primarily distributed along the coastline, while three emerging new towns near the NASA nighttime light image boundary exhibit a relatively low building footprint density.

Addis Ababa, Ethiopia
GIF made by Alan Ren, Candice Siyun Ji, Kelly Shining Hong, Wei Xiao
Informal bus stops in Addis Ababa, Ethiopia are primarily situated along the city’s main roads, while two satellite towns lack such stops. Furthermore, the NASA nighttime light image boundary is significantly smaller than the regions with the lowest population density, indicating that numerous self-built houses may lack electricity at night.
Data limitations allowed us to obtain only stop points rather than complete stop trips.

Cairo, Egypt
GIF made by Alan Ren, Candice Siyun Ji, Kelly Shining Hong, Wei Xiao
Informal bus areas in Cairo, Egypt, are primarily located within the urban region and NASA nighttime light image boundaries, with the exception of the 10th Ramadan City. Although informal bus trips are well-connected horizontally, vertical connections are limited due to the presence of agricultural land in the north and south of the city.

Harare, Zimbabwe
GIF made by Alan Ren, Candice Siyun Ji, Kelly Shining Hong, Wei Xiao
Harare, Zimbabwe’s urban morphology resembles that of Addis Ababa, featuring a central radial pattern connecting surrounding satellite towns. However, the areas containing informal bus stops almost entirely overlap with regions exhibiting the lowest urban population density. Interestingly, the NASA nighttime light image in Harare is significantly smaller than the areas with the lowest population density boundary, excluding the city’s most populated areas in the southern and eastern regions.

Nairobi, Kenya
GIF made by Alan Ren, Candice Siyun Ji, Kelly Shining Hong, Wei Xiao
In Nairobi, Kenya, the urban cluster extent exceeds its planned administrative area, blurring the concept of downtown and suburbs when considering areas with a population density of 300 people per square kilometer. The NASA nighttime light image and urban extent almost coincide within the Nairobi administrative area. Although the informal bus system connects numerous surrounding villages and new towns, it does not overlap with the NASA nighttime light image boundary in the city’s western part, suggesting an imbalanced development between Nairobi’s eastern and western regions.

Findings
By analyzing the layers of datasets, a few key themes emerged highlighting the urban fabric patterns, the percentage of earth, the availability of transportation options, and the informal mobility conditions experienced by residents living in areas with low levels of night light.

Built Environment Findings on the Satellite Scale
How does the urban morphology vary in areas with urban clusters and limited night lighting and formal transportation infrastructure?
Findings from the two machine learning classification models reveal that towns situated at the periphery of informal bus routes exhibit lower levels of built features and higher levels of earth-tone colors as compared to their corresponding city centers.

Urban Fabric
How does the urban fabric manifest in areas lacking formal transportation infrastructure and reliant on informal modes of transportation, and how does it compare to the urban fabric in their respective city centers?
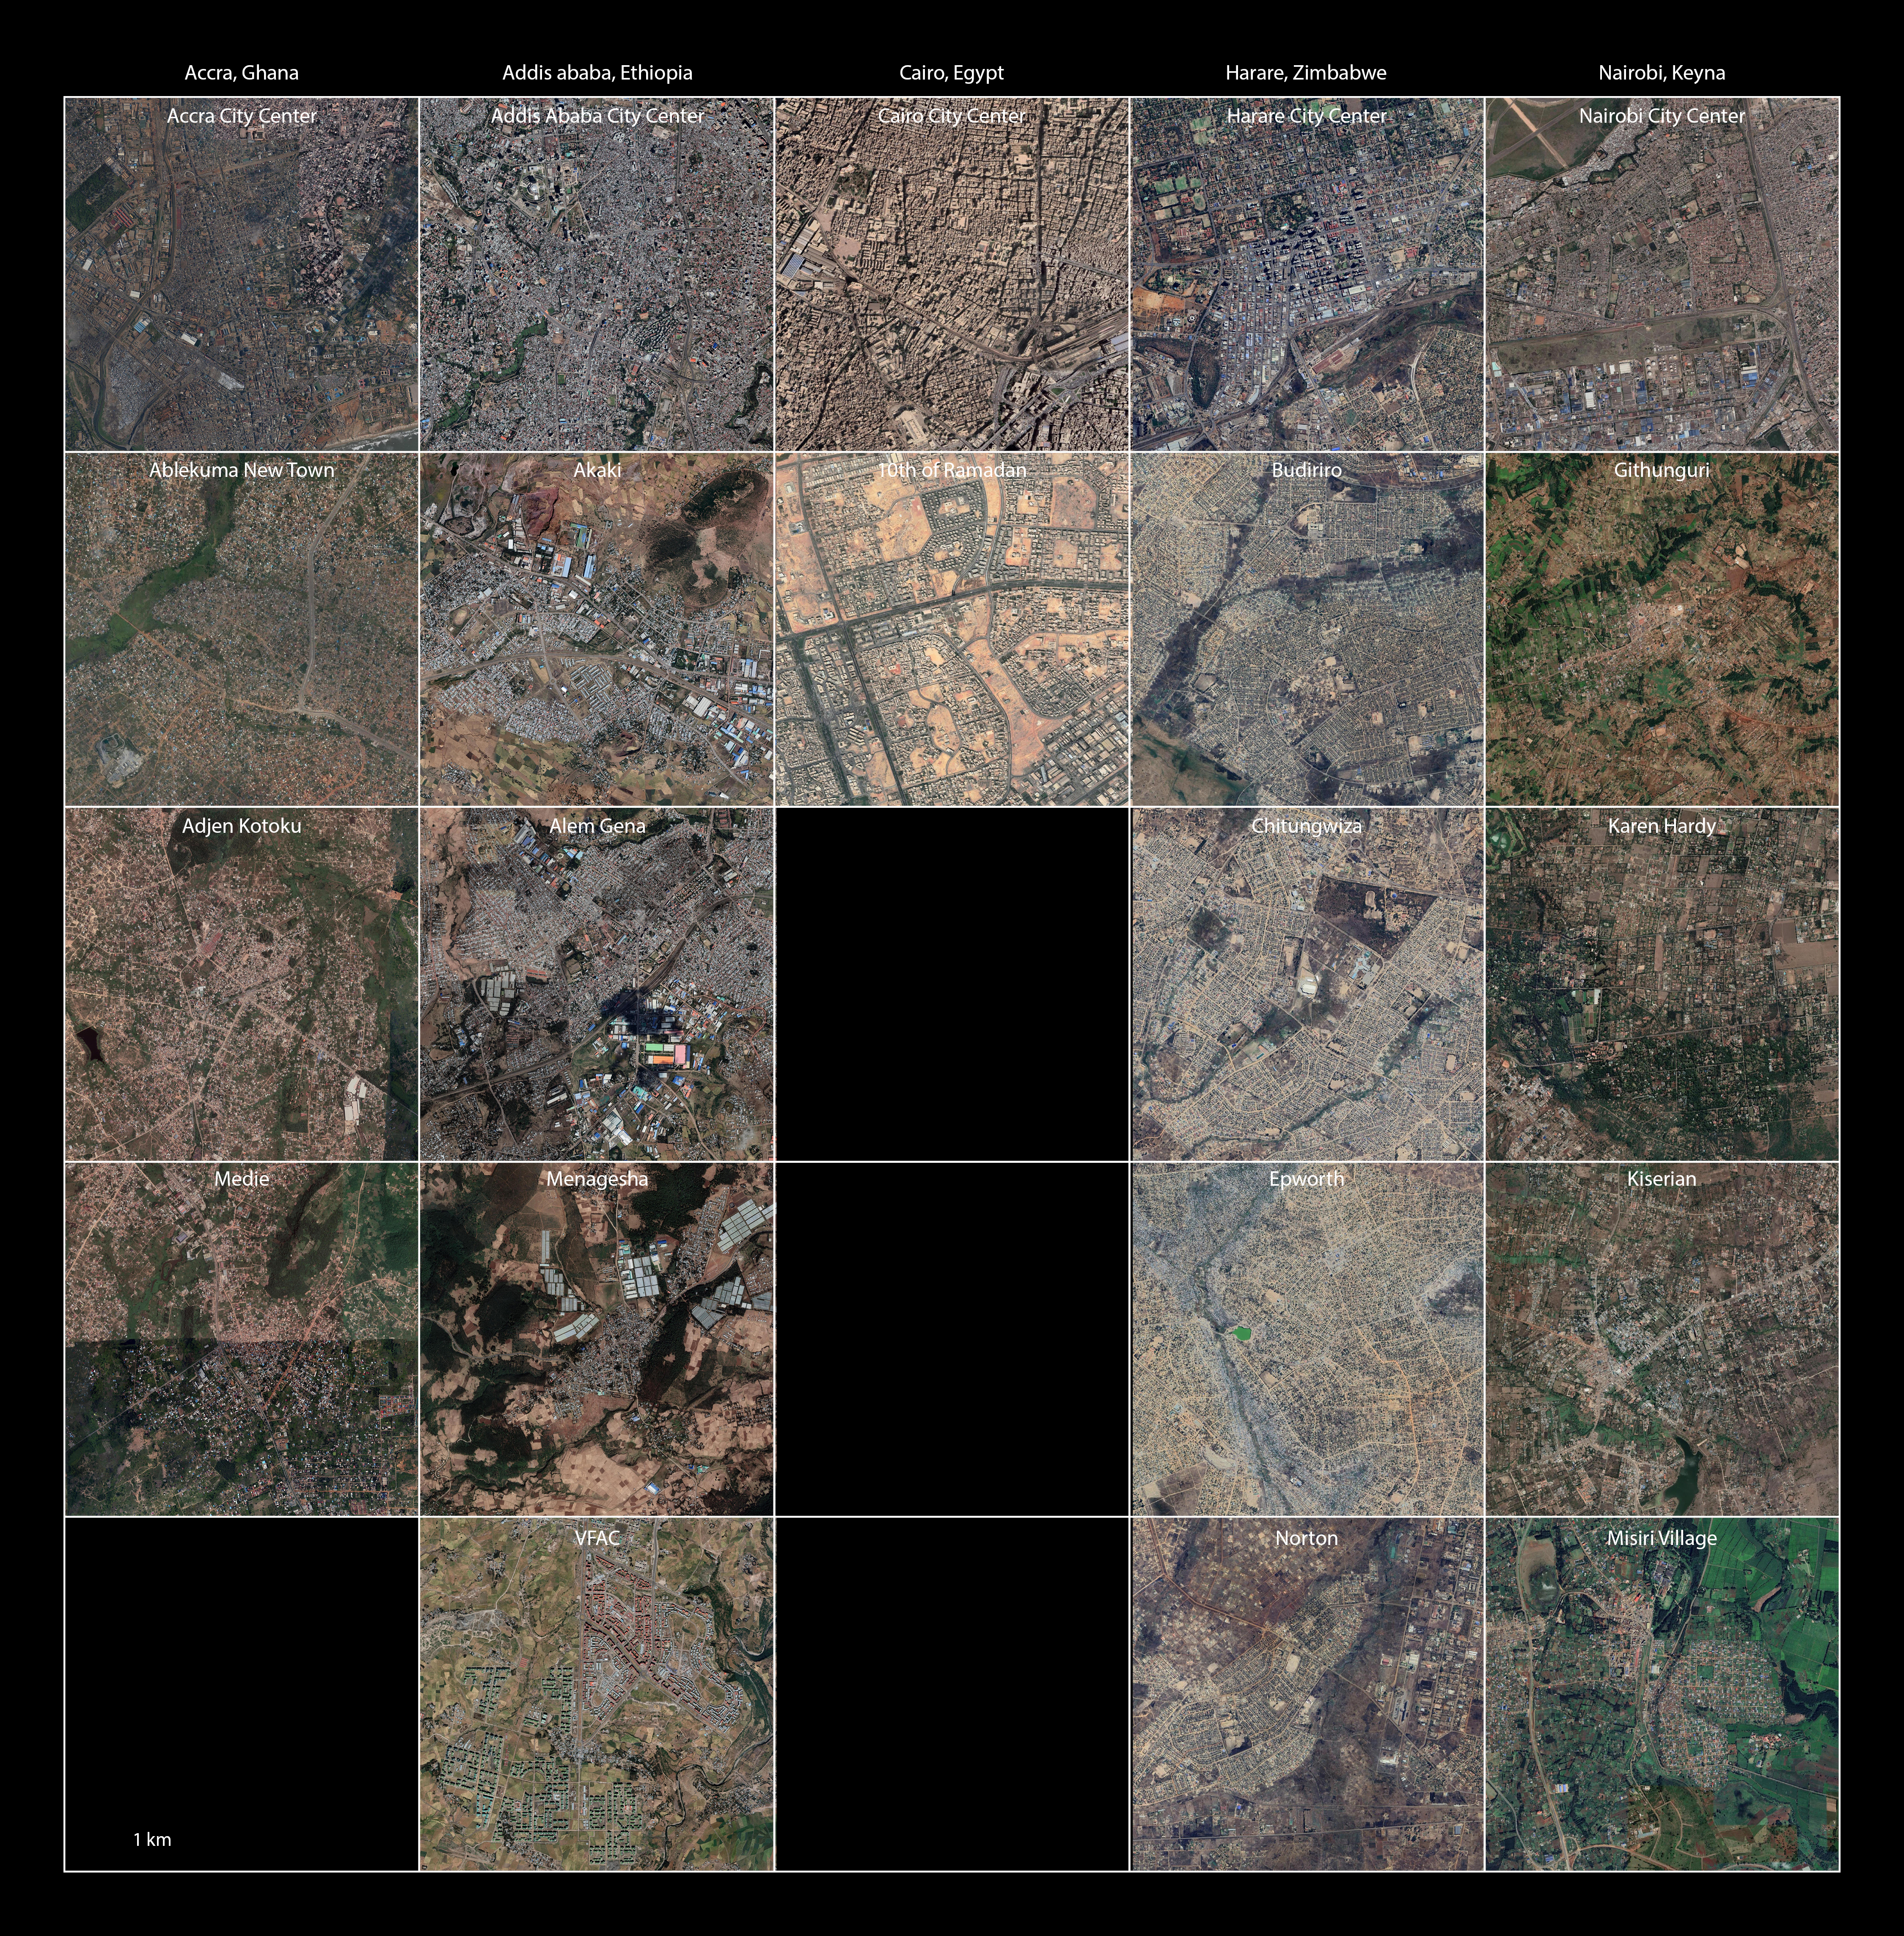
Map made by Alan Ren, Candice Siyun Ji, Kelly Shining Hong, Wei Xiao
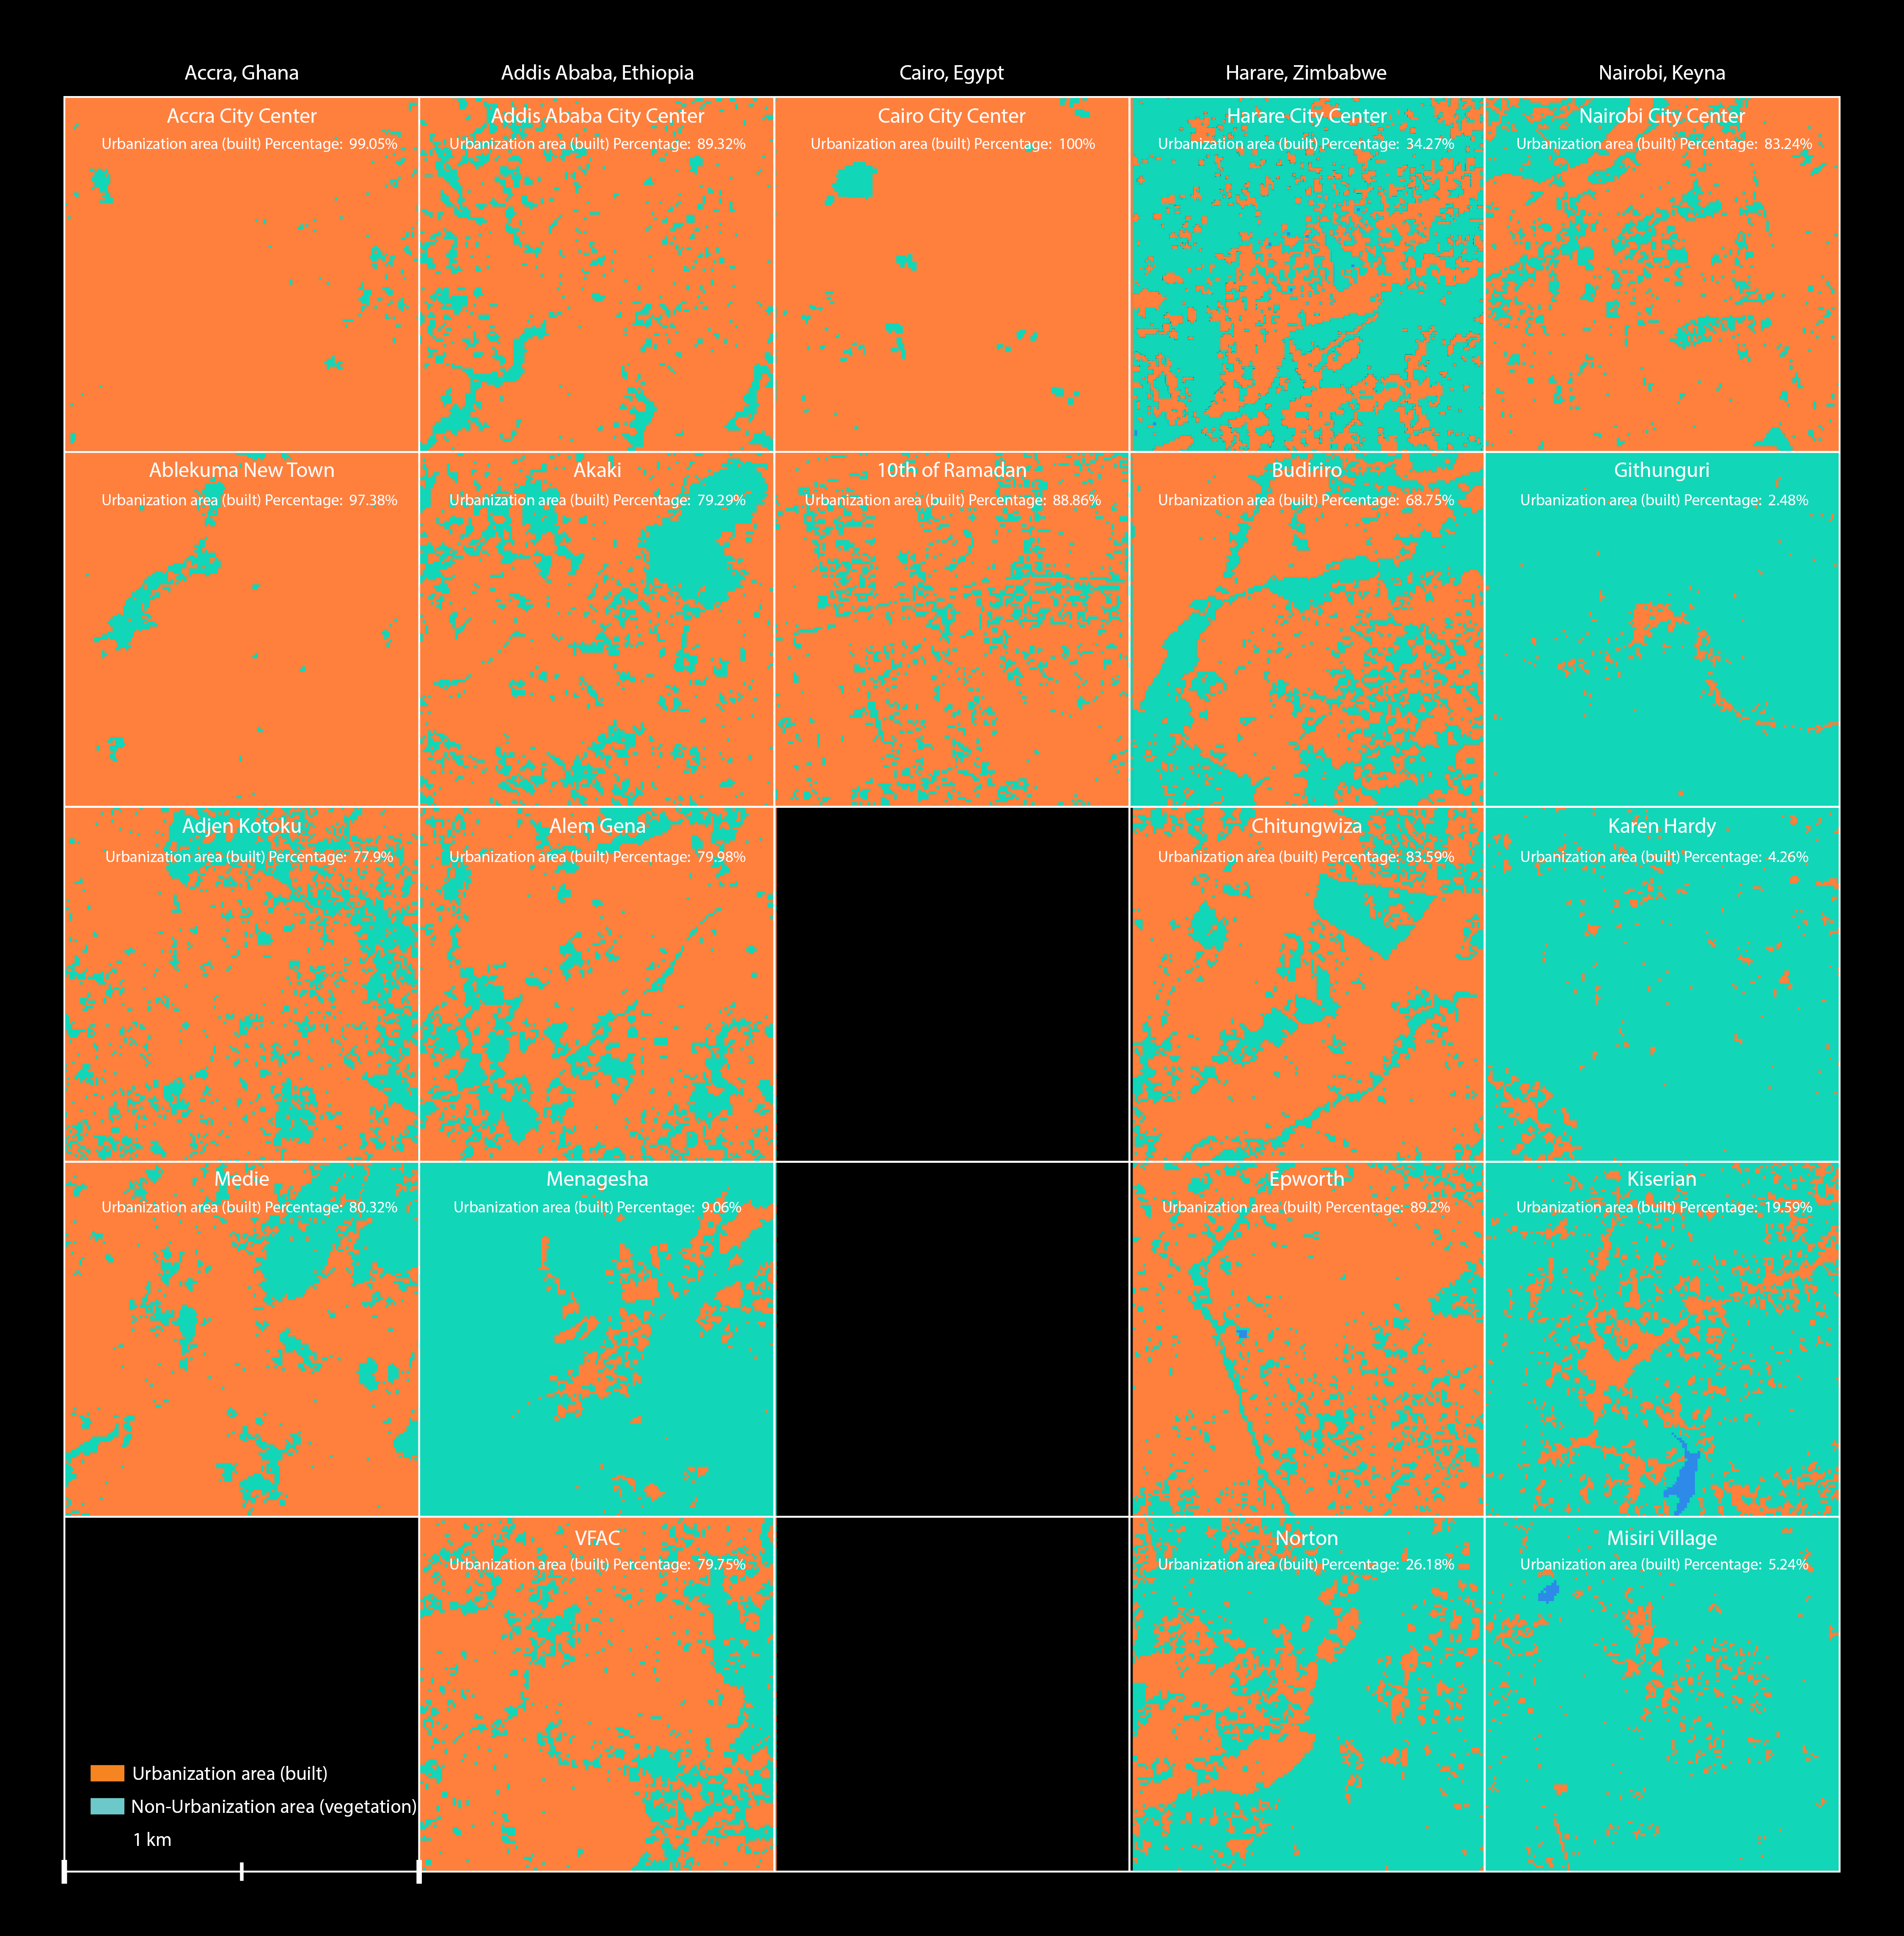
Map made by Alan Ren, Candice Siyun Ji, Kelly Shining Hong, Wei Xiao
Green is non-built features vs. Orange is built features
The findings from the machine learning classification models reveal that towns located at the end of informal bus routes generally have lower levels of built features compared to their respective city centers. For example, in Nairobi, the four towns of Githunguri, Karen Hardy, Kiserian, and Misiri Village at the end of the informal bus route exhibit an average of only 7.9% of built features, while the central coordinate of Nairobi has an 83.2% built area. Similarly, in Addis Ababa, the four towns of Akaki, Alem Gena, Menagesha, and VFAC at the end of the informal bus route exhibit an average of 62.0% of built features compared to the central coordinates’ 89.3% built area. These results indicate a possible relationship between the absence of formal transportation infrastructure and the built environment and urban fabric in these regions.
However, an outlier to this trend was observed in Harare, Zimbabwe, where the towns at the periphery of the city exhibited a higher level of built features (66.9% built area) compared to the city center (34.3%). This anomaly could be attributed to the “infrastructural degeneration” of Harare in recent decades, as the city’s infrastructure and services have failed to keep pace with population growth, resulting in physical infrastructure decline (Atwood 2016; Ndlovu and Narayanan 2023). The machine learning of the satellite images further support this claim, as the towns located at the end of informal transit routes have a higher level of built features compared to the geographic center of Harare.

Recognition of Earth
To what extent do areas lacking formal transportation infrastructure and relying on informal modes of transportation exhibit earth tone colors, and how does it compare to the urban fabric in their respective city centers?
Map made by Alan Ren, Candice Siyun Ji, Kelly Shining Hong, Wei Xiao
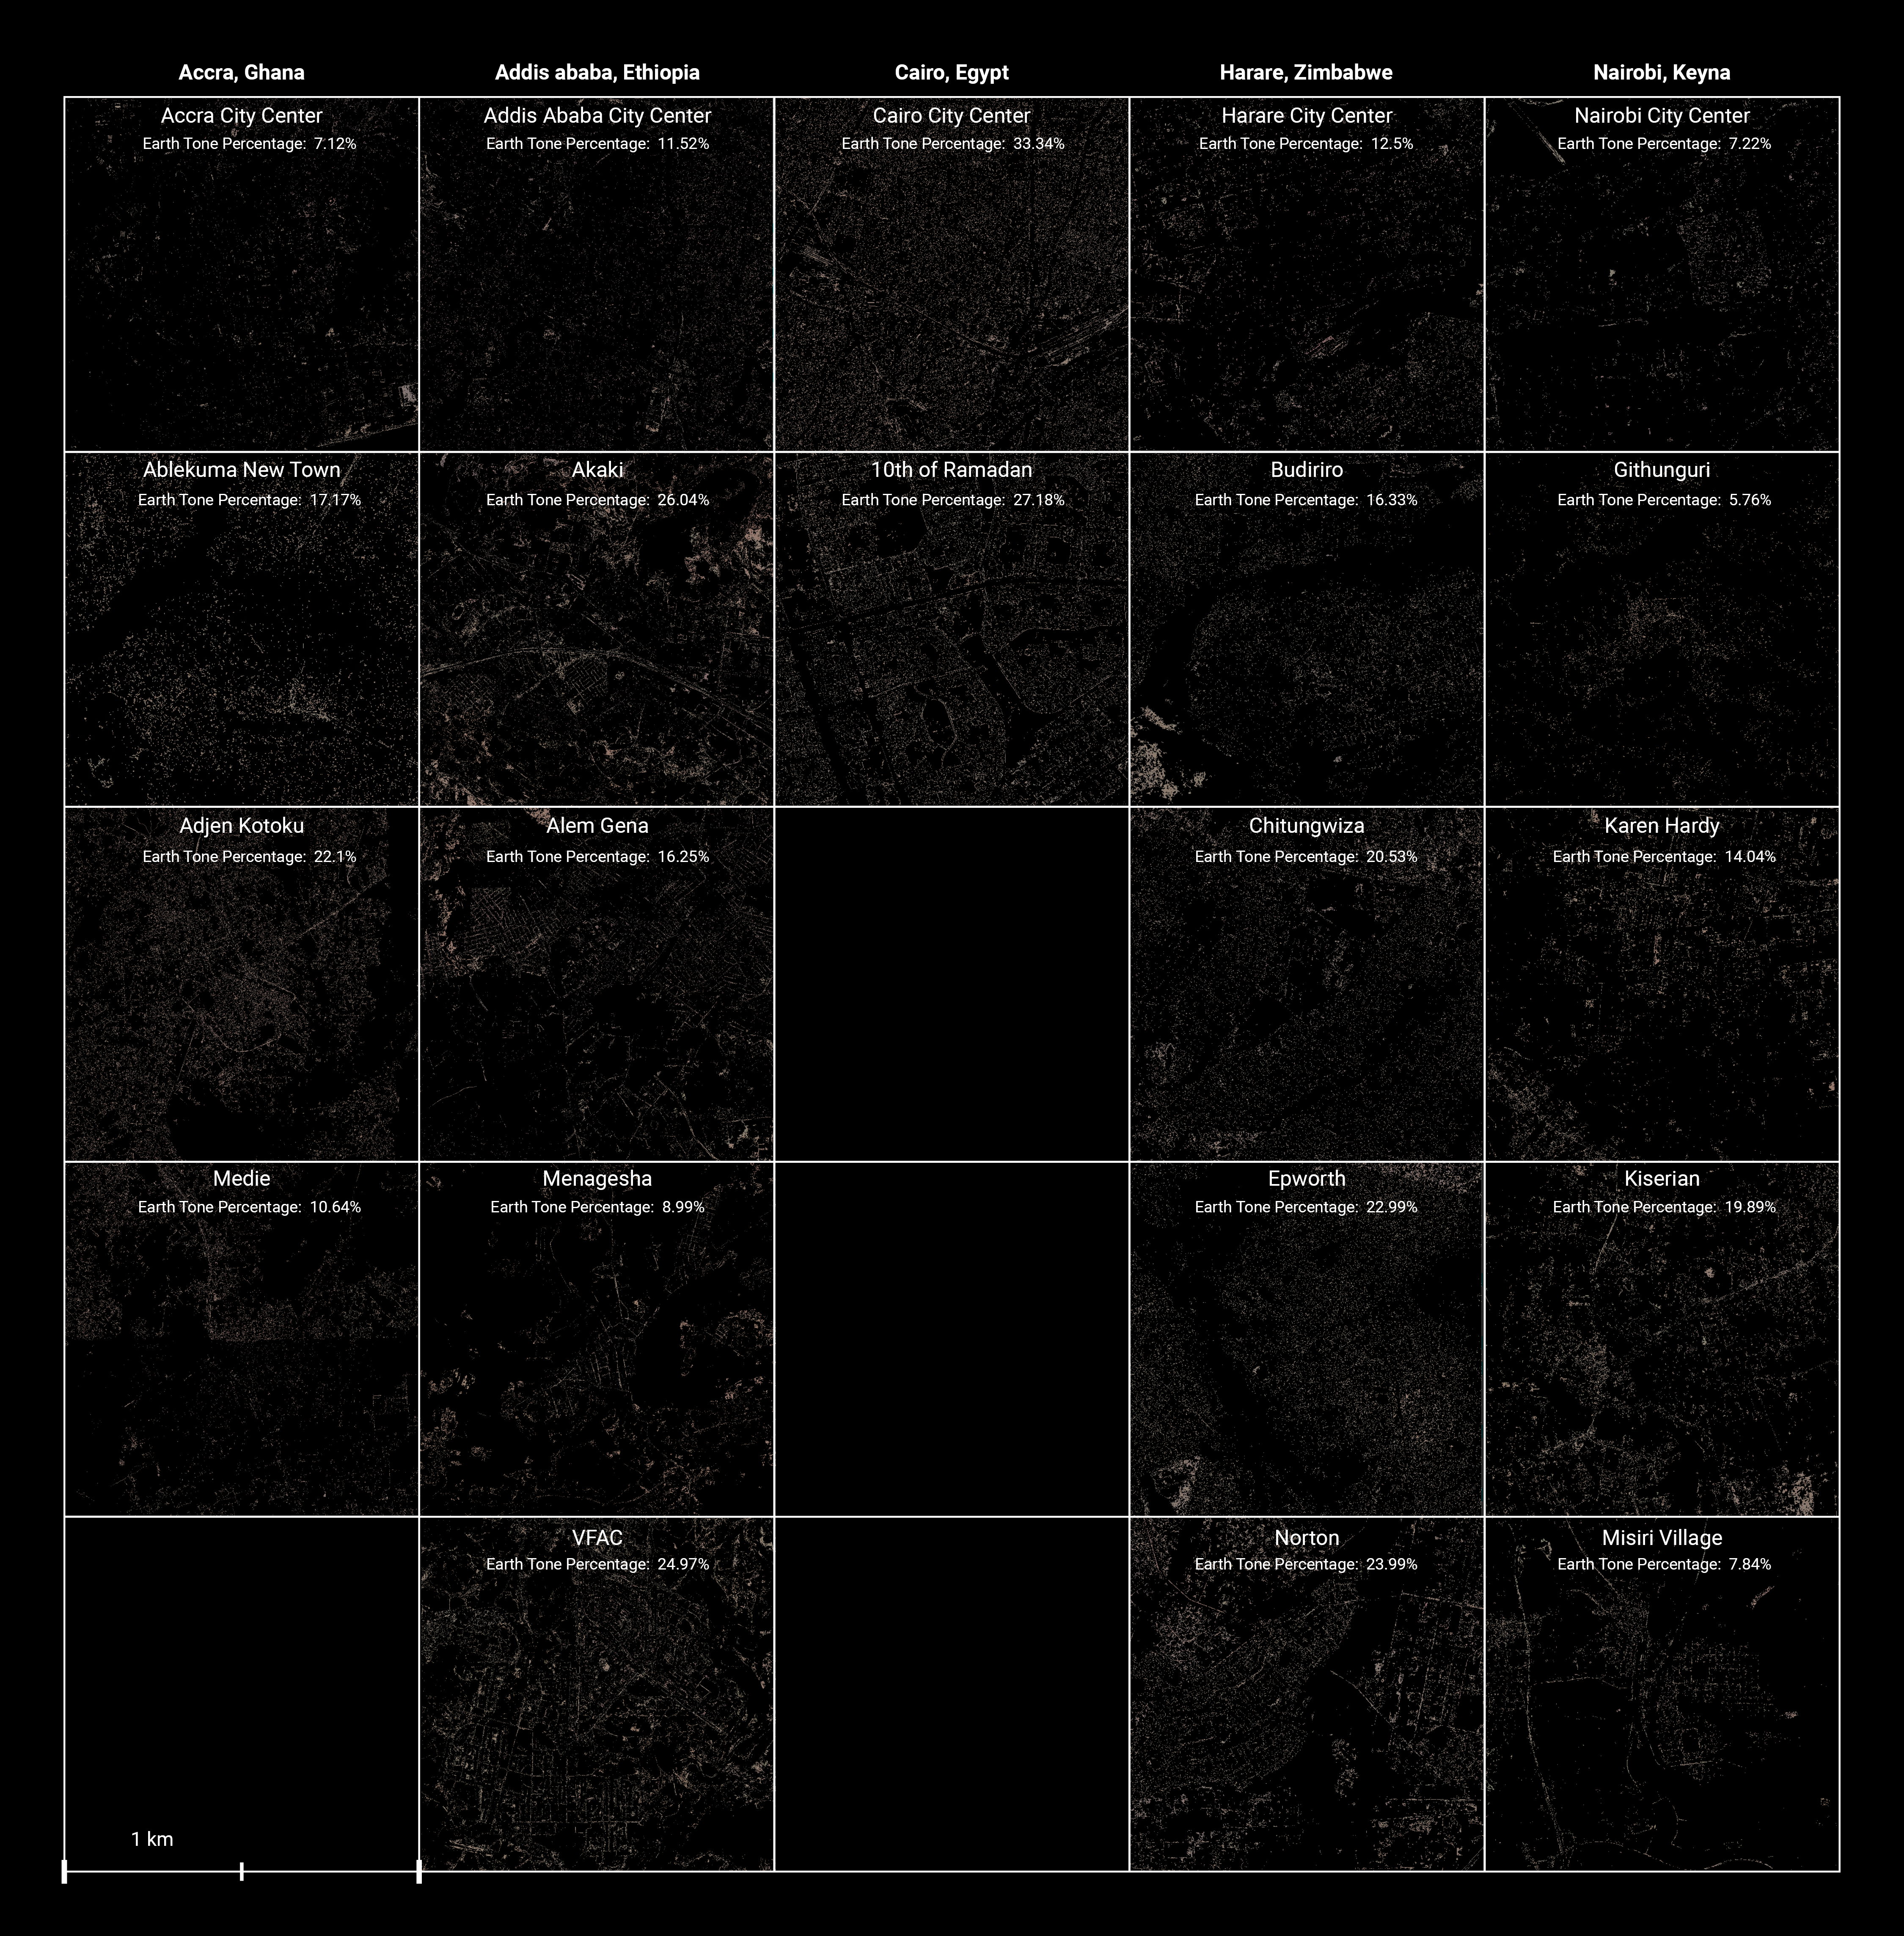
The percentage of earth tone colors in areas lacking formal transportation infrastructure and relying on informal modes of transportation is generally higher than in their respective city centers. The average percentage of earth tone color in the central square of four case study towns near Accra, Ghana, including Ablekuma New Town, Adjen Kotoku, and Medie, is 16.64%, compared to 7.12% in the geographic center of Accra city. Similarly, in Harare, Zimbabwe, the city center exhibits 12.5% of earth tone color, while the four case study towns lacking formal infrastructure and night light, including Budiriro, Chitungwiza, Epworth, and Norton, show an average of 20.96% of earth tone colors.
An outlier is observed in Cairo, Egypt, where the city center exhibits a 6% higher presence of earth tone color than 10th Ramadan City, situated 60 kilometers away. This anomaly can be attributed to the prevalent use of construction materials in the city and its surroundings that resemble the desert and are coated with a sand-colored plaster, falling within the range of earth-tone colors identified by the machine learning classification model.

Transportation Findings on the Town Scale
How do individuals navigate transportation in areas with inadequate formal transportation infrastructure and low levels of nighttime lighting?
Individuals residing in the selected sites located near the capital cities face significant challenges in accessing affordable and convenient means of transportation. Owning a personal vehicle is often financially unattainable, while the cost of hiring a taxi is exorbitant and may exceed a day’s wage. Additionally, public buses are frequently time-consuming. Consequently, informal transportation modes often become the preferred choice for individuals needing to travel at night.

Transportation Options
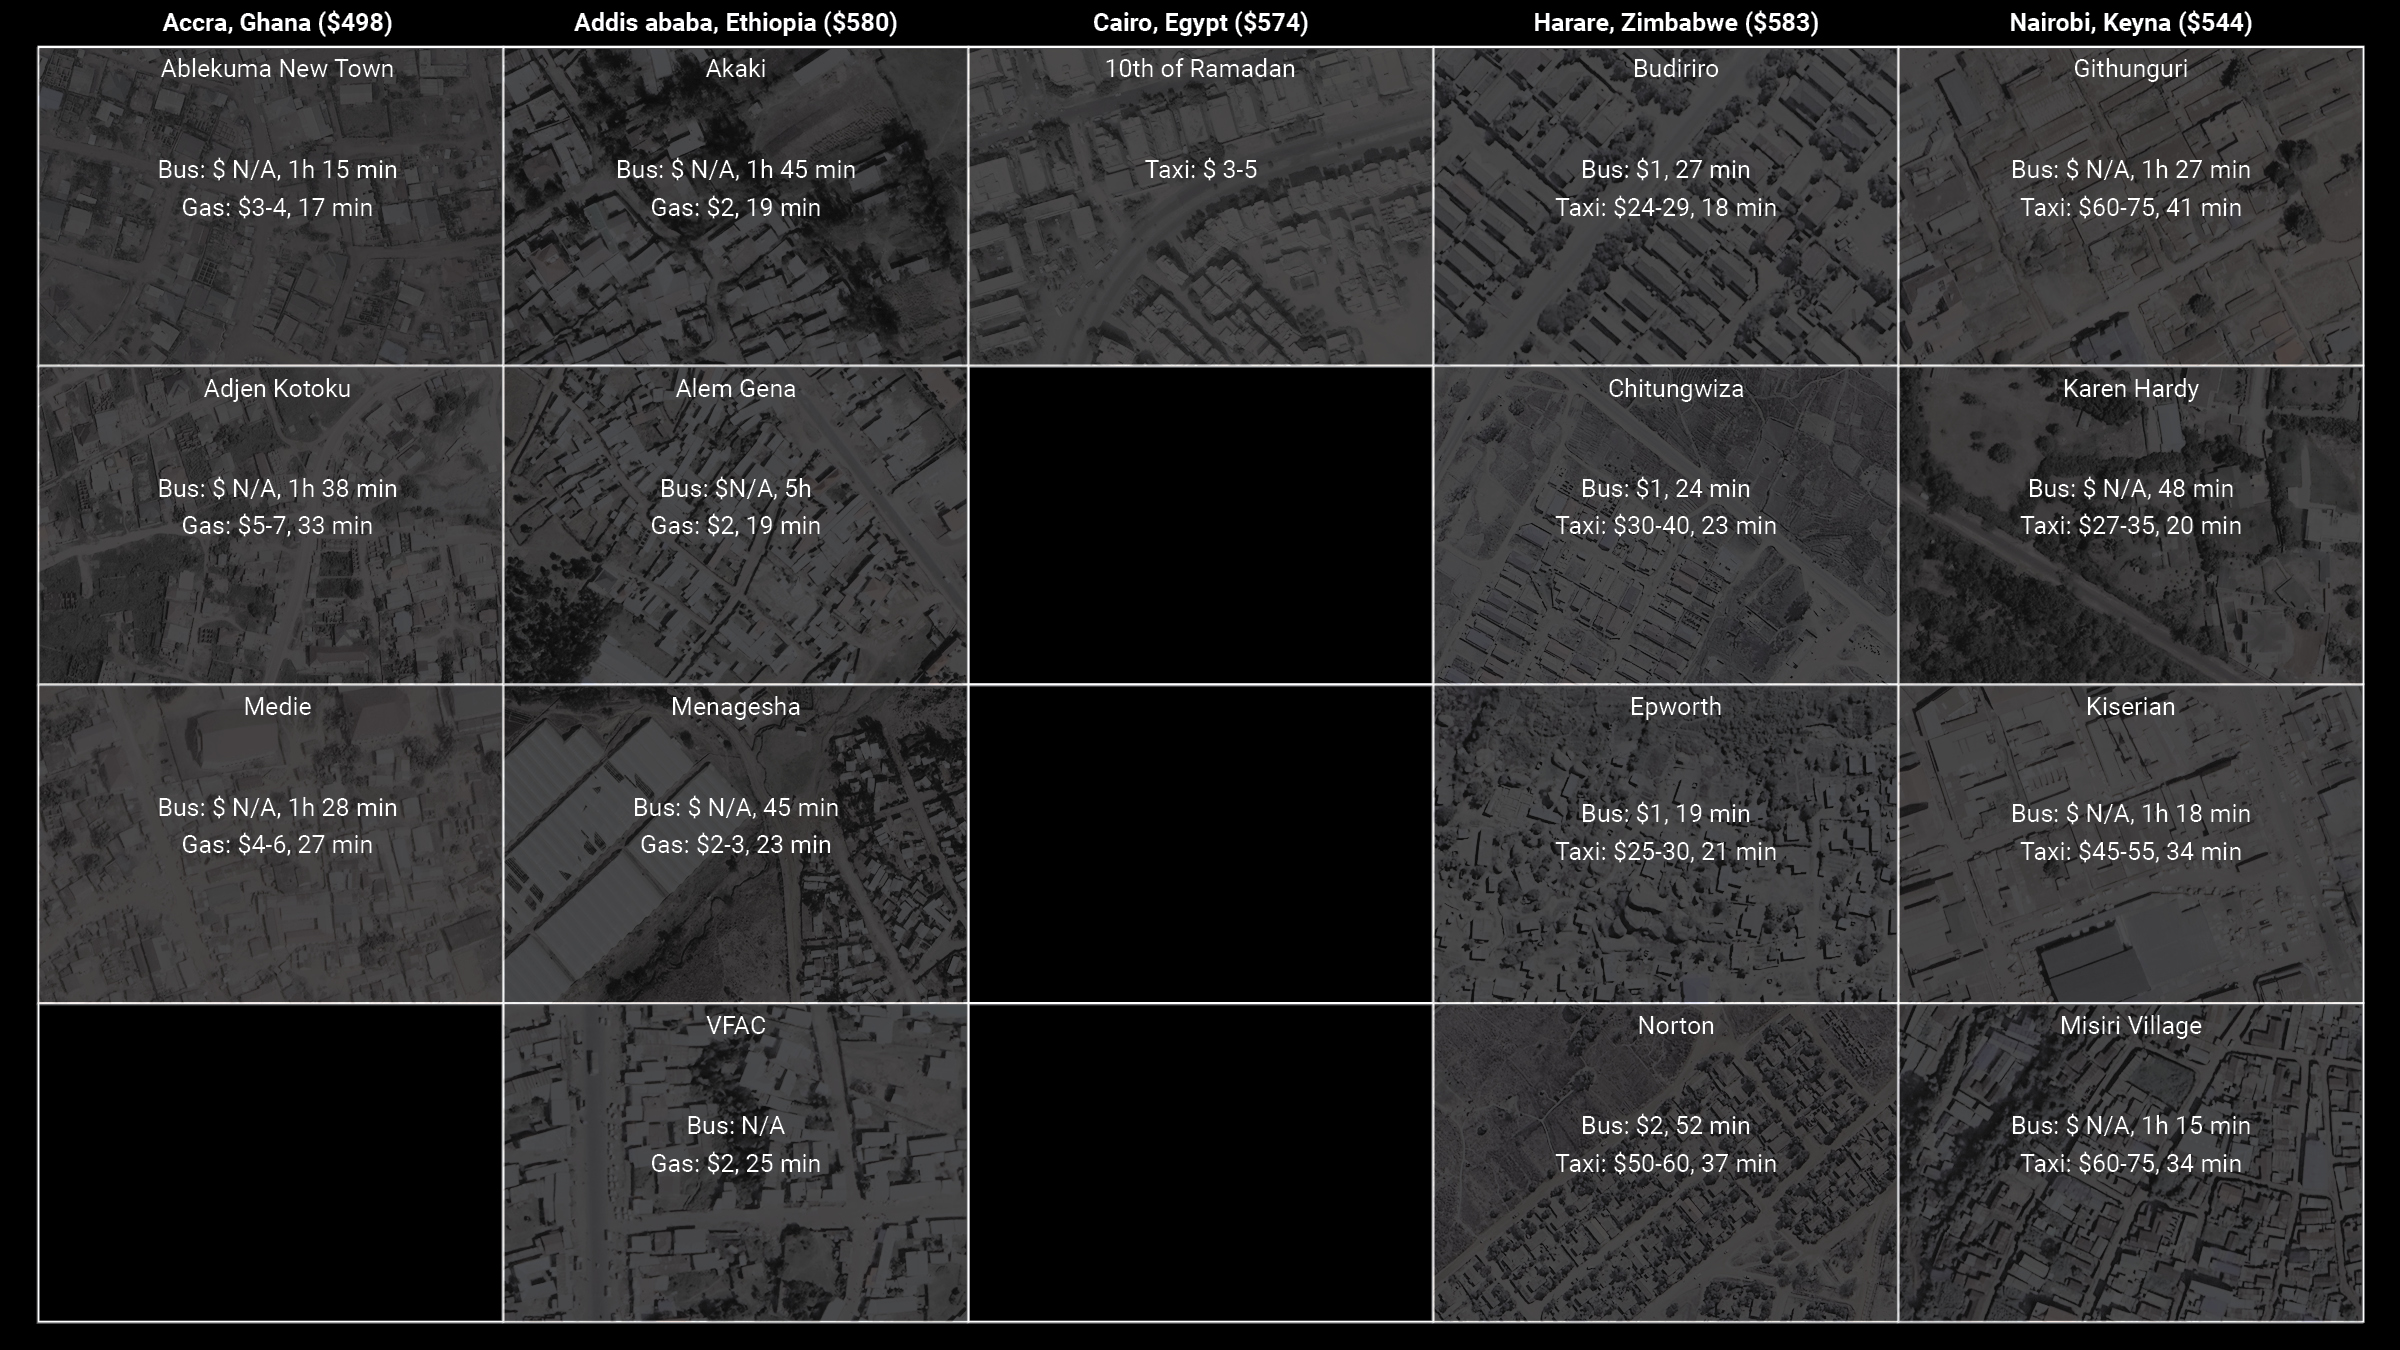
Image made by Alan Ren, Candice Siyun Ji, Kelly Shining Hong, Wei Xiao
The catalog presents a range of transportation options available for commuting from neighboring towns to their respective capital cities. The median monthly income for each capital city is also provided for reference. The findings indicate that commuting by bus is a time-consuming option, driving is often not a feasible option, and taking a taxi is a considerably expensive choice. Moreover, regardless of the mode of transportation, residents of neighboring towns face limitations when traveling to their respective capital cities. The catalog also includes information on the amount of gas money required for each trip, and specifies whether the available bus and taxi services are formal or informal.
The catalog displays transportation options from neighboring towns to their respective capital cities, including information on formal and
informal buses and taxis, as well as the cost of gas for each trip. The data was sourced from the Rome2Rio website.

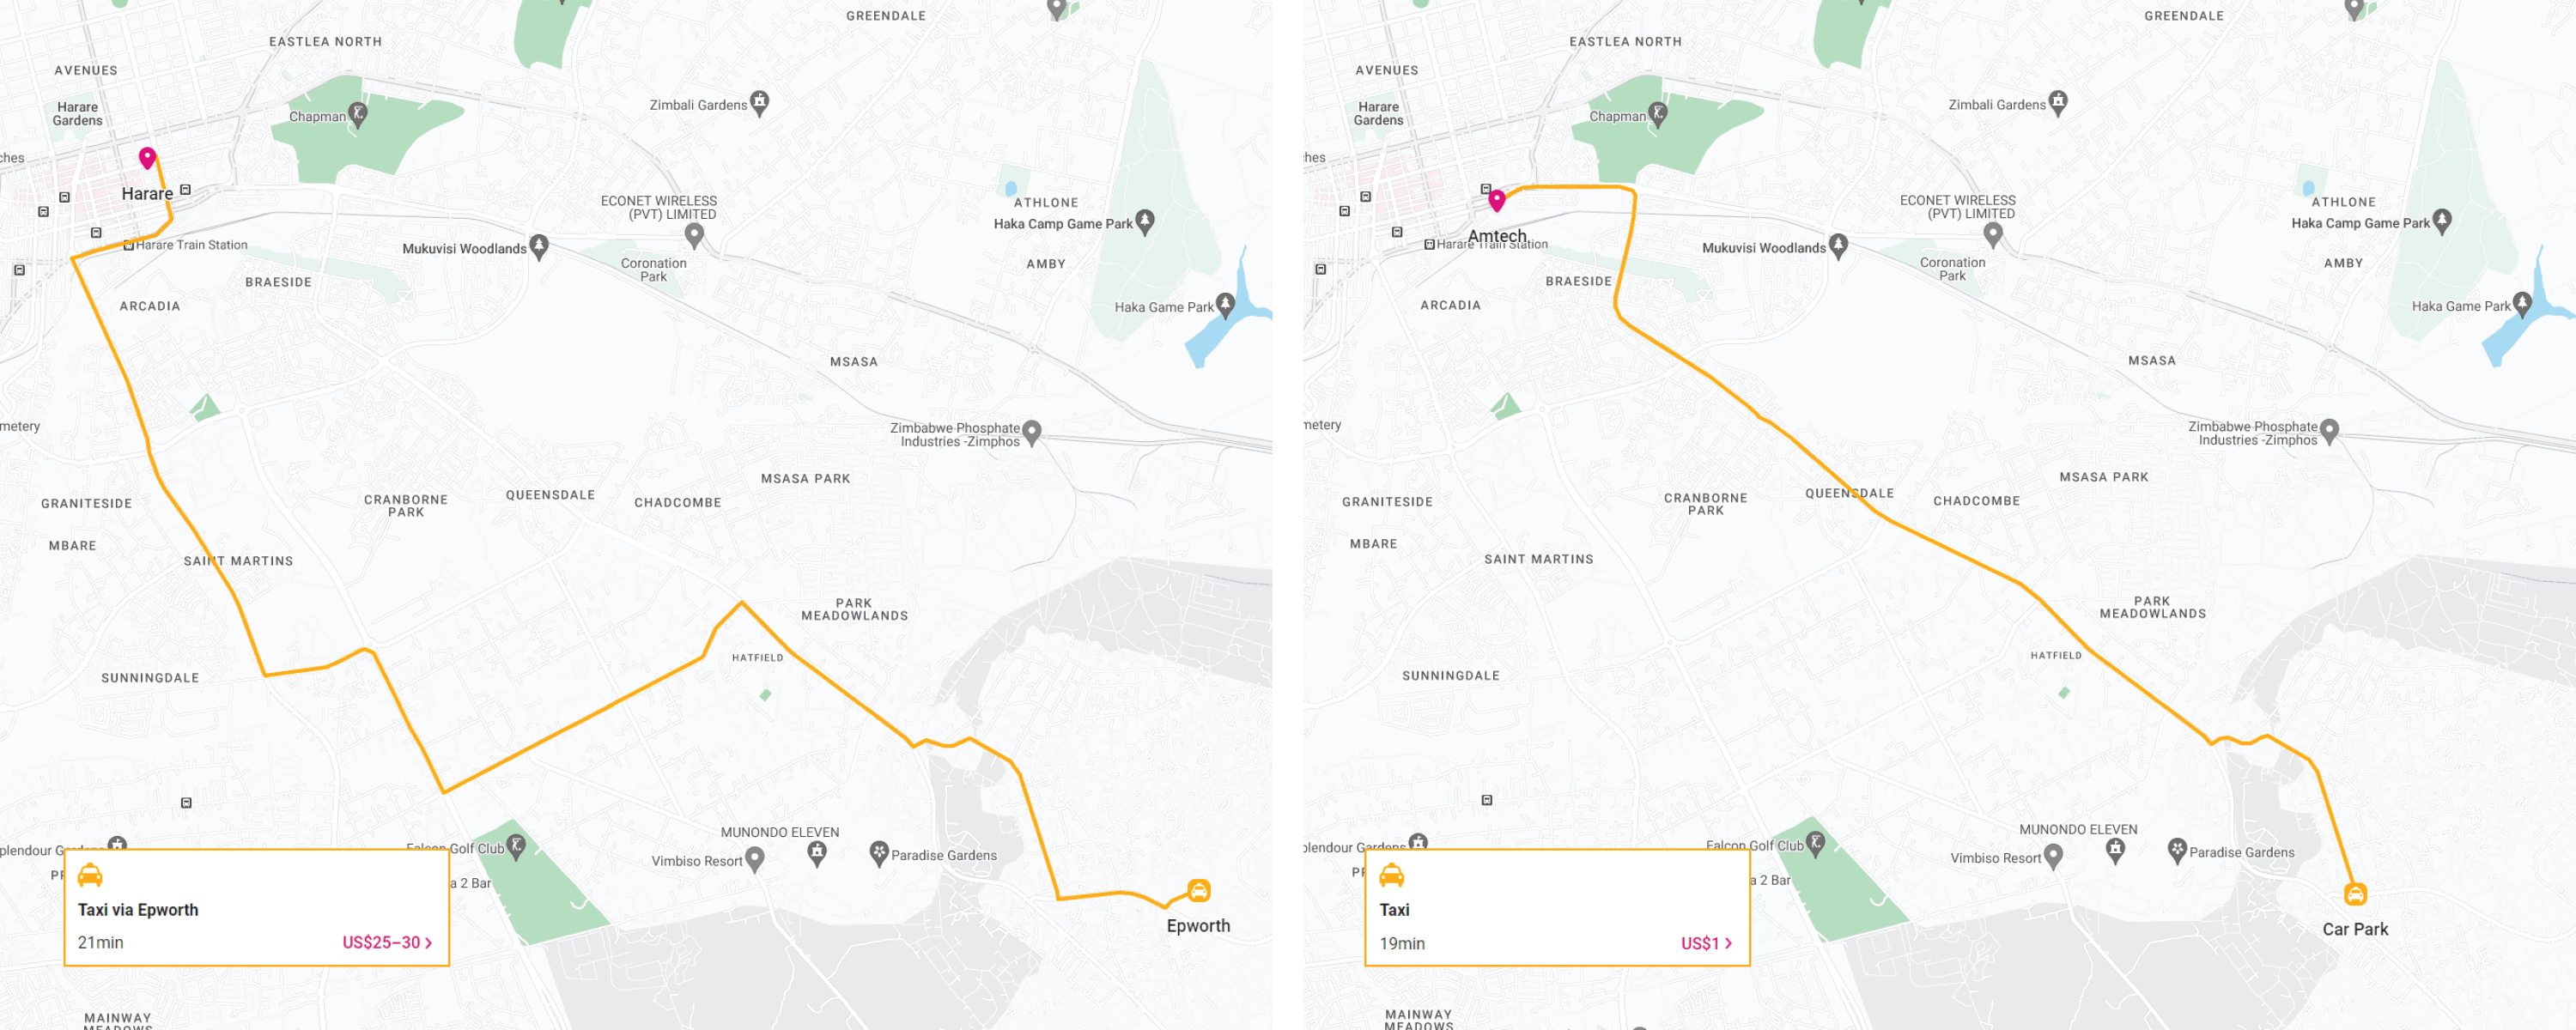
Image source: Rome2Rio website.
When traveling from Epworth to Harare, the informal bus, also known as a “taxi,” costs only 1 dollar, while the official taxi, shown as “taxi via Epworth,” costs significantly more, ranging from 25 to 30 dollars. However, one disadvantage of taking the informal bus is that it stops on the outskirts of the town, requiring passengers to walk a considerable distance before they can reach the minibus stop, while the official taxi goes directly into the town. This pattern is consistent across several towns selected as case studies in this project.

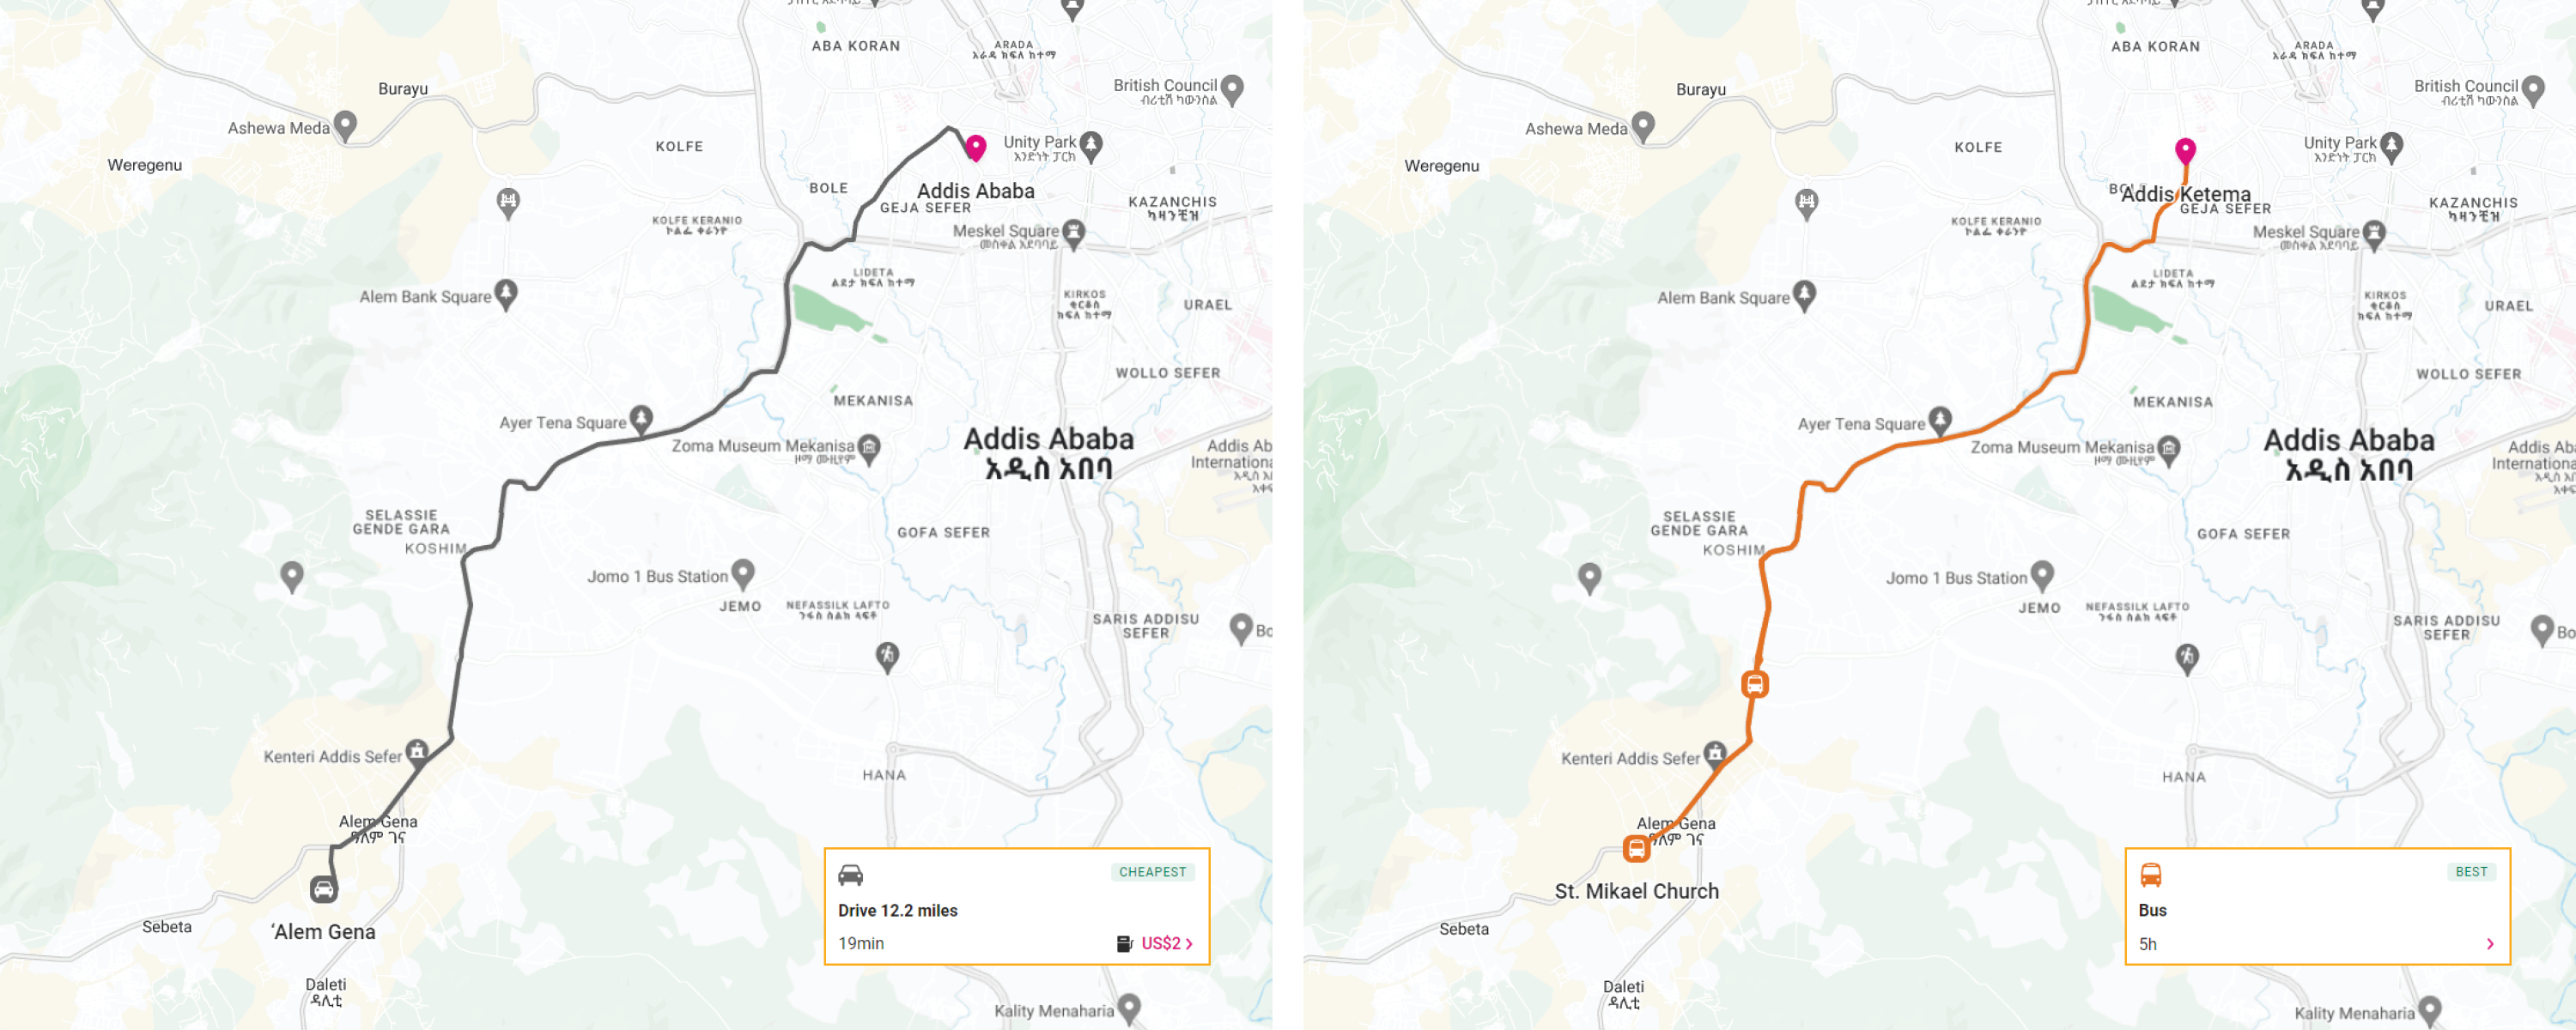
Image source: Rome2Rio website.
The travel time from Alem Gena to Addis Ababa is significantly shorter by car, taking only 19 minutes, compared to a bus journey that takes 5 hours.

Informal Transit Conditions
The inadequacy of formal transportation systems has resulted in informal buses becoming a crucial means of infrastructure in fulfilling the transportation demands of the rapidly expanding population in and around capital cities in the selected case studies. While there is no standardized terminology, informal buses share certain characteristics, commonly manifesting as aging vans that surpass their capacity while traversing urban areas. Most selected case studies demonstrate significant reliance on these informal buses for daily commuting. In Accra, for example, 70% of daily commuting is carried out by 6,000 informal minibuses called “Trotros” (Kuuire, 2022; World Bank, 2011). Likewise, in Addis Ababa, minibus taxis constitute 73% of the total modal choice of the city (World Bank 2002). In Cairo, 52.3% of public transport vehicle trips per day are executed by informal microbuses (Statista 2016). Similarly, nearly six in ten residents in Nairobi use public service vehicles, commonly referred to as “Matatus,” for commuting to their workplaces (Cheruiyot 2023).

Image made by Alan Ren, Candice Siyun Ji, Kelly Shining Hong, Wei Xiao

Project Limitations & Call for Further Research
This study offers a glimpse into the built environment and transportation conditions in areas with urban clusters lacking infrastructural light and reliant on informal buses. While the methodology and findings provide an initial basis for further research, the limitations of this project suggest several directions for future investigation.

Distanced Perspective
While the utilization of a distanced perspective has facilitated research spanning several cities, it has also engendered constraints in analyzing data at finer levels of granularity. For example, this project employs identical filtering thresholds for nighttime light, population data, and earth tone color range for all selected case study areas, which presents both advantages and limitations. While the consistent thresholds enable the identification of urban clusters and comparison of different cities at a continental level, they may lead to a loss of granularity in city characteristics. As an illustration, this study classified Kibera, an area in Nairobi lacking fundamental infrastructure, as “well-lighted.” Future research could incorporate varying filtering thresholds to reflect cities’ unique demographics and conditions, providing a more precise representation of urban patterns and findings.
This limitation also underscores the necessity of field research and interdisciplinary collaboration to comprehend the different soil, vegetation, and urban fabric conditions manifested in the satellite imagery, enabling a more accurate depiction of built environment conditions. Machine learning techniques such as material detection and deep learning-based computer vision techniques of street views could also offer more granular information about building typologies and dirt road conditions in areas where the majority live and travel in the dark. Additionally, further research should integrate longitudinal investigation and qualitative research to understand better the infrastructure’s present state and how it evolved in these under-researched areas.

Data Availability
This impact is exemplified in the case study selection of this project. Certain countries lack accessible datasets for specific variables, such as informal bus routes maps and population data, which constrains the project’s scope and selection of case studies. Furthermore, the limited availability of qualitative data in selected towns and cities in Africa emphasizes the need to gather more firsthand qualitative data in under-studied areas to gain a more comprehensive comprehension of population characteristics and infrastructure in these regions and to build a more robust evidence base for decision-making.
Overall, this study underscores the critical need for further research and data collection to enhance our understanding of these intricate urban environments that have been historically under-studied. It is imperative for both researchers and governmental organizations to collaborate in gathering and analyzing qualitative and quantitative data to provide a more comprehensive evidence base for policy-making and urban planning in these areas.

Conclusion
“Invisibility is certainly one aspect of infrastructure, but it is only one and at the extreme edge of a range of visibilities that move from unseen to grand spectacles and everything in between.”
– The Politics and Poetics of Infrastructure (Larkin 2013, 336)
This project is a tapestry woven with threads of discovery, striving to reveal the hidden stories that lay beyond the surface of existing datasets. While the nightlight satellite imagery taken at 1 am may typically reflect population density and economic activity, it often overshadows the realities of those who are excluded from basic amenities–those who live and travel in the dark. By layering this imagery with global gridded population density, informal bus routes, and building footprints in five African cities and their surroundings, we witness the tenacious, mobile, and adaptive spirit of humanity, and shed light on the stories of lives and the inequitable access to fundamental resources in these areas. This project aims to empower new voices, provoke new research, and catalyze action toward designing and developing cities that provide equitable access to infrastructure for all.

Bibliography
Literature
Atwood, Atwood. 2016. “Zimbabwe’s Unstable Infrastructure.” Sphere Journal for Digital Cultures #3 Unstable Infrastructures (June). https://spheres-journal.org/contribution/zimbabwes-unstable-infrastructure/.
“Case Study: Accra,Ghana.” 2011. World Bank. Accessed April 30, 2023. https://www.ssatp.org/sites/ssatp/files/publications/Toolkits/ITS%20Toolkit%20content/case-studies/accra-ghana.html.
Cheruiyot, Kevin. 2023. “Eight out of 10 Nairobians Walk or Use Matatus to Work: Report.” Nation. February 17, 2023. https://nation.africa/kenya/counties/nairobi/eight-out-of-10-nairobians-walk-or-use-matatus-to-work-report-4127672.
Diller Scofidio + Renfro, Laura Kurgan, Robert Gerard Pietrusko. 2018. Center for Spatial Research. In Plain Sight. Video, 12:24. https://vimeo.com/290575503.
“Distribution of public transport vehicle trips per day in Cairo, Egypt in 2012, by type”. 2016. Statista. April 15, 2016. https://www.statista.com/statistics/725259/cairo-share-of-public-transport-vehicles-usage-per-day-by-type/#:~:text=The%20public%20transport%20trips%20made,of%20daily%20public%20transport%20trips.
Elvidge, Christopher D., Jeffrey Safran, Benjamin Tuttle, Paul Sutton, Pierantonio Cinzano, Donald Pettit, John Arvesen, and Christopher Small. 2007. “Potential for Global Mapping of Development via a Nightsat Mission.” GeoJournal 69 (1/2): 45–53.
Foster, Hugo, and Lechler Marie. 2022. “How Nighttime Lights Illuminate Economic Activity.” S&P Global (blog). November 7, 2022. https://www.spglobal.com/marketintelligence/en/mi/research-analysis/how-nighttime-lights-illuminate-economic-activity.html.
Klopp, Jacqueline, Sarah Williams, Peter Waiganjo, Dan Orwa, and Adam White. 2015. “DIGITAL MATATUS.” 2015. Civic Data Design Lab, Massachusetts Institute of Technology. School of Computing and Informatics, University of Nairobi. http://digitalmatatus.com/.
Kuuire, Joseph-Albert. 2023. “The Sad State of Public Transportation in Accra.” Tech Nova. March 3, 2022. https://technovagh.com/the-sad-state-of-public-transportation-in-accra/.
Larkin, Brian. 2013. “The Politics and Poetics of Infrastructure.” Annual Review of Anthropology 42 (1): 327–43. https://doi.org/10.1146/annurev-anthro-092412-155522.
Liu, Haoyu, Xianwen He, Yanbing Bai, Xing Liu, Yilin Wu, Yanyun Zhao, and Hanfang Yang. 2021. “Nightlight as a Proxy of Economic Indicators: Fine-Grained GDP Inference around Chinese Mainland via Attention-Augmented CNN from Daytime Satellite Imagery.” Remote Sensing 13 (11): 2067. https://doi.org/10.3390/rs13112067.
Ndlovu, Ray, and Archana Narayanan. 2023. “Zimbabwe Plans a New City for the Rich.” Bloomberg.Com, January 26, 2023. https://www.bloomberg.com/news/features/2023-01-26/zimbabwe-plans-a-new-city-for-the-rich-as-harare-decays.
Simone, A. M. (Abdou Maliqalim). “People as Infrastructure: Intersecting Fragments in Johannesburg.” Public Culture 16, no. 3 (2004): 407-429. muse.jhu.edu/article/173743.
World Bank. 2002. Scoping Study : Urban Mobility in Three Cities–Addis Ababa, Dar es Salaam, and Nairobi. Sub-Saharan Africa Transport Policy Program working paper series; no. SSATP 70. © Washington, DC. http://hdl.handle.net/10986/17691 License: CC BY 3.0 IGO.
Zhao, Min, Yuyu Zhou, Xuecao Li, Wenting Cao, Chunyang He, Bailang Yu, Xi Li, Christopher D. Elvidge, Weiming Cheng, and Chenghu Zhou. 2019. “Applications of Satellite Remote Sensing of Nighttime Light Observations: Advances, Challenges, and Perspectives.” Remote Sensing 11 (17): 1971. https://doi.org/10.3390/rs11171971.

Datasets
Worldwide Datasets
C. D. Elvidge, M. Zhizhin, T. Ghosh, F-C. Hsu, “Annual time series of global VIIRS nighttime lights derived from monthly averages: 2012 to 2019”, Remote Sensing (In press). Accessed April 29, 2023. Retrieved from https://eogdata.mines.edu/products/vnl/
Center for International Earth Science Information Network - CIESIN - Columbia University. 2020. Gridded Population of the World, Version 4 (GPWv4): Population Density Adjusted to Match 2015 Revision UN WPP Country Totals, Revision 11. Palisades, New York: NASA Socioeconomic Data and Applications Center (SEDAC). Retrieved from https://doi.org/10.7927/H4F47M65. https://sedac.ciesin.columbia.edu/data/collection/gpw-v4
Microsoft. “GlobalMLBuildingFootprints.” GitHub. Accessed April 29, 2023. Retrieved from https://github.com/microsoft/GlobalMLBuildingFootprints/
Google. “Open Buildings.” Accessed April 29, 2023. Retrieved from https://sites.research.google/open-buildings/#download.
Datum. “Mapeo Digital de Transporte Publico: Casos de Estudio.” Accessed April 29, 2023. Retrieved from https://datum.la/mapeo-digital-de-transporte-publico-casos-de-estudio.
U.S. Geological Survey, “Landsat-8 Image”. Accessed April 29, 2023. Retrieved from https://www.usgs.gov/landsat-missions/landsat-data-access
City/Town Specific Datasets
Accra: Angel, Shlomo. Parent, Jason. Civco, Daniel L.. Blei, Alejandro M. (2012). Administrative Boundaries, Accra, Ghana, 1990. [Shapefile]. Lincoln Institute of Land Policy. Retrieved from https://earthworks.stanford.edu/catalog/stanford-sh681sw5018
The Humanitarian Data Exchange, OCHA Regional Office for West and Central Africa (ROWCA), “Ghana - Subnational Administrative Boundaries.” Accessed April 29, 2023. Retrieved from https://data.humdata.org/dataset/cod-ab-gha
Addis Ababa: The Humanitarian Data Exchange, OCHA Regional Office for West and Central Africa (ROWCA), “Ethiopia - Subnational Administrative Boundaries.” Accessed April 29, 2023. Retrieved from https://data.humdata.org/dataset/cod-ab-eth
Cairo: The Humanitarian Data Exchange, OCHA Regional Office for West and Central Africa (ROWCA), “Egypt - Subnational Administrative Boundaries.” Accessed April 29, 2023. Retrieved from https://data.humdata.org/dataset/cod-ab-egy
Harare: The Humanitarian Data Exchange, OCHA Regional Office for West and Central Africa (ROWCA), “Zimbabwe - Subnational Administrative Boundaries.” Accessed April 29, 2023. Retrieved from https://data.humdata.org/dataset/cod-ab-zwe
Nairobi: Code for Kenya, “Kenya Counties Shapefile.” Created October 21, 2015. Accessed April 29, 2023. https://africaopendata.org/dataset/kenya-counties-shapefile. UN Humanitarian Data Exchange, “Kenya Sub Counties.” Created October 21, 2015. Accessed April 29, 2023. Retrieved from https://data.amerigeoss.org/dataset/kenya-sub-counties

Figures
Accra, Ghana: Trotro. lucianf. “lfip_090828_0461.” August 28, 2009. Flickr. Accessed April 30, 2023. https://www.flickr.com/photos/lucianf/4669380925.
Addis Ababa, Ethiopia: Minibus Taxi. Kilpatrick, Ryan. “Minibus taxi in Addis.” December 18, 2011. Flickr. Accessed April 30, 2023. https://www.flickr.com/photos/rkilpatrick21/6530701729.
Cairo, Egypt: Microbus. Johnson, Robert. “Getting off the micro bus.” April 4, 2013. Business Insider. Accessed April 30, 2023. https://www.businessinsider.com/the-cairo-micro-bus-hand-signals-2013-4.
Harare, Zimbabwe: Mushikashika (Pirate Taxis). Buwerimwe, Sharon. “Pirate taxis in the CBD also known as Mushikashika.” March 28, 2023. NewsDay Zimbabwe. Accessed April 30, 2023. https://www.newsday.co.zw/local-news/article/200009401/police-intensify-crackdown-on-pirate-taxis.
Nairobi, Keyna: Matatus. Kavanagh, Jack. “Catching a matatu in Nairobi, Kenya.” December 19, 2018. UN environment programme. Accessed April 30, 2023. https://www.unep.org/news-and-stories/story/nairobi-matatus-odd-engine-idling-culture-pollutes-harms-health.
