At the Fault Lines: Developing an Alternative Earthquake Risk Assessment Method for Istanbul's Building Stock
INTRODUCTION
On February 6, 2023, two consecutive earthquakes of Magnitudes 7.8 and 7.7 struck Southern Turkey and Northern Syria, killing more than 52,000 people. Namely the Kahramanmaras Earthquake is the largest since the 1939 Erzincan Earthquake with the same magnitude, and the second largest that’s ever recorded in the region. Affecting 14 million people and leaving 1.5 million people homeless across 21 provinces, it is now accepted as the deadliest natural disaster in the history of the country.
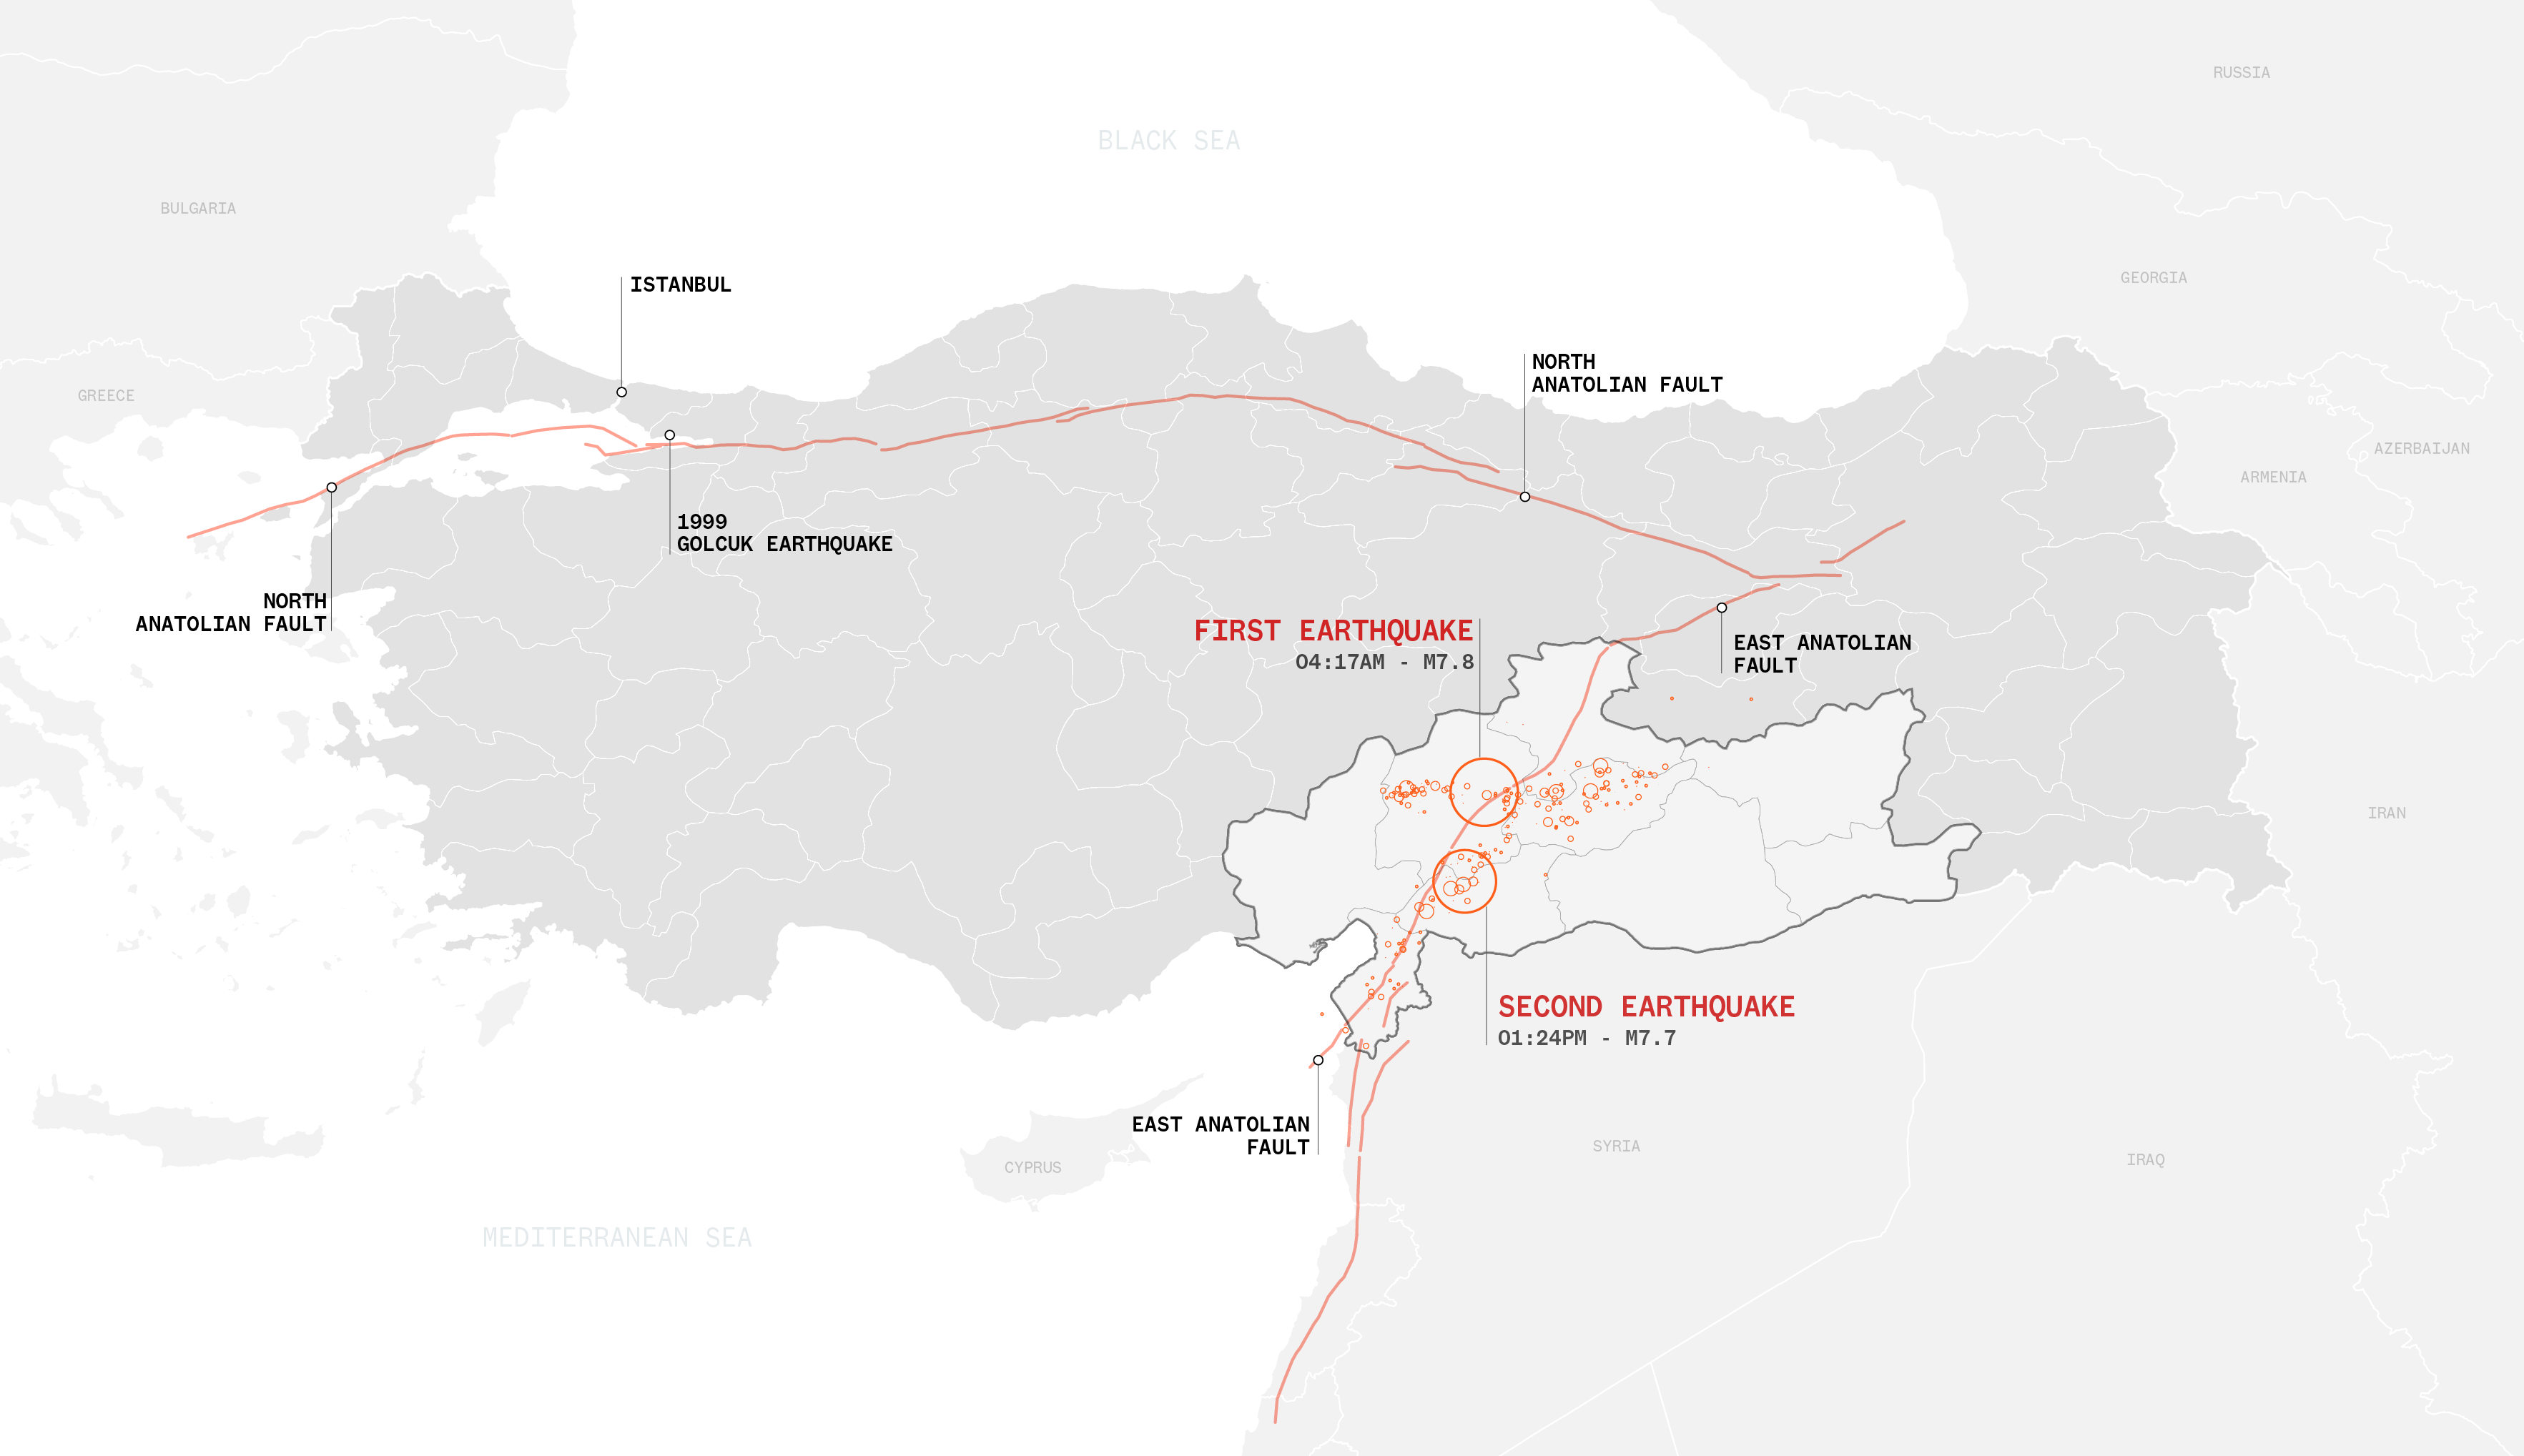 Map of the February 6 Earthquake by Taha Erdem Ozturk. Source: United States Geological Survey Earthquake Hazards Program, showing all recorded earthquake entries between 2:00 a.m., Feb. 6 and 2:00 a.m., Feb. 7 GMT+03:00.
Yet, Turkey is no stranger to such catastrophic earthquakes, as the country geographically sits on top two major fault zones - the North Anatolian fault zone being one of the most seismically active in the World. 20 years ago when a similarly destructive earthquake struck near Istanbul, the country’s economic and population center, it was a wake up call for the country: The government changed shortly after being deemed “incompetent,” much stricter building codes and regulations were put in place, nation-wide first response organizations were founded, and a new “earthquake tax” was introduced to help fund urban renewal and recovery efforts. The recent earthquakes exposed that many of these efforts have been immensely inadequate, mostly due to large-scale corrupt political, regulatory, and construction practices throughout the 20-year AKP rule. Moreover, the country’s most prominent scientists have been incessantly alarming against a long-awaited “Istanbul Earthquake” to strike in the next decade, with consequences exponentially graver.
This study aims to dissect these corrupt practices, identify their traces in the architectural level across an urban scale, and develop an alternative risk assessment mapping method that may offer critical insight for local authorities, municipalities, as well as individuals. Recent developments in interctive mapping techniques, artificial intelligence and machine learning have allowed large urban-scale risk assessment models to be implemented in order to detect possible structural defects before any failure or collapse. In this article, we will explain the structural malpractices that led to such destruction in the area, and will propose an automated, faster, and more scalable alternative “risk assessment method” that could be used to create an earthquake risk map of the bustling metropolis of Istanbul that is home to 16 million people.
A TALE OF THREE EARTHQUAKES: PAST, PRESENT, AND FUTURE
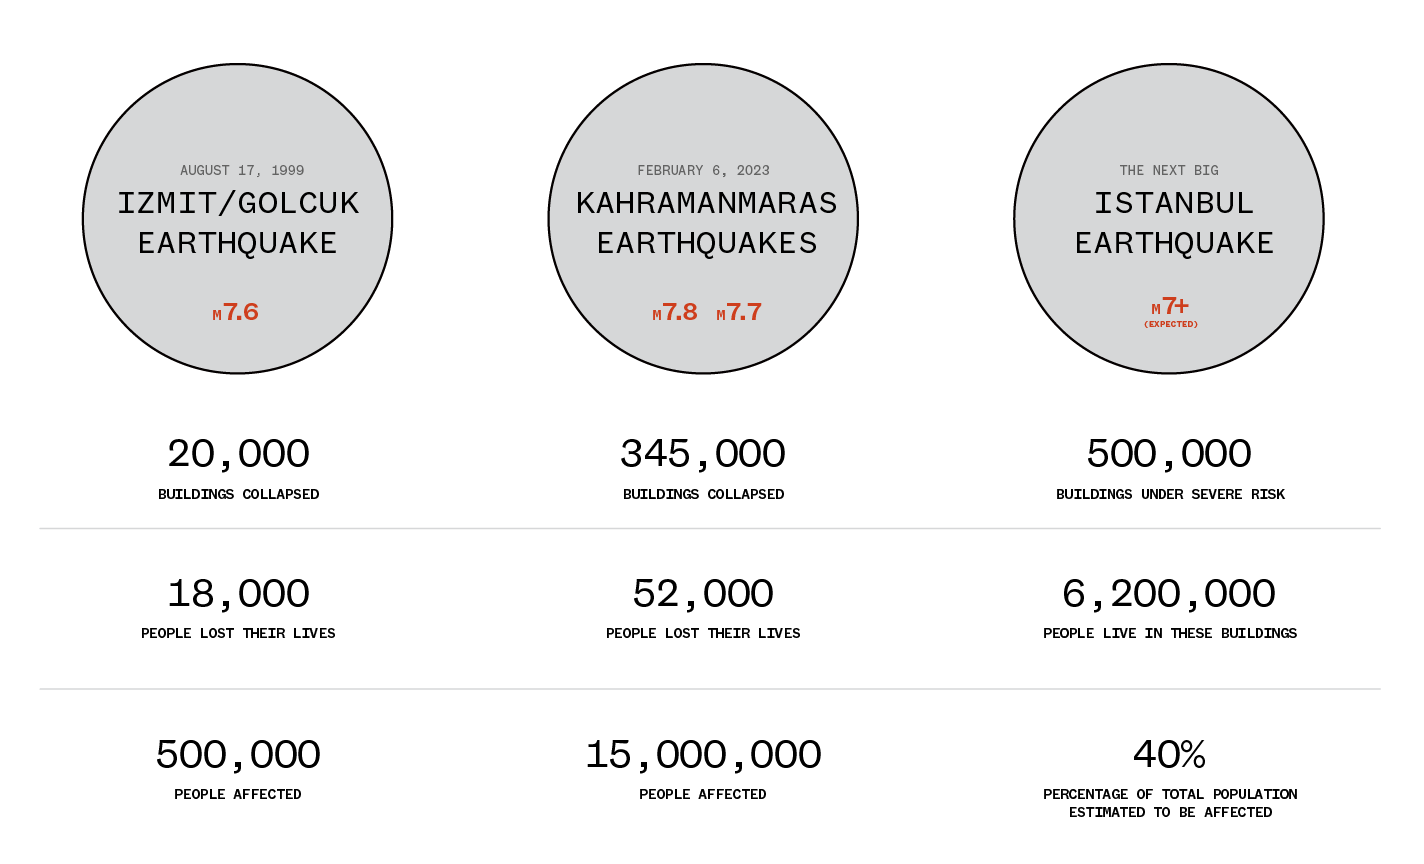
The 1999 Golcuk Earthquake, happened near Istanbul, was a wake-up call for the country. The quake was the considered to be the most devastating to that day, with a death toll of more than 18,000 people. More than 20,000 buildings collapsed, and nearly half a million people lost their homes. It happened to be the “wake-up call” for the young republic, as it exposed how vulnerable the country’s building stock and infrastructure was. The earthquake damaged many crucial access infrastructure and essential means of communication, preventing any sort of help to reach the earthquake zone. Furthermore, the 1999 Quake has also shown that the government did not have any disaster relief funds or a specially-trained nationwide emergency first response team, which led to many thinking that “the state has left them on their own.”
The quake has led to a big wave of changes in the country: Government changed shortly after and the still-governing AKP rose to power in 2002 with Recep Tayyip Erdogan, back then the very popular and highly-acclaimed Mayor of Istanbul, promising drastic changes. The newly appointed AKP government has made newly-introduced “Earthquake Tax” permanent, has launched AFAD - the country’s first nationwide disaster response organization, supported a new, strict building code and regulations, and introduced large-scale and nationwide urban renewal programs.
The February 6 Earthquakes happened just over 20 years after the start of the bi-decadal AKP rule. With more than 21 provinces affected, 52,000 people lost their lives, and 345,000 buildings collapsed, it is now the deadliest natural disaster the country has ever faced with. It would not be unrealistic to say that a familiar sentiment is shared among many today, that despite all the mega-projects and well-advertised urban renewal projects, the people still feel let down by their state. President Erdogan, once came to power with high-promises of rebuilding a much stronger and resilient nation, has denied accountability of the dire aftermath by defining the earthquake to be a divine catastrophe that no one cold have prepared for.
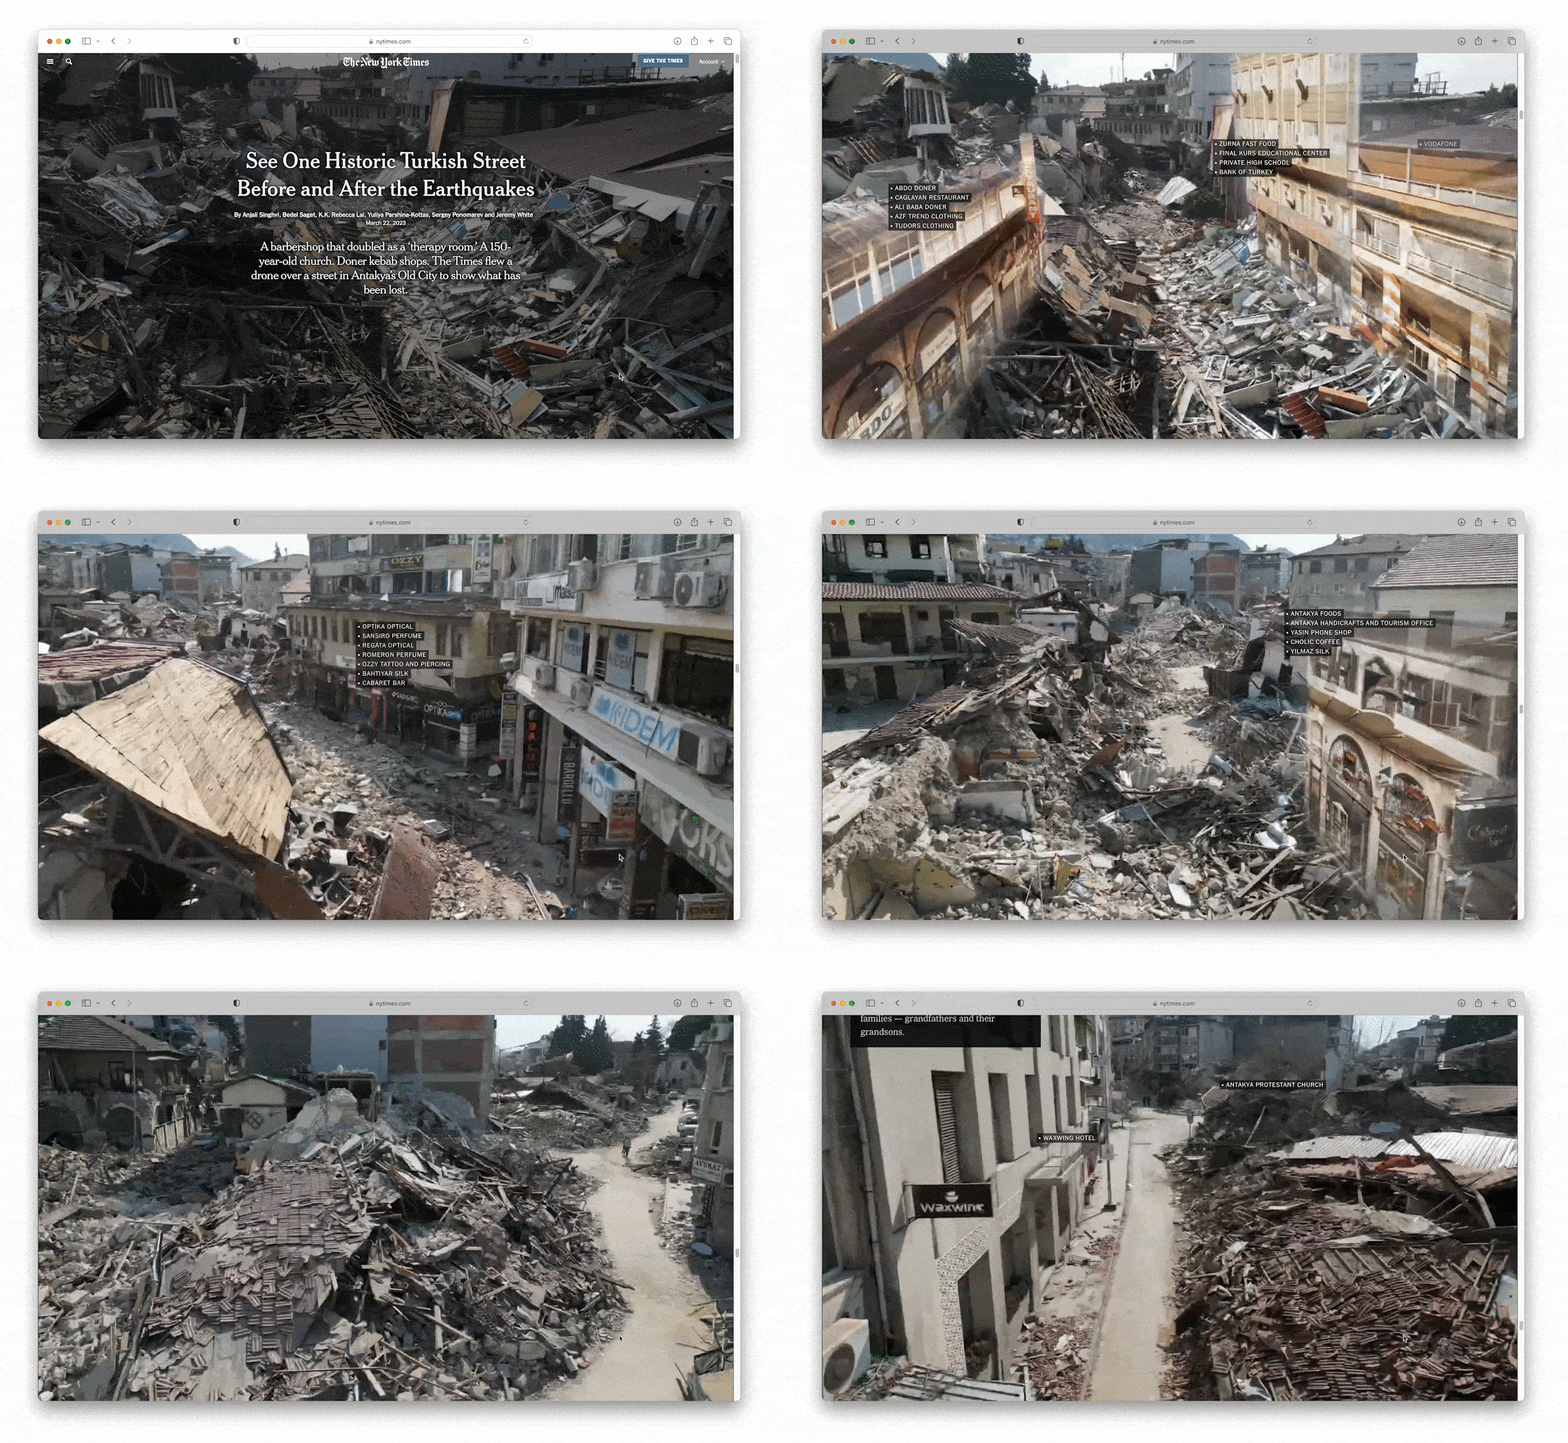 Singhi, Anjali et al. An interactive aerial mapping of the historical downtown area of Antakya, Turkey after the earthquake showing the severity of destruction. Read the New York Times article here: https://www.nytimes.com/interactive/2023/03/22/world/middleeast/turkey-earthquake-antakya.html
Although the region was struck by many frequent shakes of very high-magnitudes, many scientists believe that the death toll would not be as high today if the contractors followed the building codes, and local authorities ensured their compliance through strict control practices. Even the most recently developed apartment buildings, some of which proudly advertised to be compliant to the highest earthquake regulations, were completely flattened in a matter of seconds. Many opposing figures point out to the ever-increasing levels of corruption in the construction and real estate industry, which has been one of the few ones that has benefitted significantly from AKP’s long-reign. Pro-government groups and developers enjoyed much more “relaxed” regulatory enforcements and controls, with many routinely “cutting corners” to maximize profits. Idris Bedirhanoglu, a civil engineering professor in Dicle University explains this to the New York Times as: “The contractors might skimp on cement or substitute smooth river stones for commercially made crushed gravel, making for a weaker aggregate. A builder might put in thinner rebar.”
As the country still grieves for such tremendous loss of life in the South, the possibility of a long-predicted “next big earthquake” in the northwest end of the region has became even more imminent: For a long while many geologists have been alarming the authorities to take action against an Upcoming Istanbul Earthquake that’s predicted to happen in the next 5-10 years as the North Anatolian Fault is known to have reached the end of its current seismic period. Scientist predict that nearly 40% of the population, or more than six million people, might be under life-threatening risk conditions in a scenario of a Magnitude 7.5 earthquake. This situation has been further brought into light by the current mayor of the city, Ekrem Imamoglu, during a television program in February 15, 2023:
When we took over the job (of mayorship of the megacity), the records of the previous management mentioned 40,000-50,000 risky structures. In the work we have conducted, we are estimating that there are as of now 90,000 structures that are severely damaged, i.e. have a risk of collapsing. Among them are workplaces and houses. We are aware that we have to move very fast (in terms of renewing the structures)
-Ekrem Imamoglu, Mayor of istanbul
The aftermath of the recent quakes has alarmed Istanbul Metropolitan Municipality, which has launched various action plans to ensure the safety of the city’s existing building stock by conducting free on-site structural tests, expediting urban renewal projects, and offering financial support and temporary housing for those who live in risky buildings. However, the newly-elected mayor Ekrem Imamoglu states that the increased demand to structural tests and other programs have exhausted the city’s limits.
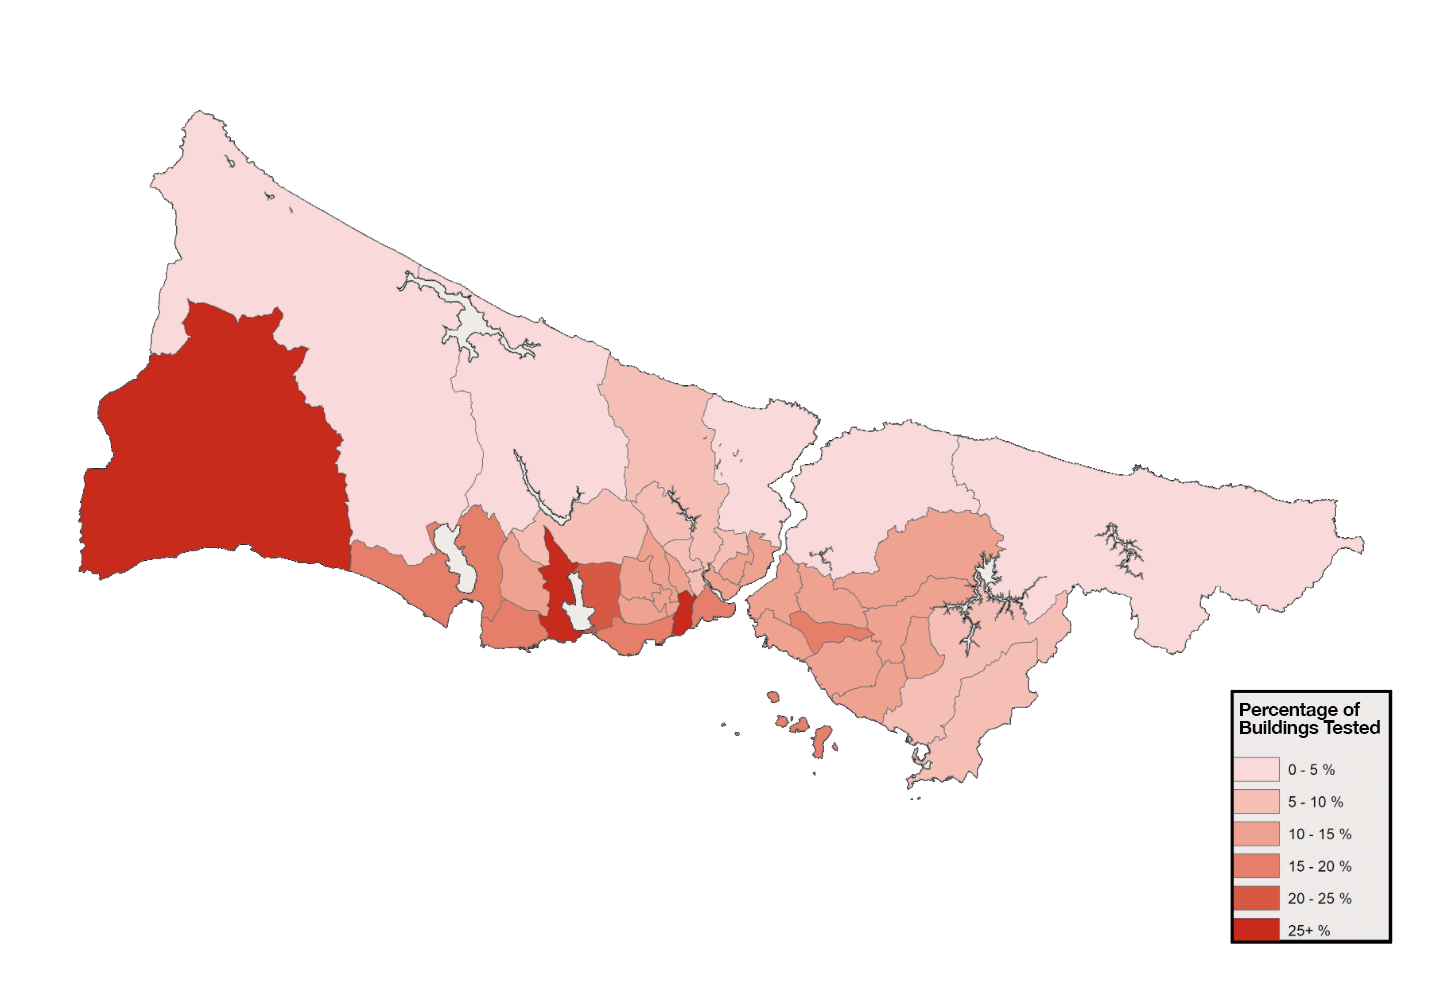 Map published by IMM Directorate of Earthquake and Ground Research
The above map shows that only a small percentage of the city have been able to be tested since 2019, pointing out to a need for an alternative, faster approach. Another significant challenge dates back to 1940s when the country encouraged rural-to-urban migration to solve the increasingly pressing working shortage as Istanbul became an important global production center. Due to the lack of resources and interest in expanding the city for planned low-income housing neighborhoods, the governments have allowed workers to build their own housing on various parts of the city. The term “gecekondu” (which literally means ‘built overnight’) is used today to define the present urban patches and neighborhoods that got swallowed by the fast-sprawling city.
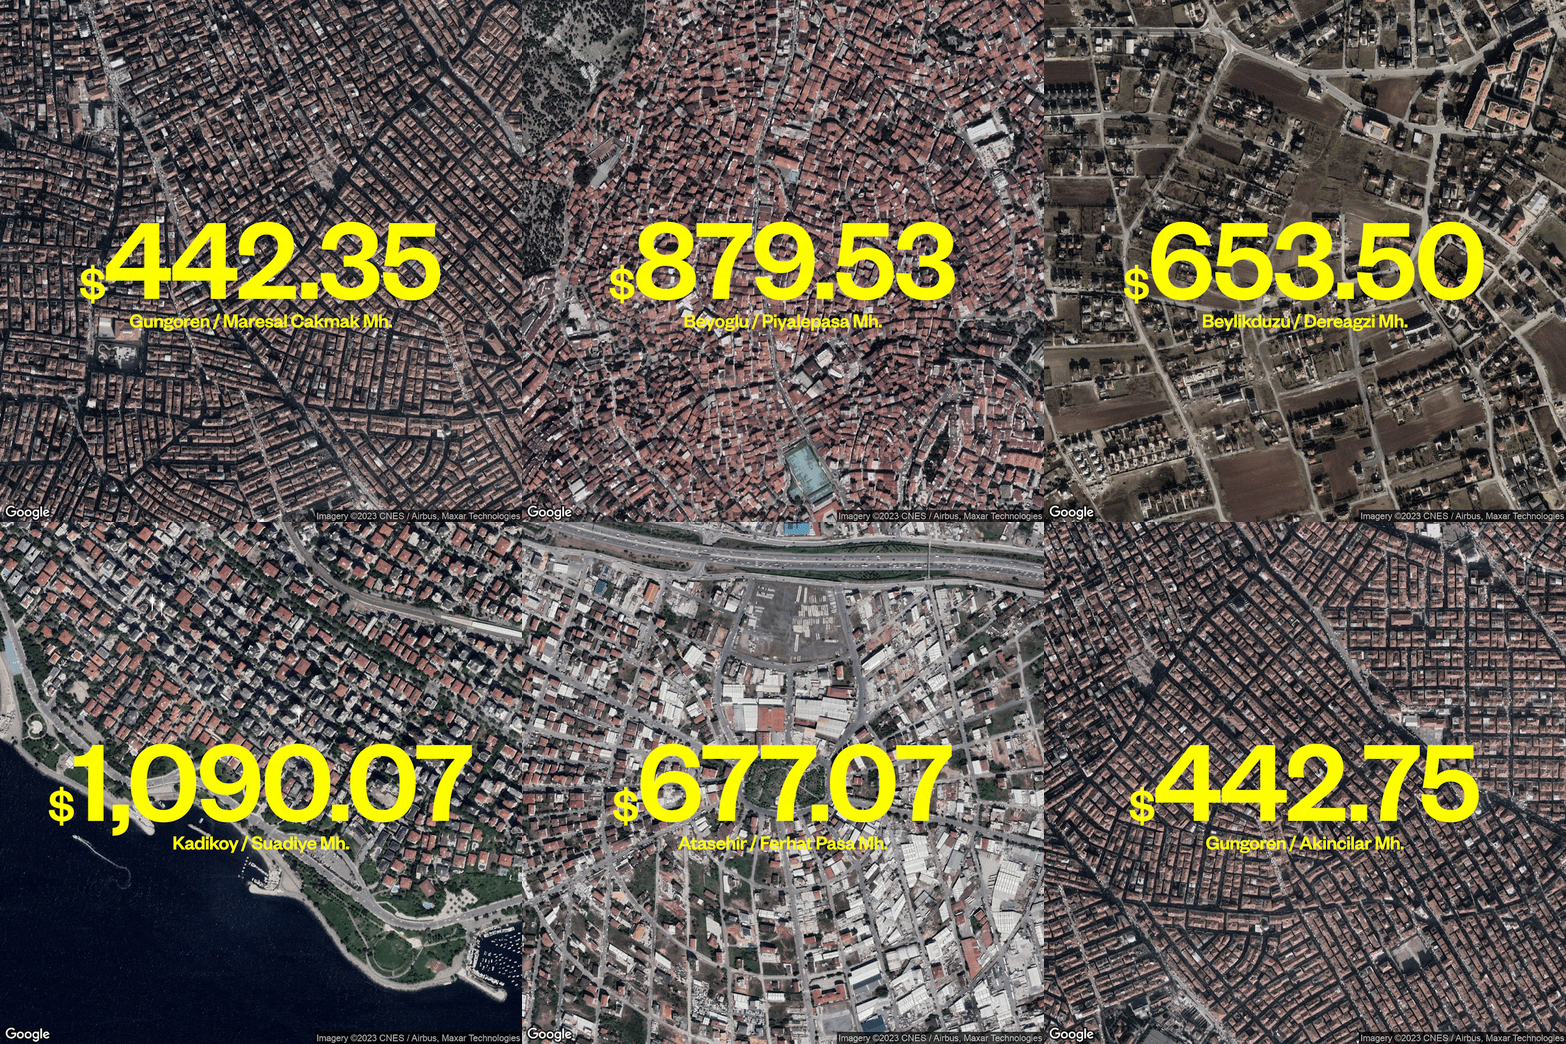 Satellite images retrieved by using Google Maps API. Real estate data is retrieved from Zingat.com
The above collection of satellite imagery aims to show the stark difference in the amount “open space” and average price of monthly rent in various neighborhoods across the city. As the income inequality increases, it also renders people living in “low-income” areas significantly more vulnerable against disasters such as the expected Istanbul Earthquake. Many planned “high-income” neighborhoods and the mentioned “gecekondu” areas are located side-to-side, often only separated by highways, hills, or high-rise buildings that are built as part of urban renewal programs. As pointed out by the mayor, most of AKP’s promised urban renewal projects took place in middle to higher income neighborhoods where developers could achieve higher profit margins. Hence any risk assessment project should point their focus to these often overlooked low-income neighborhoods, where people are comparatively more vulnerable and under higher risk.
PROPOSING A FASTER ALTERNATIVE RISK-ASSESSMENT METHOD
This project aims to propose an alternative risk-assessment and structural monitoring method that may offer valuable information and insight that could help alleviate the time and workload related challenges the traditional methods are faced with under high demand. This new alternative method employs crowdsourced data collection to generate a large pool of on-site data that may used towards making meaningful assumptions regarding a building’s risk factor. This crowdsourced data can further be used to train a surpervised multi-labeled Machine Learning model that could later automate this workflow to generate a city-wide risk assessment map through the existing Google StreetView database.
STEPS, QUESTIONS, AND CHALLENGES
-
Many building that have collapse in the previous earthquakes have proven to share common certain architectural/structural characteristics and malpractices, such as soft story buildings.
-
Given some of these characteristics could be visually identified without requiring a structural assessment, could we generate a large-enough crowdsourced dataset that could later be used to train computer vision and machine learning models that could further automate this workflow?
-
Although it may not be as accurate as traditional structural analysis practices, this method offers a fast and highly scalable alternative to map and visualize the earthquake-prone buildings in the city.
UNDERSTANDING THE “COLLAPSES”
Many videos and photos like the one above from the moment of collapse all hint at a common type of structural failure: First, the ground floor suddenly collapses, followed by all the floors above shortly after, pancaking on top of each other layer by layer in just a matter of seconds.

These “pancake collapses” are recognized as the primary cause of devastating consequences resulting from earthquakes in the region, such as the 1999 Golcuk earthquake, as reported by the infrastructure assessment team sent to the area. The factors leading to this phenomenon have been researched extensively and can be narrowed down to four primary construction/design shortcomings.
-
Soft Story Buildings
Soft story buildings are multiple story buildings that has a ground floor that has large windows, wide openings, and large open commercial shopfronts where a shear wall or vertical support element would typically be needed to ensure that the structural stability. Especially in earthquake-prone areas such as Turkey, at least 30% of the ground floor area must be dedicated to structural elements to ensure that the structural system could withstand the stress of the above floors. Soft story buildings are highly common in the region, with many multi-story apartment buildings accommodate commercial floor space on the ground floor, which is allowed by mixed-used zoning practices. The 1999 quake has led to an updated building code that prohibited such structures, many developers did not feel pressed to follow the regulations due to the lack of a strictly enforced control mechanism.

-
Excessive Cantilevering Above the Ground Floor
Another common practice is excessive cantilevering above the ground floor, as this allows developers to go beyond the site land usage limitations to maximize profits over extra square footage. Although cantilevering structures are a common practice in architectural design, combined with other malpractices such as soft story building designs, or using lower-quality building materials significantly increases the structural stress on the ground-level structural system. This may lead to a structural failure in the moment of an earthquake, even when the building may be able to withstand this load under normal conditions.
-
Structural Alterations
Structural alterations such as removing vertical supporting elements on the ground floor to open up space for commercial activities is another common practice many building owners employ to maximize profitability. Although there are multiple laws and regulations strictly prohibiting this, many buildings that has such alterations go unnoticed as it’s mostly done in the inside of the buildings.
-
Subpar/Prohibited Construction Materials
I am ‘coming from the kitchen’ in this business, as we say, meaning all my family, under my father, were also a part of this sector, the construction sector. I grew up working with him, witnessing all of the development at that time. I’m not in a position to regret what I’ve said. The fact is that 70 percent of all the settlements in Istanbul, I would say, are vulnerable to a major earthquake. This is a diagnosis. Without the proper diagnosis treating a patient is not possible. The construction materials used for various settlements in different parts of Istanbul used to be of poor quality. -Ali Agaoglu, Turkish Real Estate Mogul
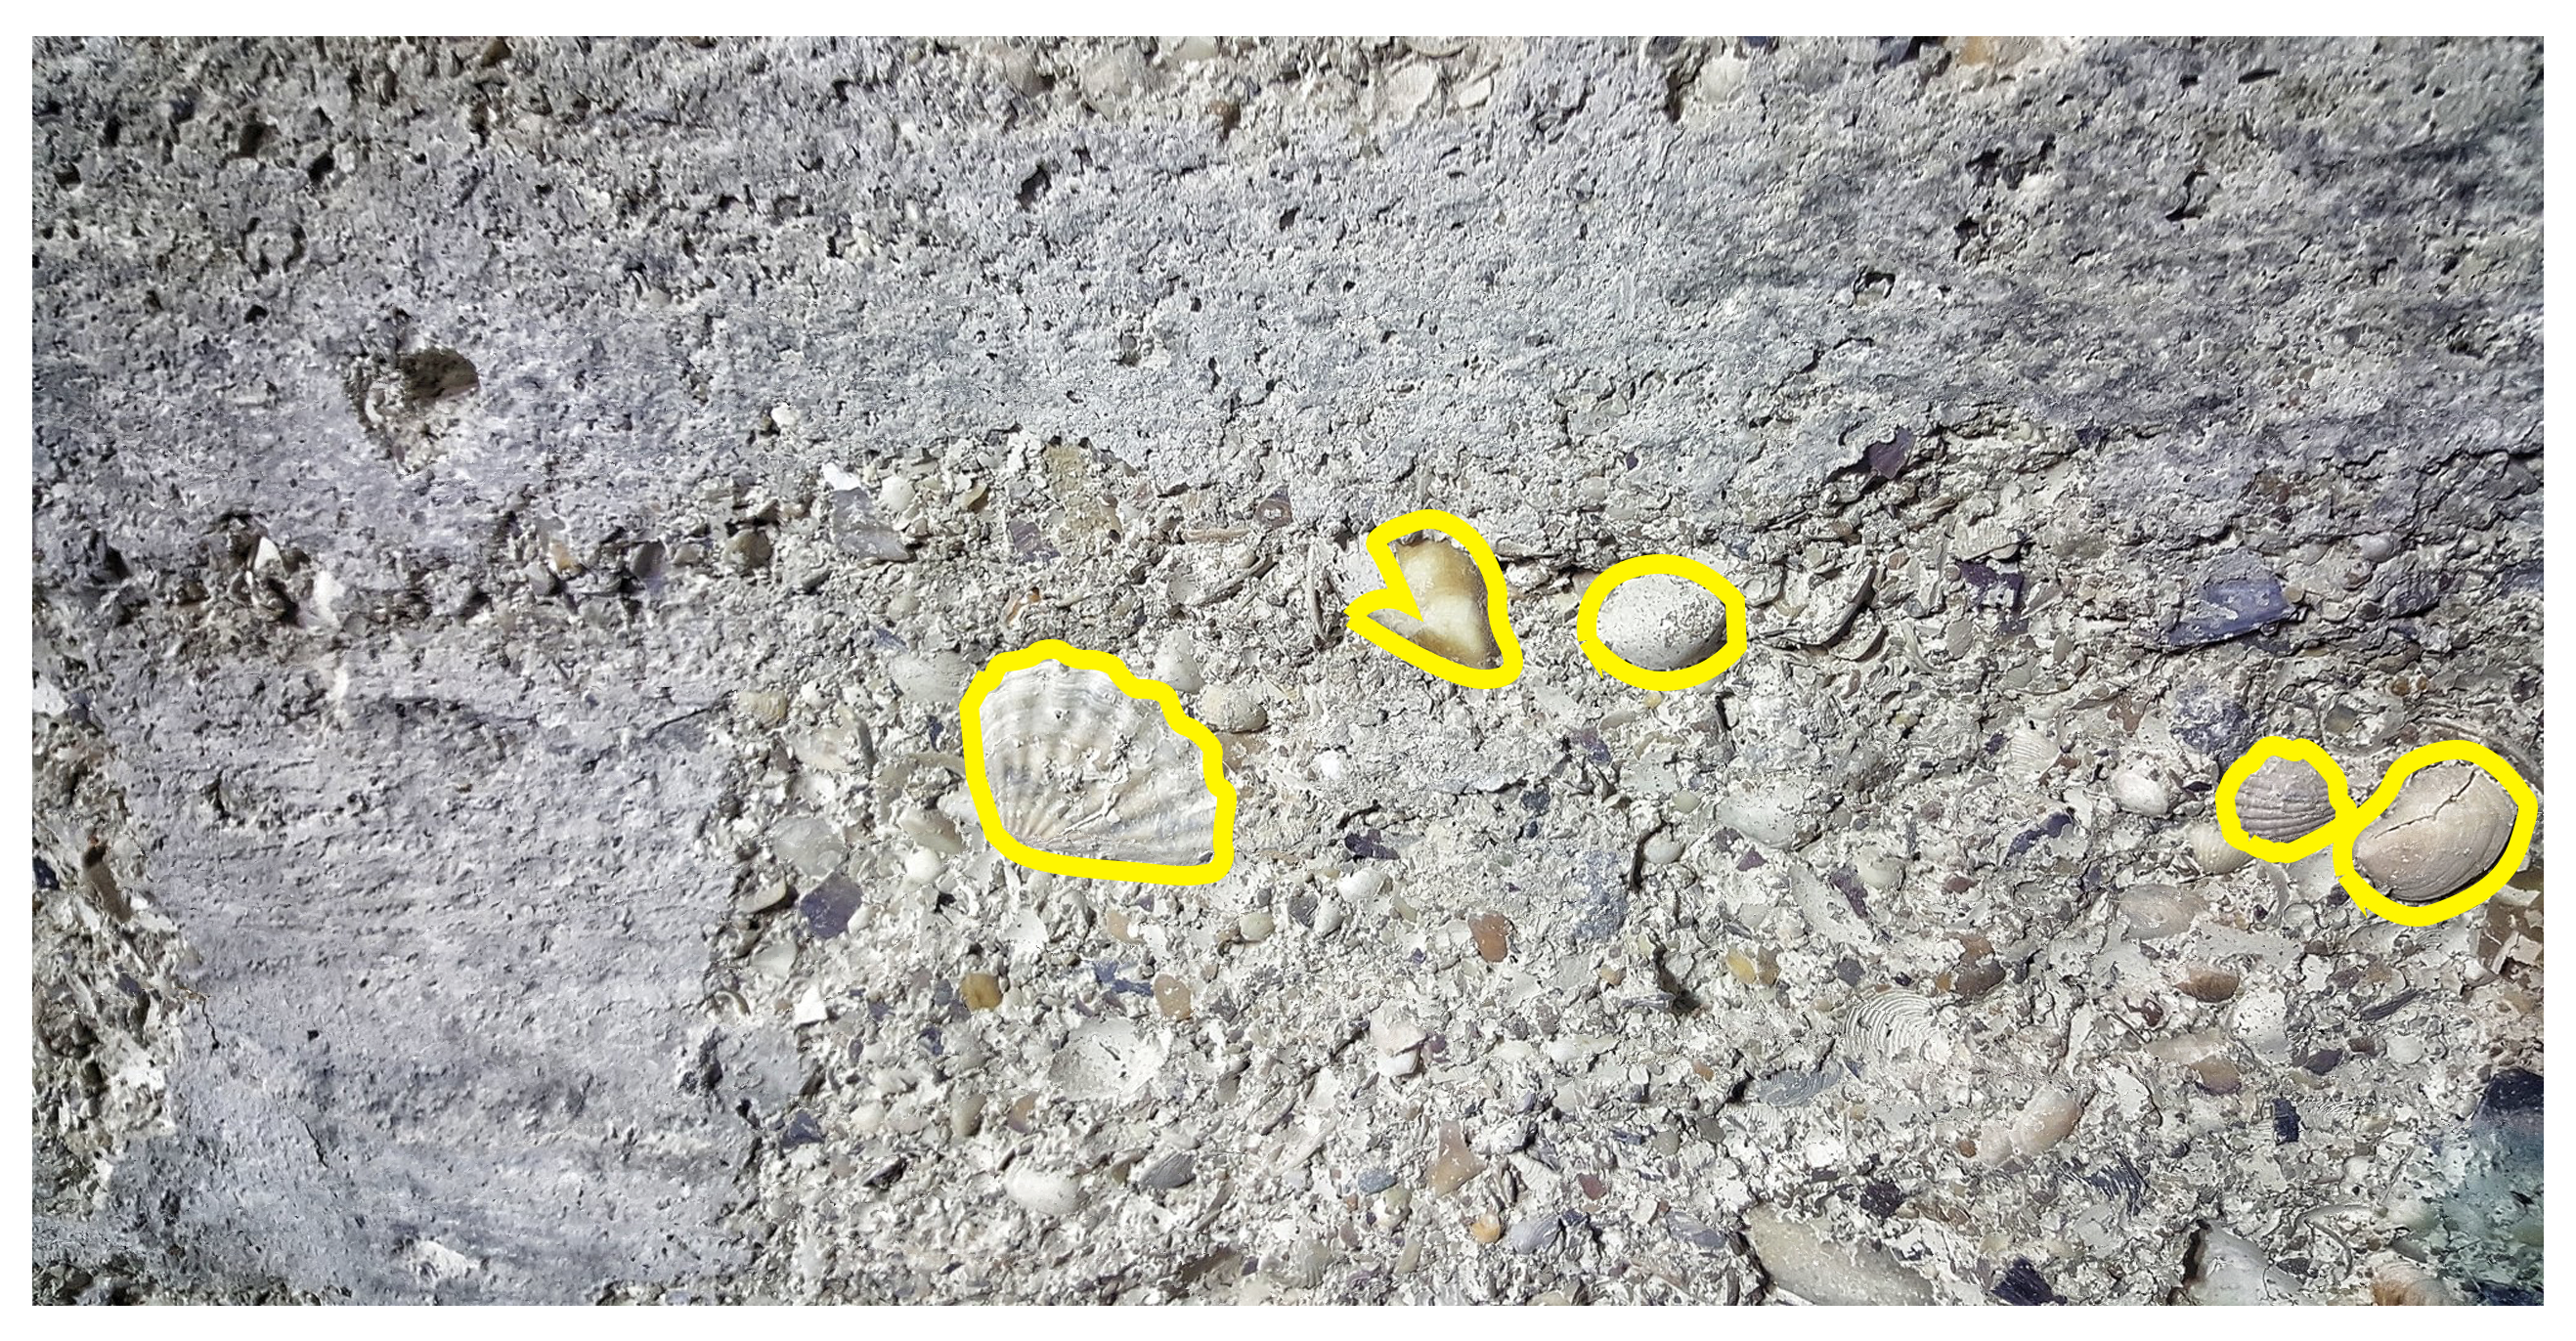
The 1999 Earthquake has shown that the usage of certain construction materials, such as “sea-sand mixed cement” or rebars with no ribs, can be a significant risk factor during a earthquake. Although most of these materials cannot be identified without a structural test, some easy-to-spot visual hints can offer useful information. Many locals are advised to look for sea shells on the surface of the concrete to identify whether the cement is mixed with sea-sand.
METHODOLOGY
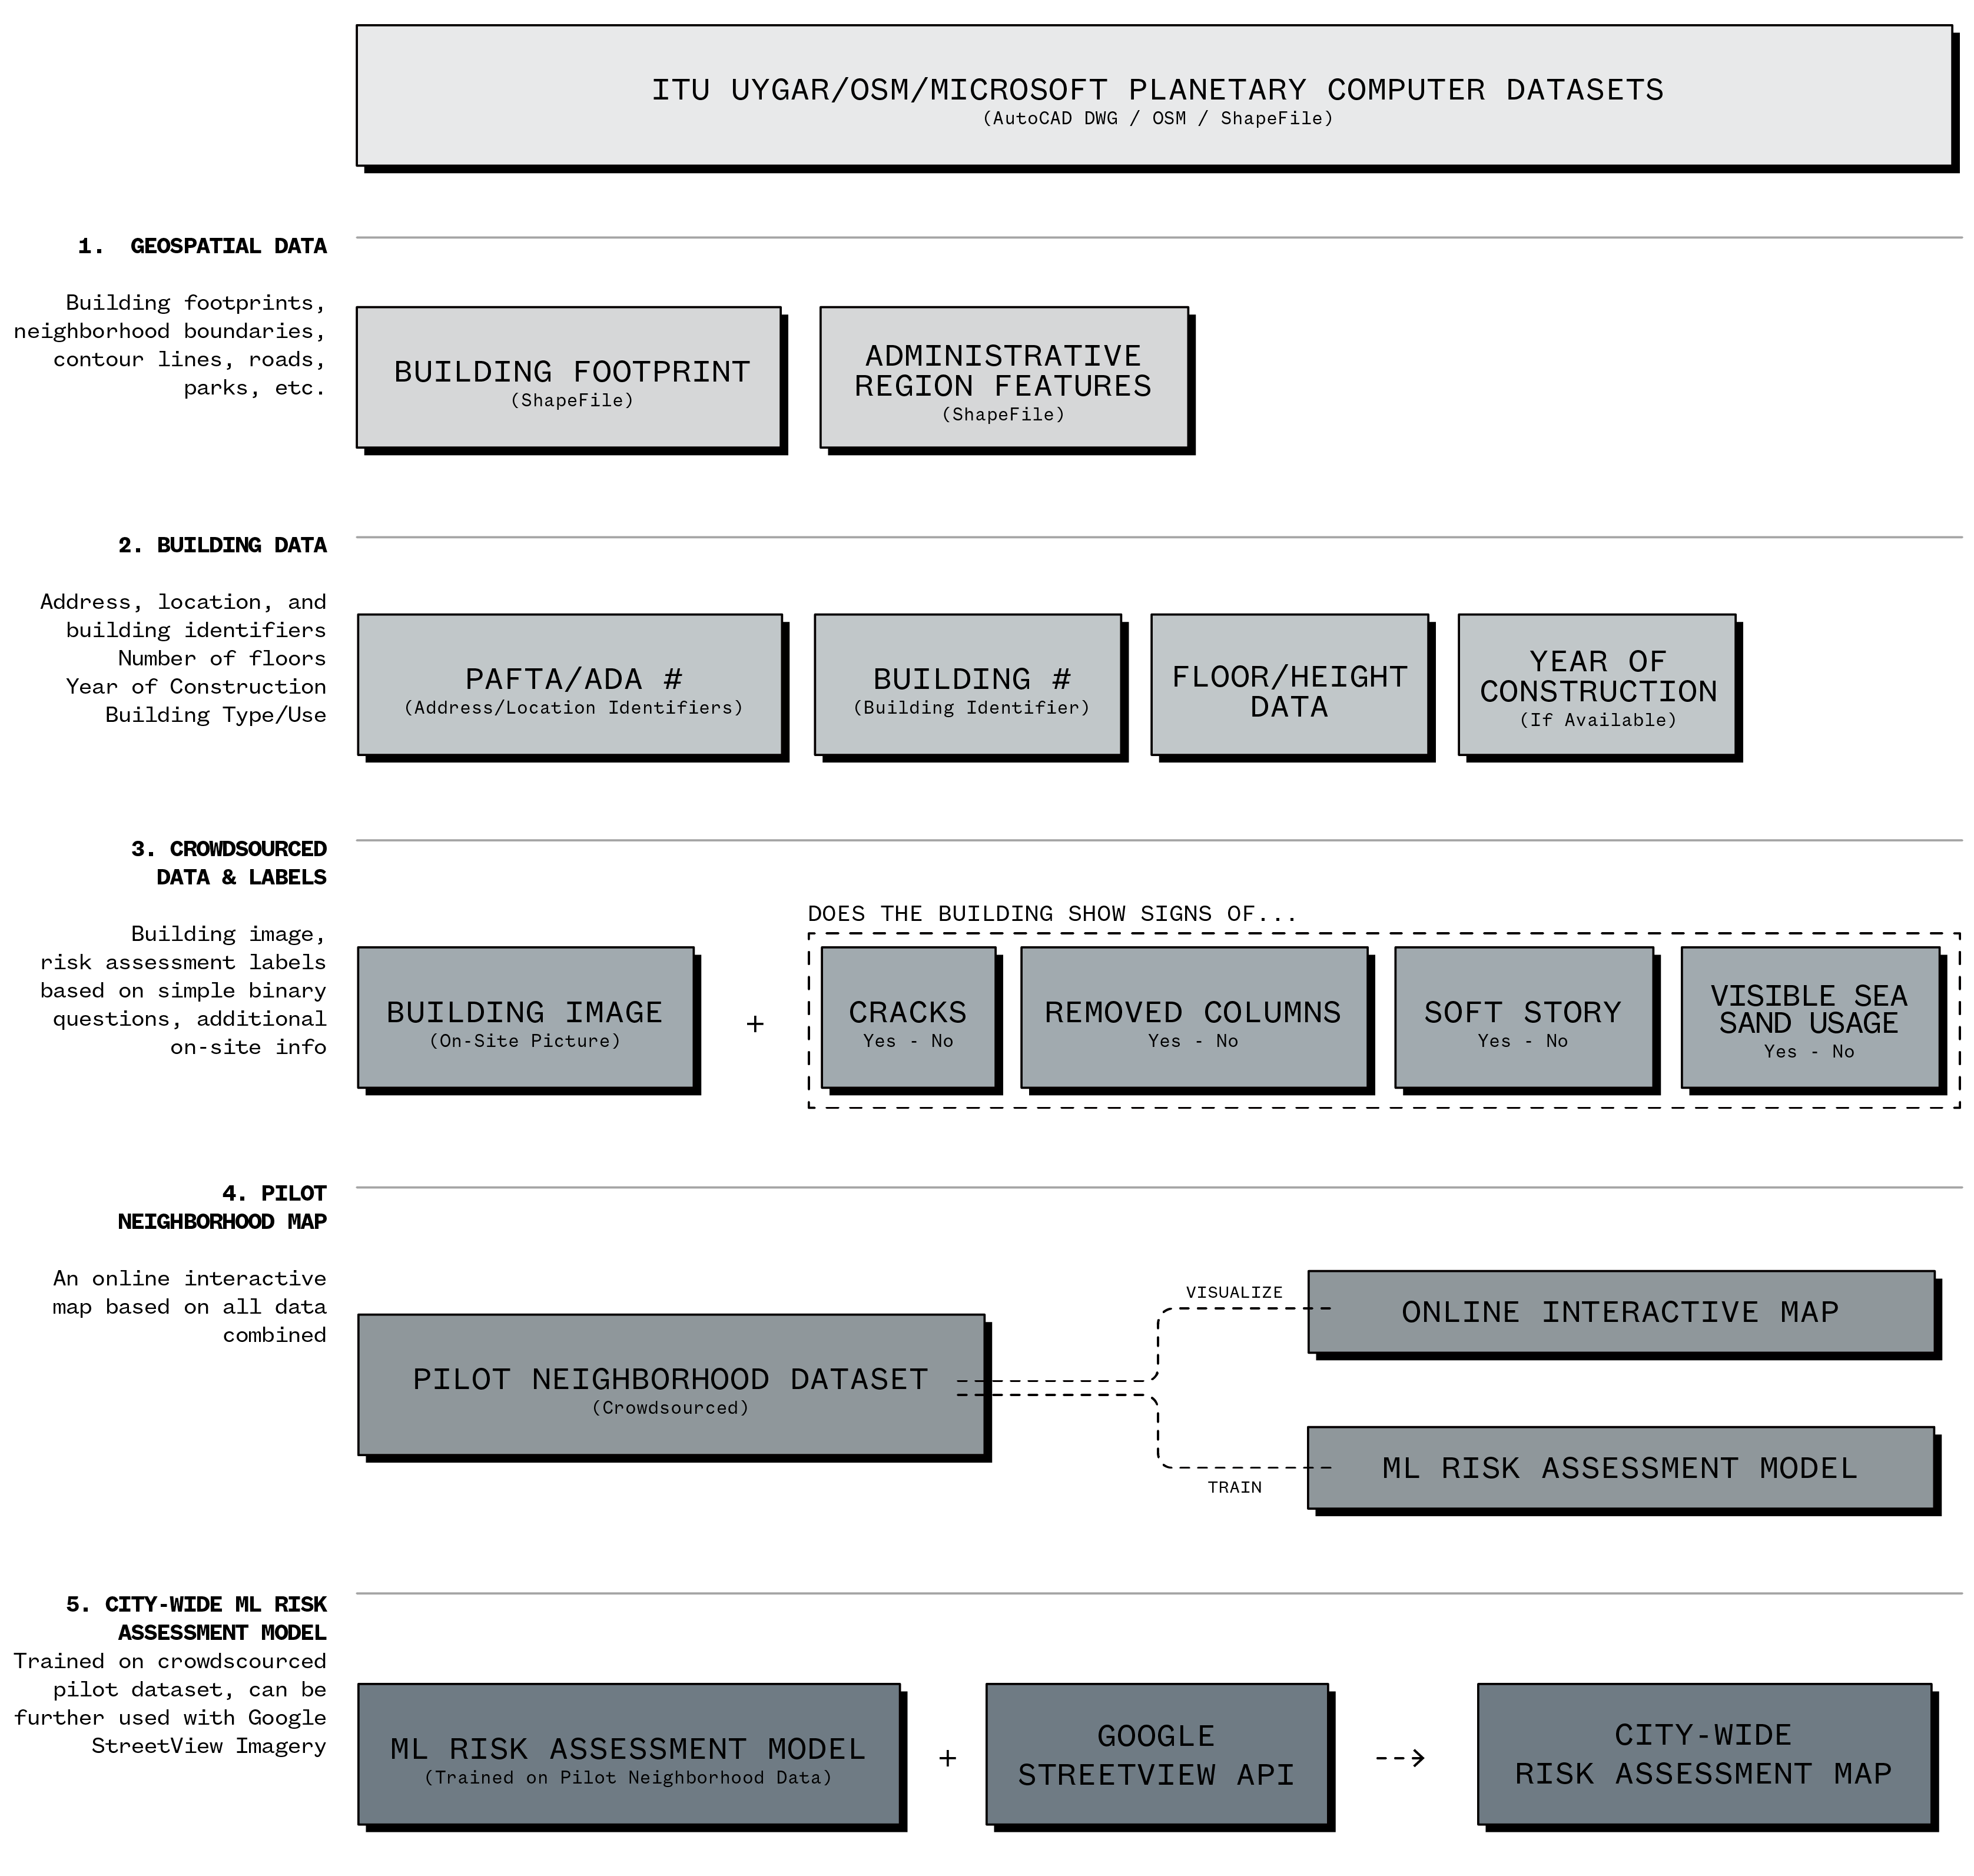
The above diagram illustrates the main framework of the methodology behind the alternative risk assessment mapping technique in five steps.
-
Geospatial Data This step sets a common base for all following steps by cleaning up and bringing together all required geospatial (building footprints, administrative borders, roads, highways, sidewalks, parks, and transportation infrastructure) in GIS. Building footprints are mainly obtained through Istanbul Technical University’s UYGAR 2D AutoCAD DWG maps. Although these maps are highly accurate, they also include unnecessary amounts of information (unnecessary text layers, urban furniture and items such as streetlight and manhole locations) — hence it is critical for DWG files to be cleaned up before importing into GIS.
Additionally, these maps may need to be supported with Microsoft Planetary Computer Building Footprint dataset for unregistered buildings that are not present on the 2D map drawings. Two datasets combined and georeferenced correctly on the GIS workspace, this first step is critical to create a base dataset that will allow collaborators to add their on-site observations.
-
Building Data The aforementioned 2D map drawings also include building and location information like post codes, location and address identifiers, building numbers, and number of floors. However, these exist as text objects nested within the polylines that represent each building’s footprint. Although QGIS does not have a tool for linking these text objects with the geometry they are nested inside, there may be 3rd-party plug-ins to automatically combine building data with the geometry.
The below data entries are essential to identify each building: 1. Pafta/Ada numbers (location and neighborhood administrative border identifiers) 2. Building number (local street identifier), 3. Number of floors/building height, 4. Year of construction (if available, this is very useful to determine the specific Building Code under which the building was constructed — as buildings constructed before 1999 Earthquake are considered to constitute “high risk of failure during an earthquake”)
-
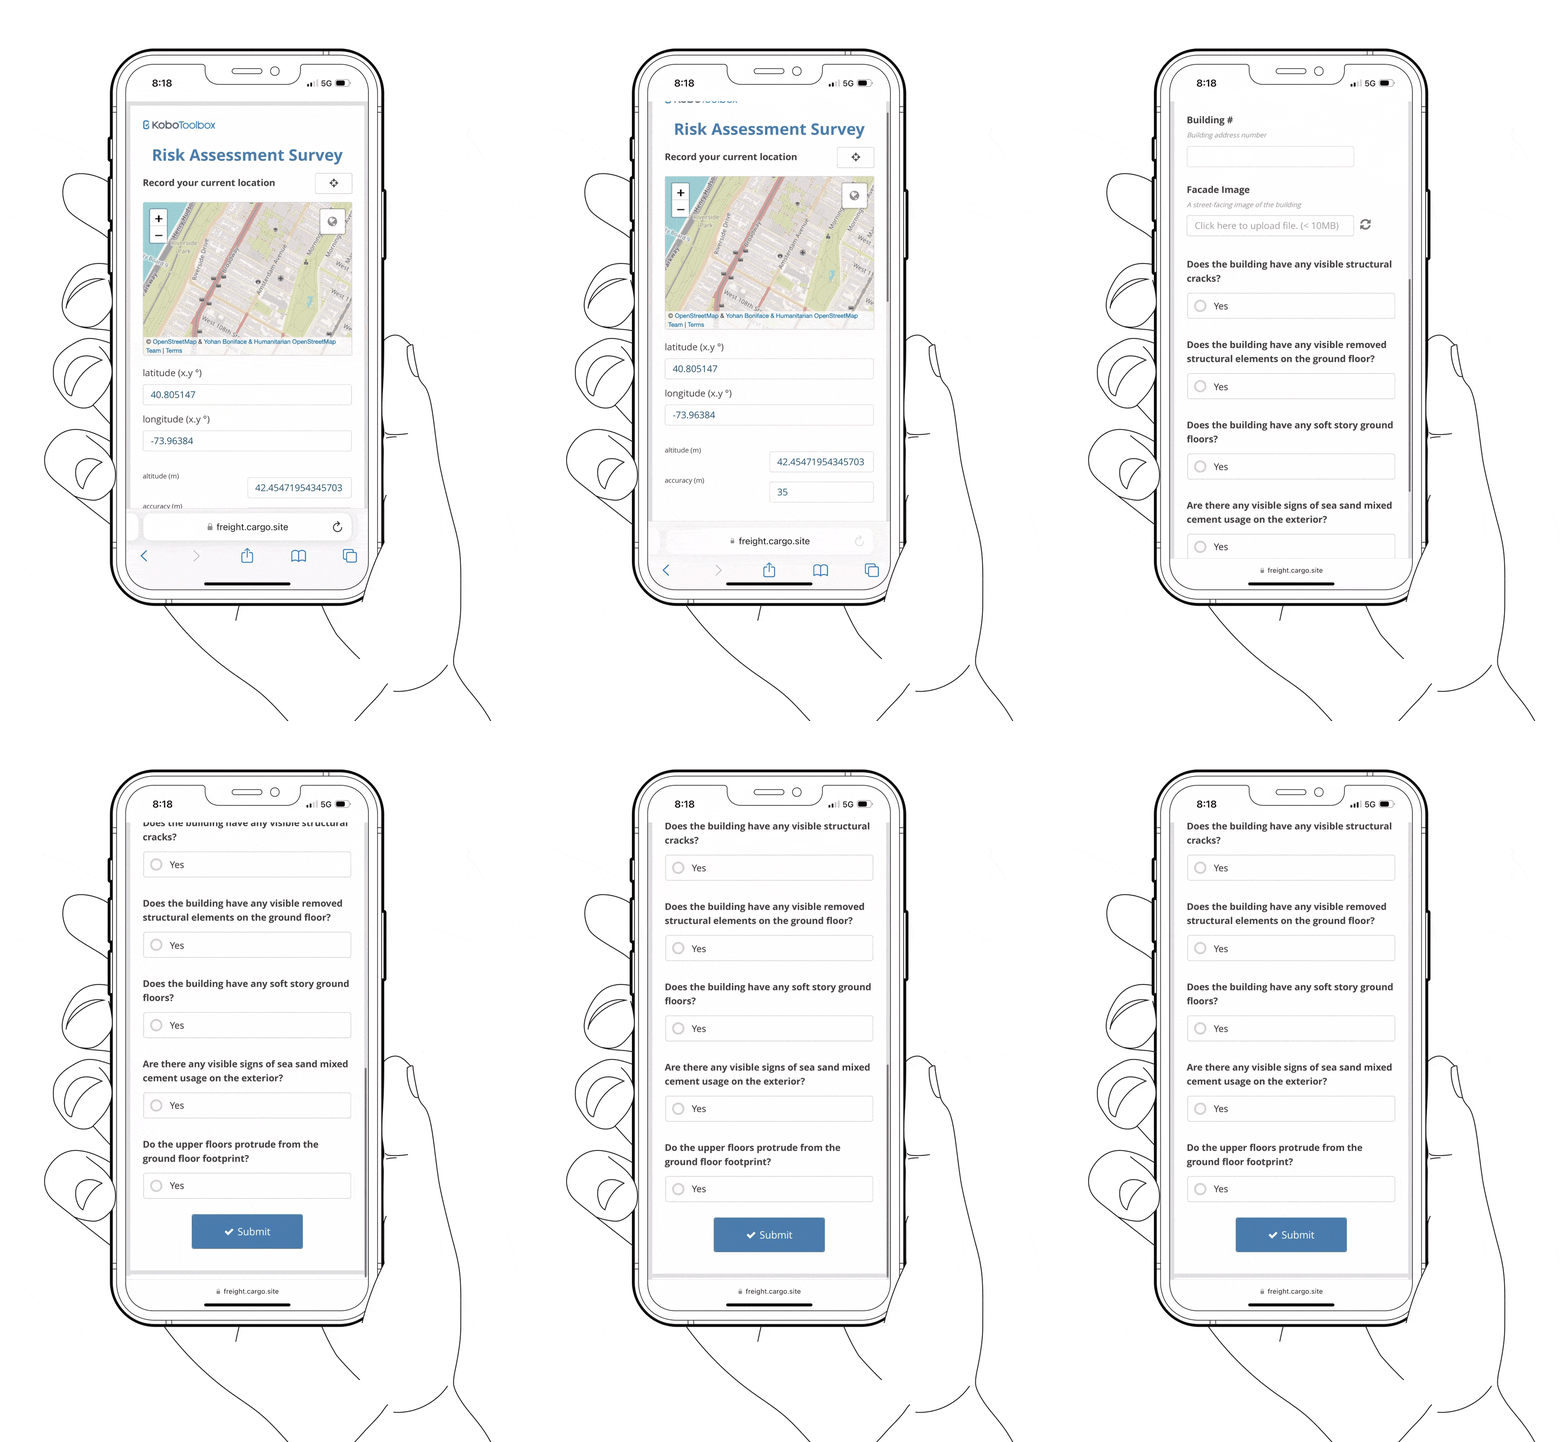
Crowdsourced Pilot Building Risk Assessment Data and Labeling Once the building stock is digitized, the project relies on data collectors for creating the pilot building risk assessment dataset. This step utilizes an online data-collection service such as Kobo Toolbox, to allow multiple users to simultaneously add additional data entries to the geospatial building data.
Data collectors are expected to photograph the front-facing facade of every building, and fill in four questions for each building:
- Are there any visible cracks on the building?
- Are there any removed vertical supporting elements on the ground floor?
- Does the building have a soft floor?
- Are there any visible signs of sea-sand based cement usage - such as visible sea shells on the surface?
-
Pilot Neighborhood Dataset Once all the buildings in the selected pilot neighborhood is digitized and labeled as mentioned in Step 3, the merged data is used to visualize an interactive risk analysis map as well as used to train the Risk Assessment Model. There have been various studies using a wide array of Machine Learning models and techniques tackling similar issues. Since we use multiple identifiers, using a supervised-learning method of “Multi-Label Convolutional Neural Network” is the most efficient and suitable ML-model to start with.
Every building must be labeled with all “identifiers” in order to train the model with every image. These images and labels will later be used to train a machine learning model.
-
City-wide ML Risk Assessment Model Once the ML model is able to accurately detect the aforementioned building features that may constitute structural failure risk, it may be further trained on Google StreetView images, and later be used to generate a city-wide risk assessment map.
DATA SOURCES

- This project heavily relies on online data collection tools like Kobo Toolbox, and crowdsourced data collection methods. Creating an online data collection tool on an up-to-date city map, where collectors can access each building’s location, image, address, and door number.
- Istanbul Technical University UYGAR Maps are high-detail 2D maps in AutoCAD DWG format. This dataset includes building numbers, floor and height data, as well as zoning data. This dataset is by far the most reliable despite requiring DWG-GIS conversion processes.
- Istanbul Metropolitan Municipality’s BIMTAS Building Stock dataset is the most up-to-date, detailed GIS/ShapeFile building stock dataset, however this is not open for public/academic use.
- OpenStreetMaps has a fairly detailed GIS/ShapeFile dataset that covers a wide landmass across the city, however these are not consistent and far from complete.
- Garmin Maps has a detailed GIS/ShapeFile dataset, however there are some ShapeFile geometry issues - some buildings/areas are corrupt, hence cannot be used.
- Microsoft Planetary Computer Building Footprint Dataset is another alternative dataset that uses specialized ML models to generate building footprints from satellite imagery. This could be a valuable tool to obtain building shape data in certain neighborhoods where many buildings are purposefully not registered to the municipality’s system to avoid regulations.
- Google StreetView API will be used gather street images on which the trained ML model to make assessments.
CHALLENGES
This proposal envisions an alternative method to the current day traditional structural risk assessment practices that have various shortcomings in the case of Istanbul. Computationally generated, machine-learning based models have proven to be quite useful in detecting various risk identifiers, if a large-enough data set was used in training. However, the effectiveness of this method relies heavily crowdsourced data collection efforts, as well as data cleanup and various other factors.
Furthermore, collected images and other data are subject to many points of failure - especially the consistency of the imagery, as well as the heavy presence of urban artifacts and people populating the front-facing facade images of the buildings. Even though these images could be further cleaned using photo-editing software such as Adobe Photoshop, the trained model will potentially run into a similar issue when processing the Google StreetView images, given many of them have trees, vehicles, people and other artifacts blocking the building facades. Such challenges may affect the results significantly.
CONCLUSION
Despite the challenges, this proposal has significant potential to become a widely-used tool in preventing such dire losses in the future. Although this method may not be as accurate as physical structural tests, it may play a key role in primary testing and detecting higher-risk areas and buildings on which the national and local authorities can focus their work efforts. Given the time constraints and the scale of the problem in the case of Istanbul, this method could be a highly useful asset in preparing against the upcoming Istanbul Earthquake.
BIBLIOGRAPHY
Andrew, Revkin. “Gauging Losses and Lessons in Turkey’s Unfolding Earthquake Calamity,” Sustain What (blog). February 6, 2023. https://revkin.substack.com/p/gauging-losses-and-lessons-in-turkeys
Lydia, Polgreen. “‘The State Failed These People. They Didn’t Have to Die Like This.’“ The New York Times. March 10, 2023. https://www.nytimes.com/2023/03/10/opinion/erdogan-turkey-earthquake.html
Hubbard, Ben, Elif Ince and Safak Timur. “Turkish Builders Come Under Intense Scrutiny Over Shoddy Construction.” The New York Times. February 23, 2023. https://www.nytimes.com/2023/02/23/world/middleeast/turkish-builders-come-under-intense-scrutiny-over-shoddy-construction.html
Fountain, Henry. “Turkey’s Earthquake Zone is A Lot Like California’s. Here’s What That Means.” The New York Times. February 27, 2023. https://www.nytimes.com/2023/02/27/climate/turkey-syria-earthquakes-california.html?searchResultPosition=13
Singhi, Anjali, Bedel Saget, K.K. Rebecca Lai, Yuliya Parshina-Kottas, Sergey Ponomarev and Jeremy White. “See One Historic Turkish Street Before and After the Earthquakes.” The New York Times. March 22, 2023. https://www.nytimes.com/interactive/2023/03/22/world/middleeast/turkey-earthquake-antakya.html?searchResultPosition=7
Abraham, Leanne, Lauren Leatherby, Scott Reinhard, and Jeremy White. “Thousands of Buildings Collapsed in One Turkish City. Thousands More May Have to Come Down.” The New York Times. March 13, 2023. https://www.nytimes.com/interactive/2023/03/13/world/middleeast/antakya-damage-assessment.html?action=click&pgtype=Article&state=default&module=styln-turkey-earthquake&variant=show®ion=MAIN_CONTENT_1&block=storyline_top_links_recirc
Mark, Quigley. “Earthquake footage shows Turkey’s buildings collapsing like pancakes. An expert explains why.” The Conversation. February 6, 2023. https://theconversation.com/earthquake-footage-shows-turkeys-buildings-collapsing-like-pancakes-an-expert-explains-why-199389
Horton, Jake, and William Armstrong. “Turkey earthquake: Why did so many buildings collapse?” BBC. February 9, 2023. https://www.bbc.com/news/64568826
“Istanbul Mayor warns about risk of 90,000 buildings collapsing in expected major quake.” Duvar English. February 13, 2023. https://www.duvarenglish.com/istanbul-mayor-imamoglu-warns-about-risk-of-90000-buildings-collapsing-in-expected-major-quake-news-61848
“2019 video of Erdoğan praising zoning amnesty in quake-hit province goes viral.” Duvar English. February 12, 2023. https://www.duvarenglish.com/2019-video-of-erdogan-praising-zoning-amnesty-in-quake-hit-province-goes-viral-video-61831
Vox. “How these buildings made Turkey-Syria’s earthquake so deadly,” YouTube video, 6:15. February 14, 2023. https://www.youtube.com/watch?v=TnlCRoBAcuw
Elijah, Chiland. “Will your building hold up in a major earthquake?” Curbed. May 9, 2018. https://la.curbed.com/2018/5/9/17329450/los-angeles-earthquake-damage-building-collapse
Saatcioglu, Murat & Mitchell, Denis & Tinawi, René & Gardner, N. (Noel) & Gillies, Anthony & Ghobarah, Ahmed & Anderson, Donald & Lau, David. (2001). The August 17, 1999, Kocaeli (Turkey) earthquake - Damage to structures. Canadian Journal of Civil Engineering - CAN J CIVIL ENG. 28. 715-737. 10.1139/cjce-28-4-715.