Riding Through the Advertising Landscapes of NYC
“…production has been outsourced, value is produced virtually, infrastructures lie in computer protocols, and the forms of capture engineered into social media platforms, such as facebook and google. In this economy the regulation of attention is central to the production value” (Larkin, 2013, p. 339).
Infrastructure, Infrapolitics, and the Subway
In The Politics and Poetics of Infrastructure, Brian Larkin invites a discussion of media as infrastructure in the digital age. A single definition that encircles everything we think of as infrastructure is elusive. It is at first the system of “…built networks that facilitate the flow of goods, people, or ideas and allow for exchange over space” (p. 328). Infrastructure also takes on more abstract qualities. From technical and physical systems to the, in Larkin’s words, “fetish-like” aspects and forms of desire and fantasy imbued in them, infrastructure makes up a significant portion of the structures we encounter and inhabit in modern daily life.
Within New York City’s subway system, the rider is a captive audience to a stream of communications competing for their valuable attention. As the subway’s physical infrastructure facilitates the movement of people and their goods around the city, its informational infrastructure delivers messages from institutional, state, and corporate actors directly to the rider through posters and an increasing number of digital displays.
James C. Scott coined the term infrapolitics to describe informal networks of communication and resistance, often carried out anonymously (2012, p. 1). The subways are a site of historical conflict between formalized communications and their informal, infrapolitical counterparts. Most advertising on the subway is state-sanctioned–a blend of public notices and corporate messages. New York City subway ads in particular are infamous for provocation, testing the boundaries of what is socially acceptable. In content, medium, and style, they reflect their time and place, and the attitudes of the society by which they are sanctioned and curated. Forms of non-sanctioned, infrapolitical communication on the subway have become more anonymous and uncommon since the heyday of graffiti and “subway writing” in the 1970s and early 1980s. The Giuliani administration waged a war on graffiti as part of its broken-windows policing tactics. Graffiti and other forms of resistance and subversion are more subtle than ever, and most of what the rider sees is carefully curated by the state.
Project Goals
We set out to explore and document what riders of the R train encounter throughout the cars and stations of the line. The R train travels through three boroughs representing a diverse transect of New York City, including demographically distinct neighborhoods from Flushing to Midtown to Bay Ridge. Since advertisements are updated relatively frequently, our data represents a snapshot in time, with data collection having occurred during late winter of 2022. Our exploration resulted in the creation of a dataset and a collection of photos, which we later examined in detail.
In documenting these advertising typologies, we hope to identify larger patterns regarding the relationship between subway advertising and underlying socioeconomic characteristics by neighborhood. Advertisers choose their target demographics carefully. Can we find trends in what is being communicated to whom, and where? What are the irregularities, informal ads, vandalism, and infrapolitical communications? Are they forms of resistance?
Data Collection
We visited every stop on the R Line from end-to-end and noted down the advertisements that we saw. From there, we compiled all our information into an spreadsheet, where each row represents an ad we saw. In total, we documented over 200 ads across the line.
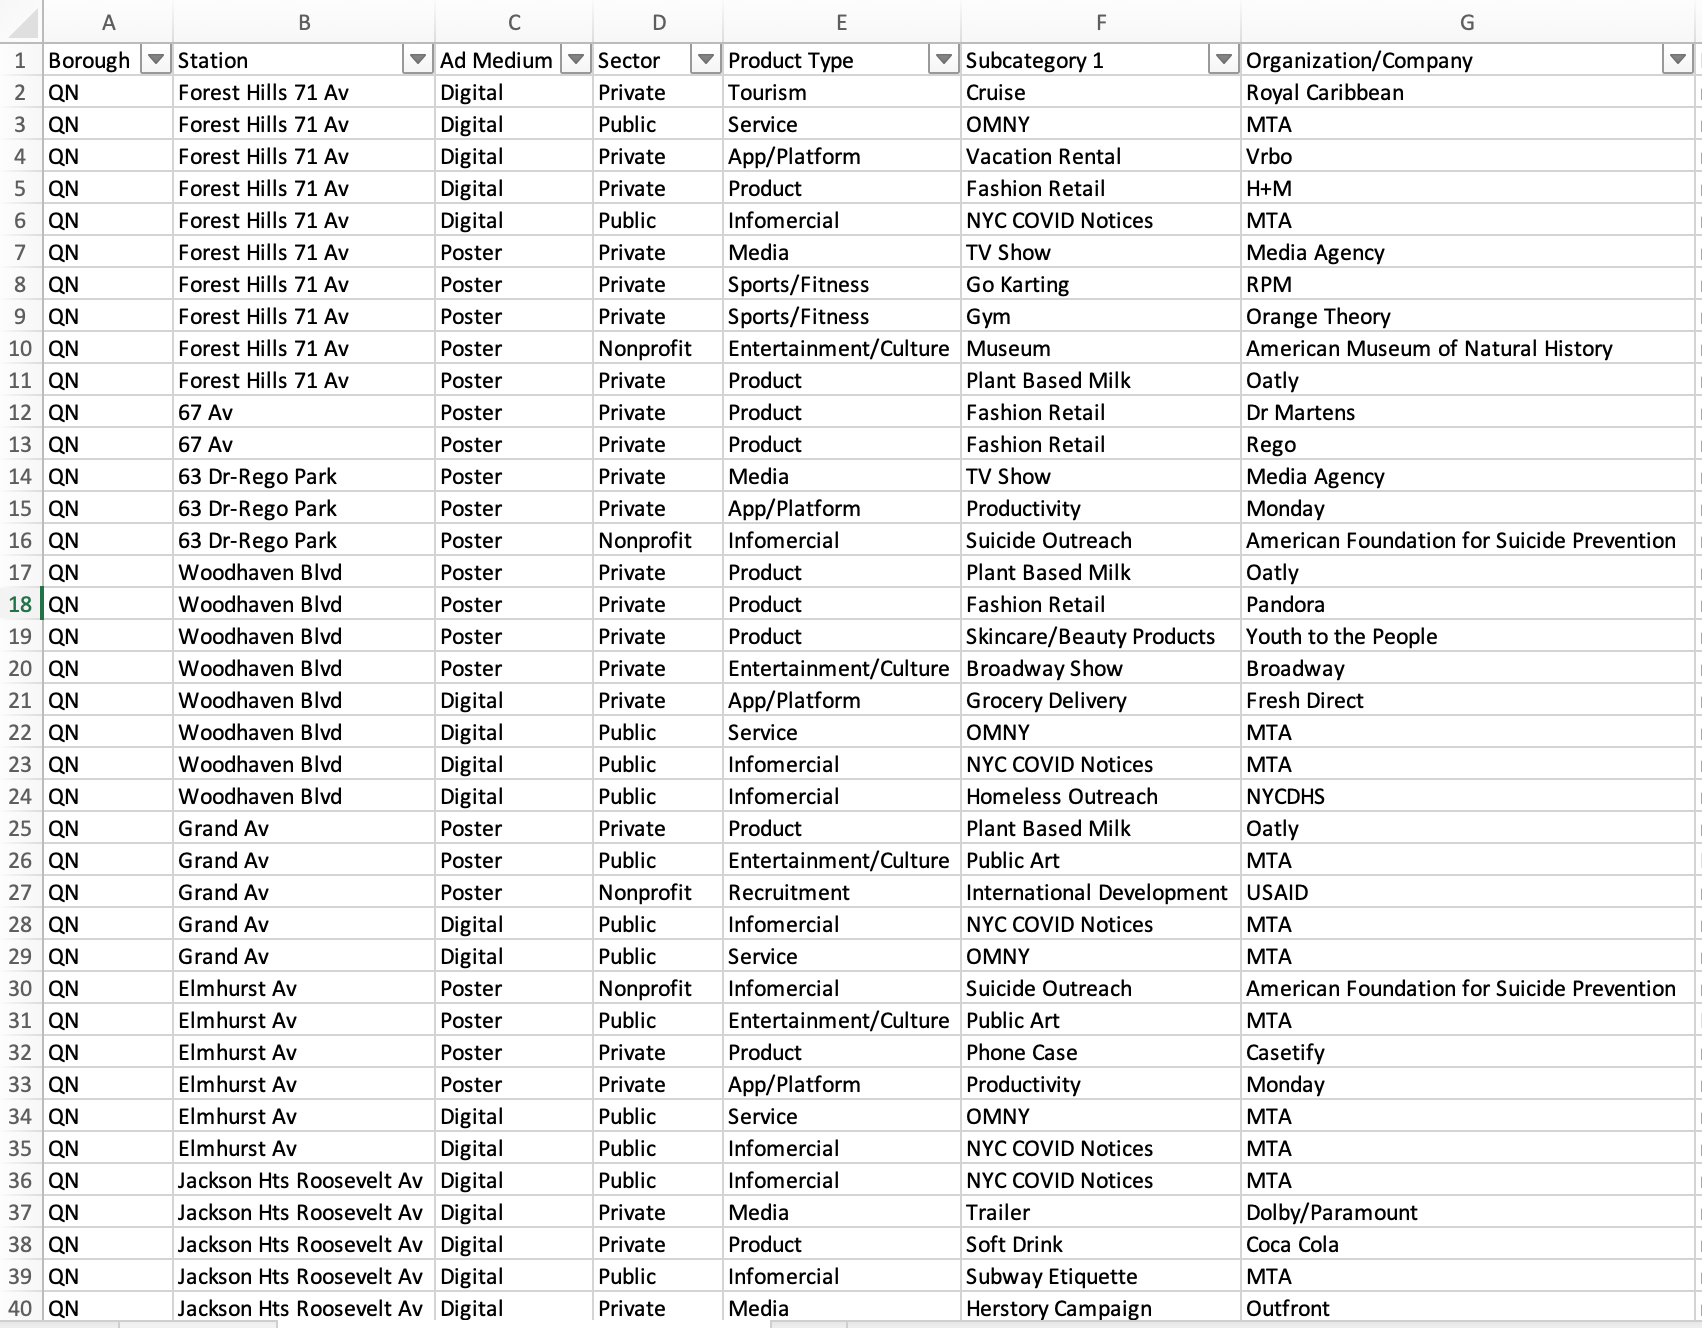
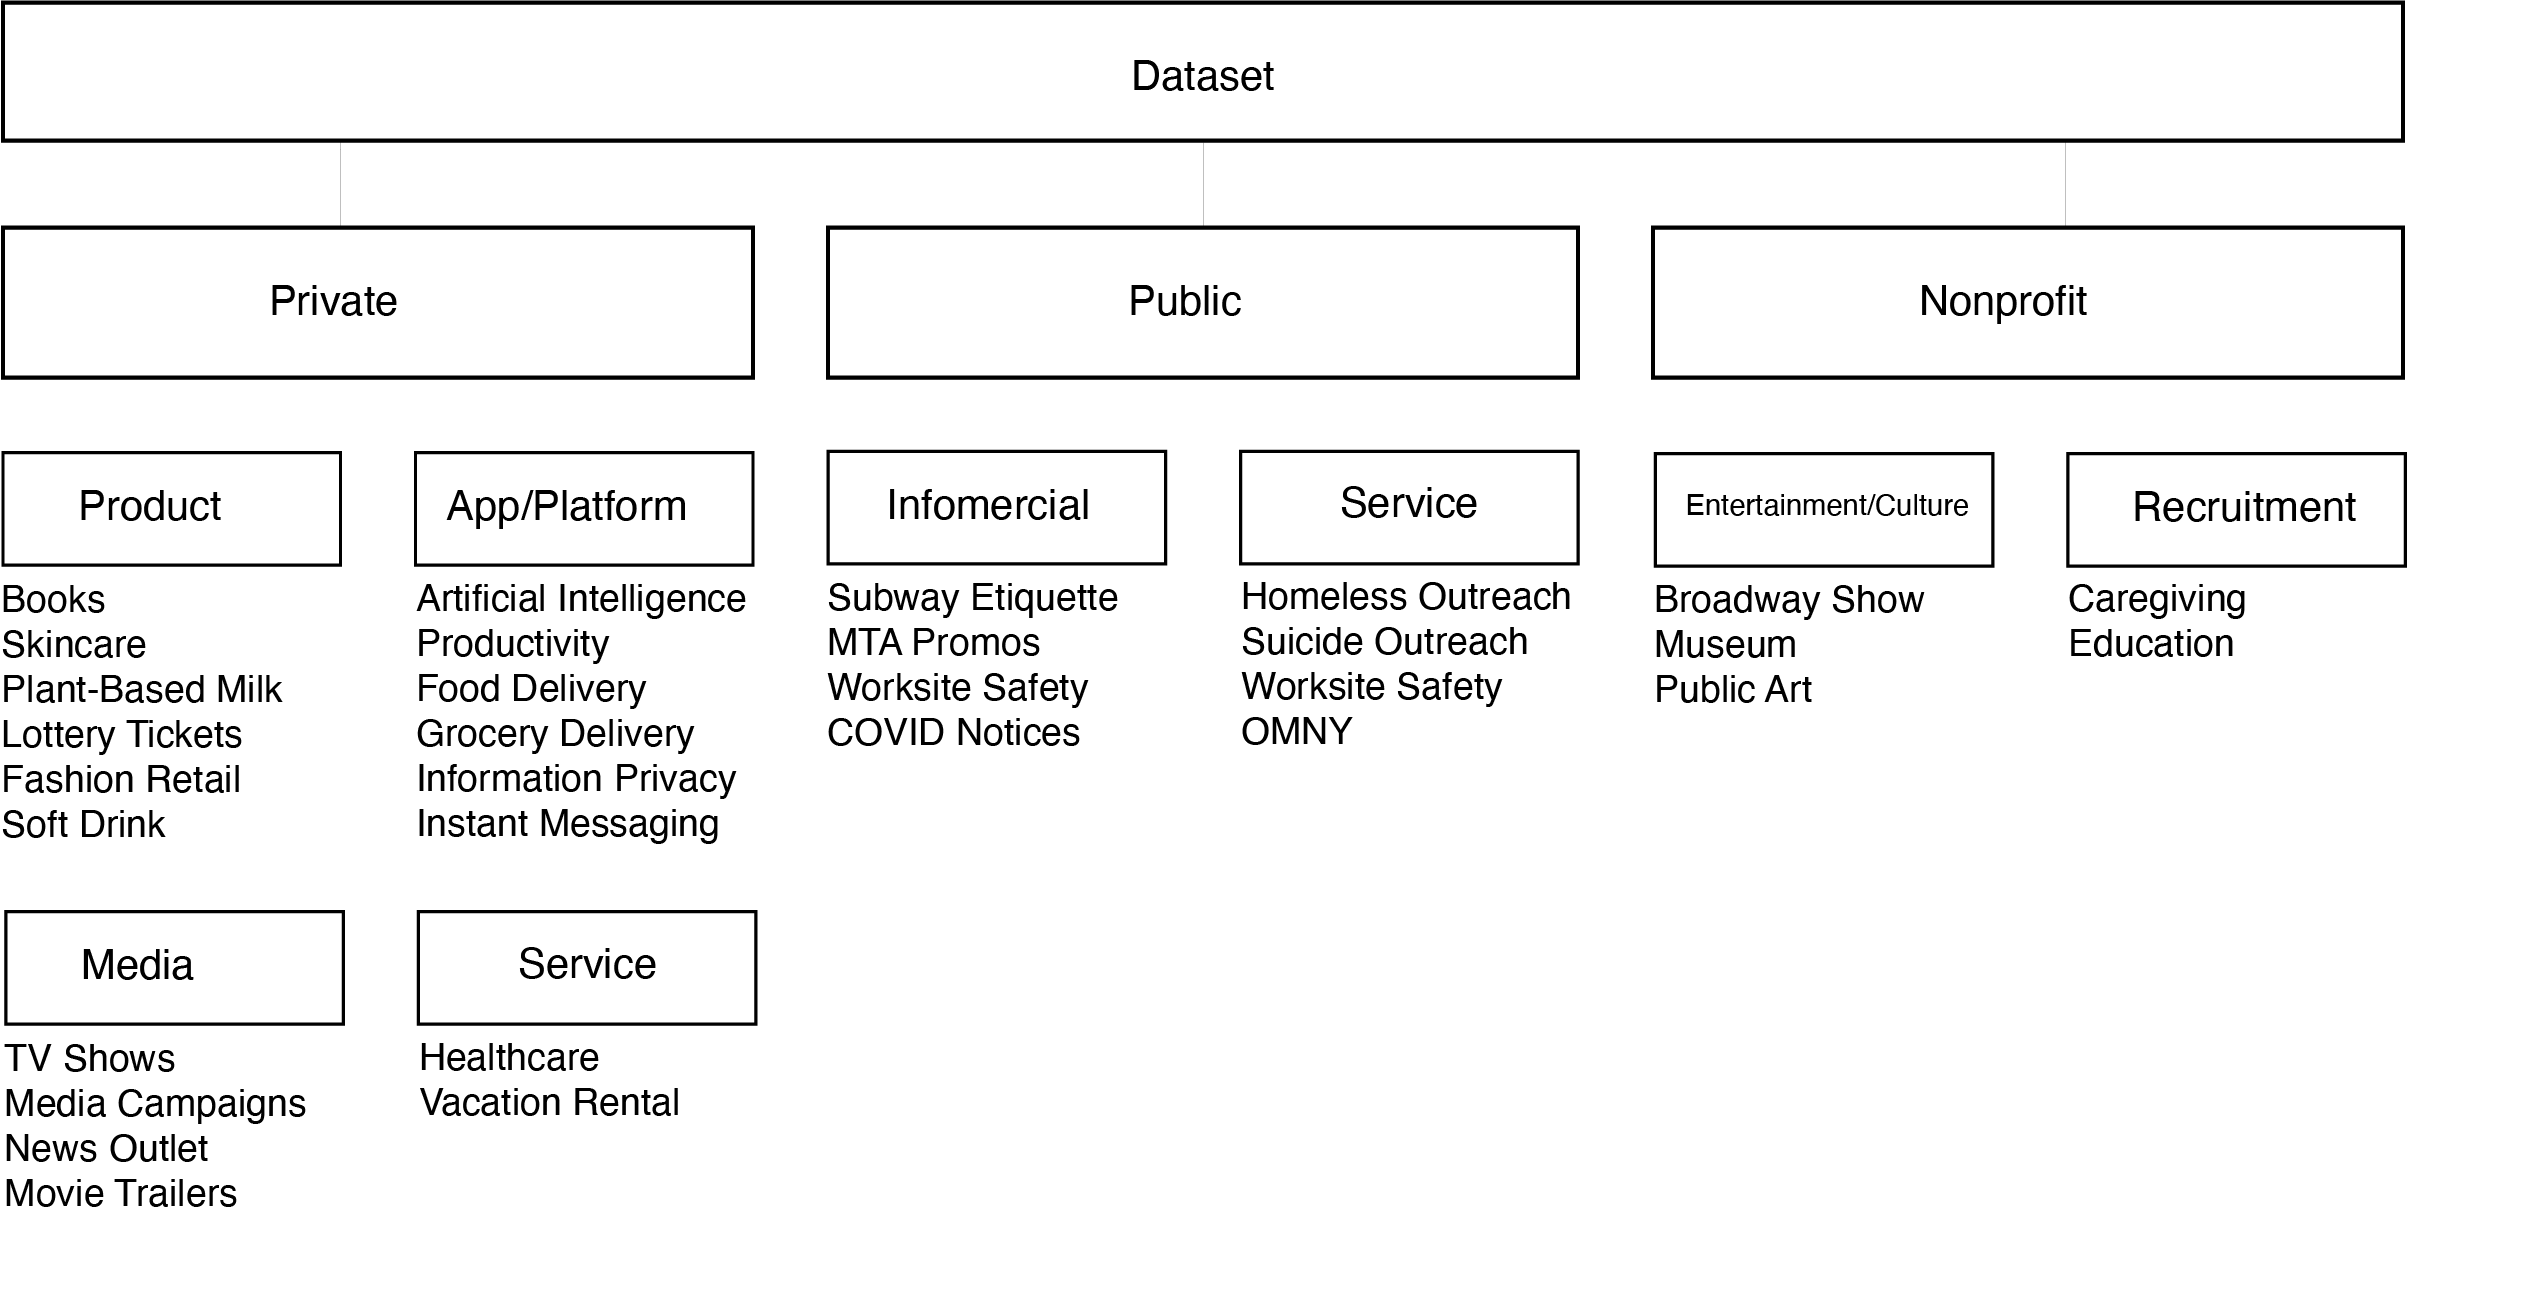
From there, we categorized our data into advertising typologies by:
- Ad medium: Whether the ad was shown on a digital or print platform
- Sector: Was the ad sponsor a private, public, or nonprofit organization
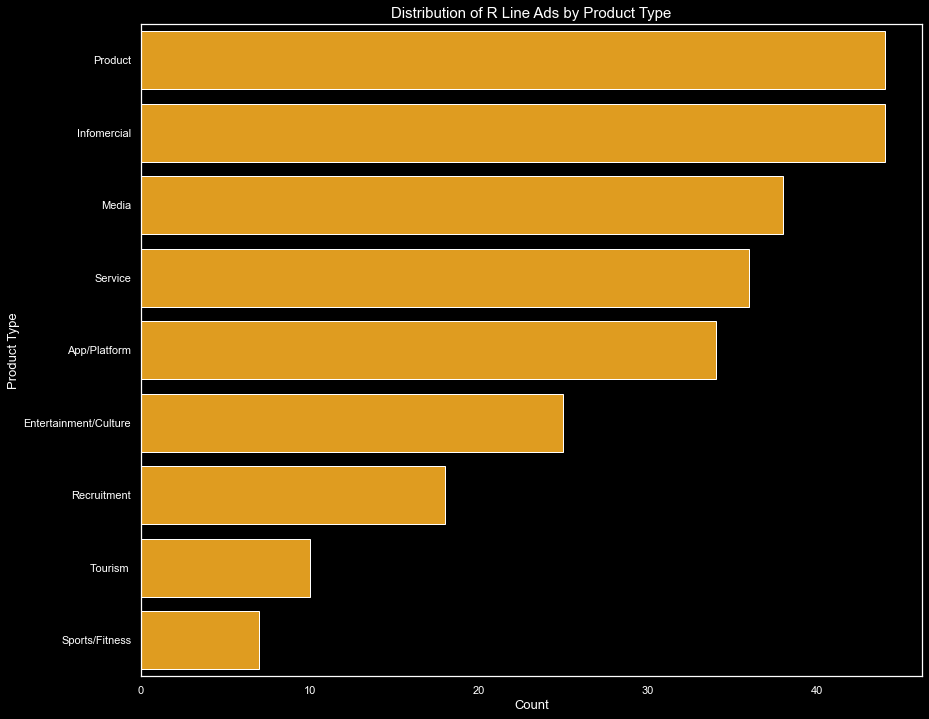
- Product Type: What “product” was the ad trying to sell? E.g. a service, mobile application, infomercial
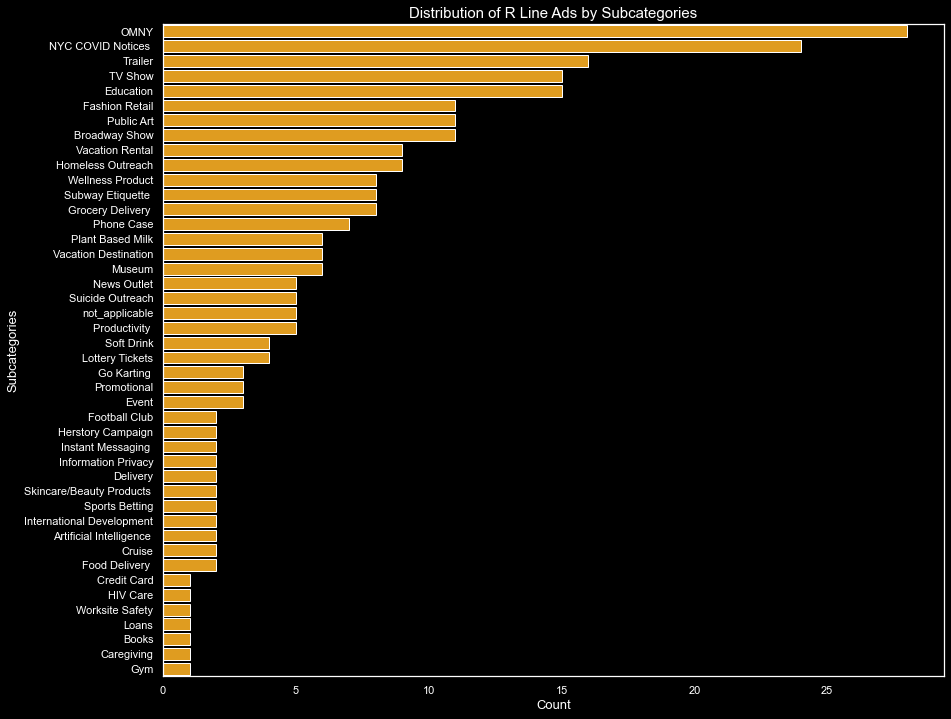
- Subcategory of Product Type: A more zoomed-in version of the product type. E.g. Within the mobile application product type, there might be food delivery apps and productivity apps
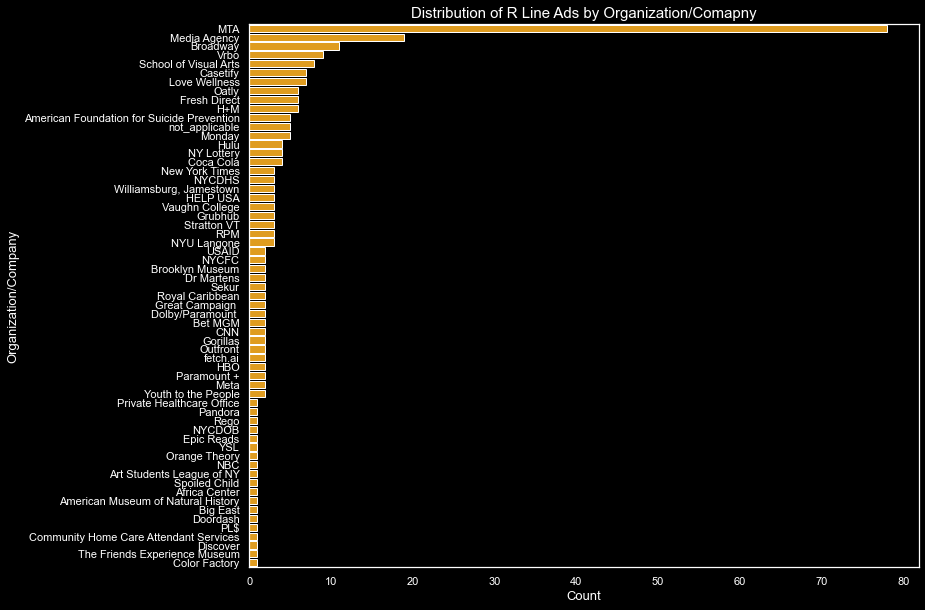
- Organization: What was the specific company sponsoring the ad
Establishing these typologies of ads allowed us to conduct further analysis of the dataset we created.
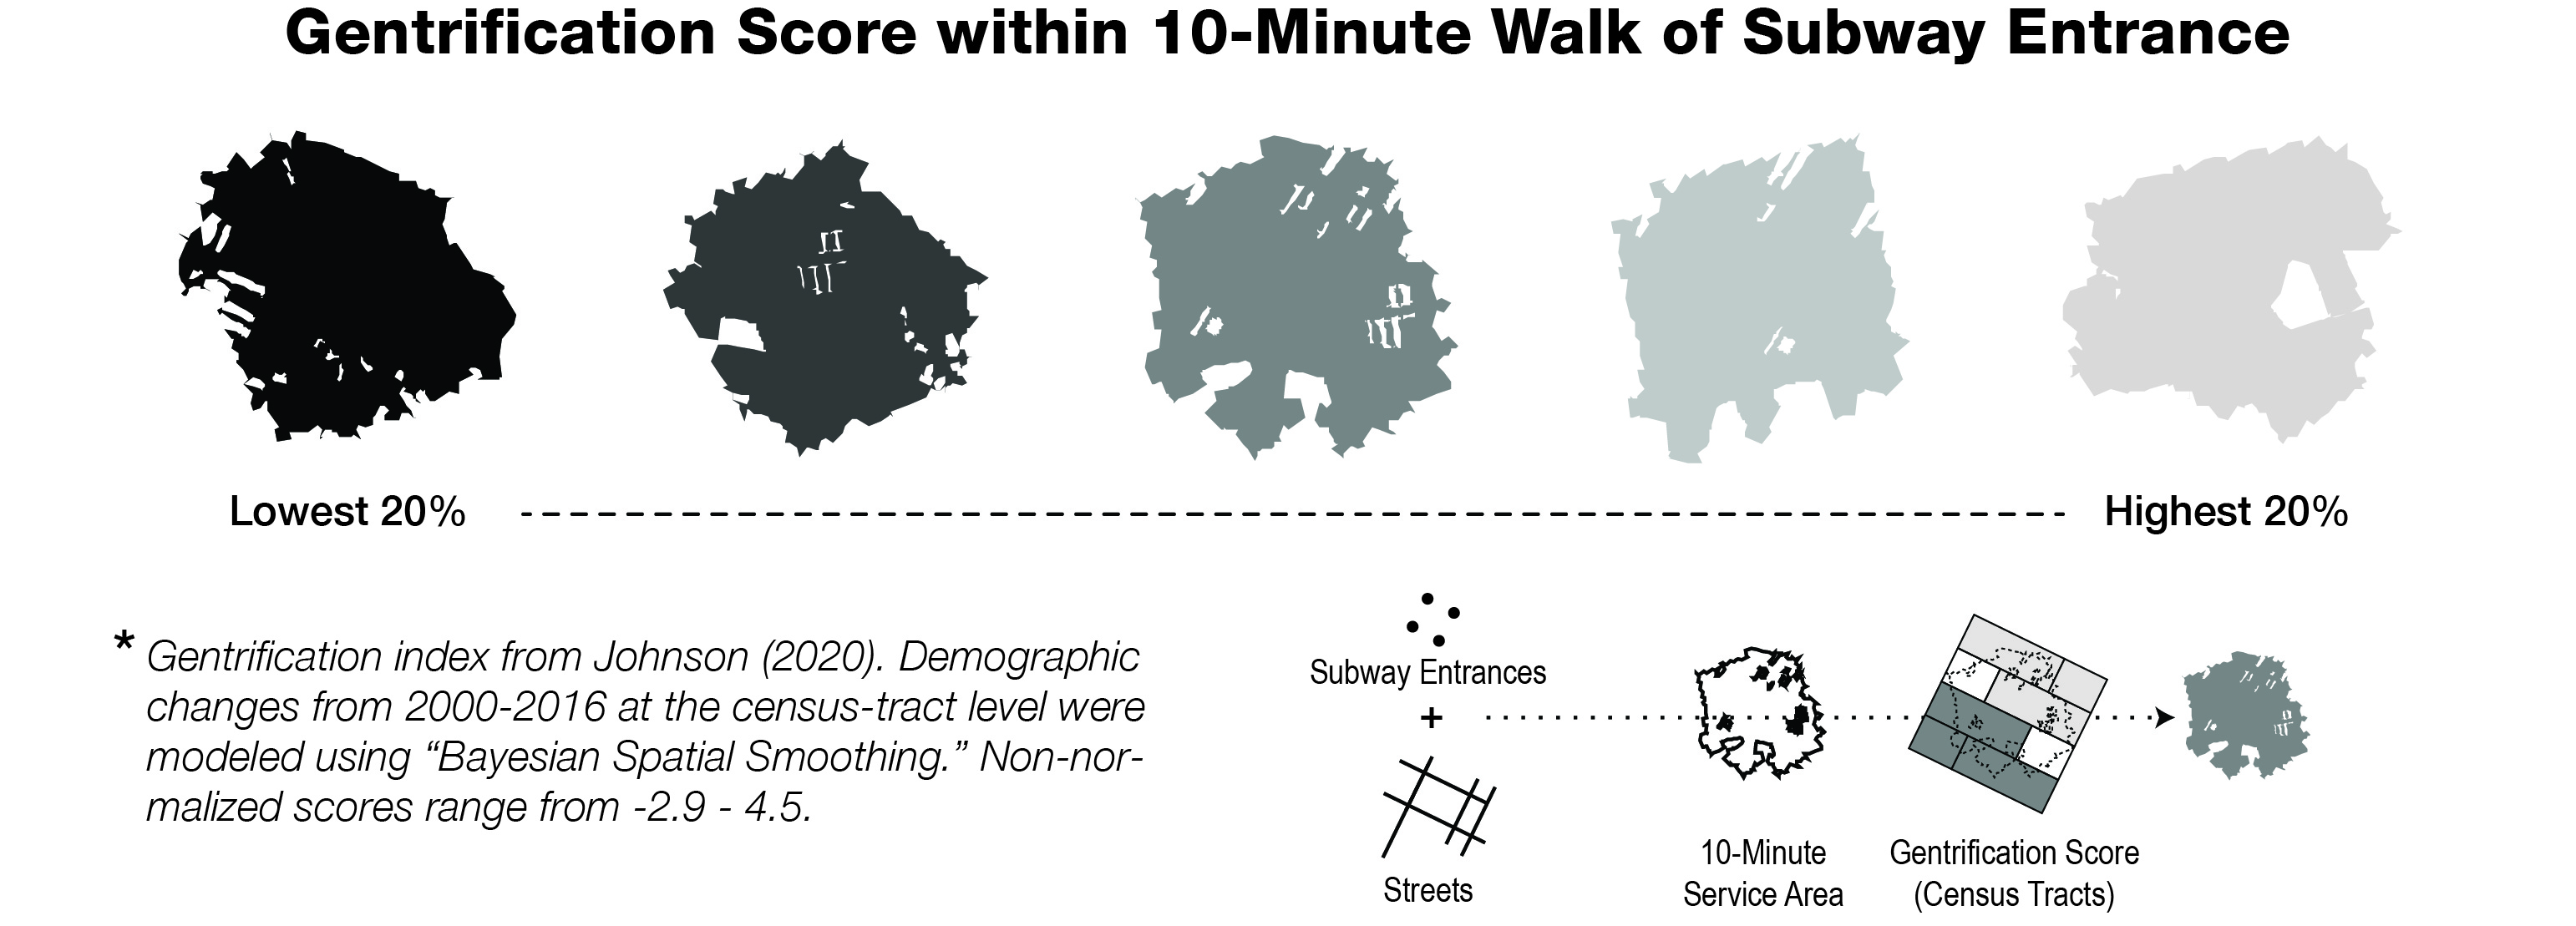
Click each station below in the interactive map to see the ridership number (measured in terms of entries across the entire year in 2021), the gentrification index of the area within a 10-minute walk of the subway entrance, and photos of the ads that we encountered in that particular subway station.
Analysis
Looking at the overall product types advertised across the R, most of the ads displayed have to do with selling a physical product and sharing important information through infomercials.
Zooming into specific subcategories of what we were advertised along the subway line, the vast majority of ads we saw related to the new OMNY service promotion by the MTA followed by NYC COVID notices.
When we look at information around specific organizations behind the R line ads, it is not surprising that MTA tops the list given the high proportion of informercials and OMNY ads that make up our dataset. This makes sense both given the history of the NYC subway system being “sanitized” for commuters over time as well as the fact that subway advertising has become one way of COVID-related information dissemination for commuters during the pandemic.
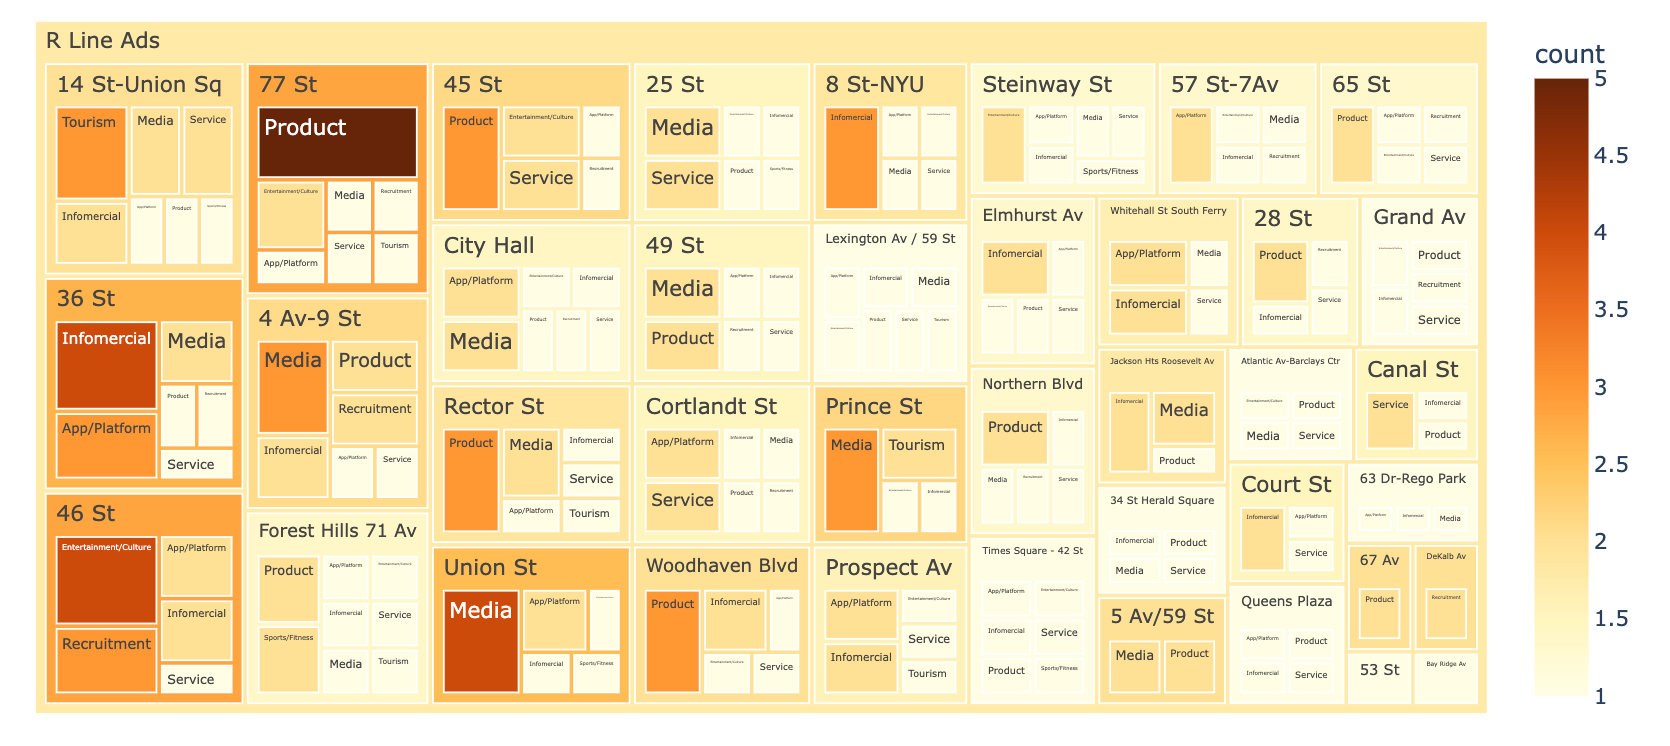
With these broader trends in mind, we wanted to see if the ads at individual stations followed this larger pattern where infomercials and physical product advertising featured most prominently in the mix of subway advertising. Interestingly, the tree map below which breaks down the product types advertised within individual stations across the R shows notable patterns in the mix of ads shown depending on where along the R a commuter might be. More importantly, not every station follows the larger R Line trend of infomercials and physical products dominating the specific station’s advertising landscape.
Case Studies
46th Street, Queens
Subway Entries: 232M / Year (2021) Gentrification Score: 0.17 (Relatively High)
Infomercials and physical products do not dominate the station advertising at 46th St. The station features a relatively high number of recruitment ads for various serivce-oriented organizations, as well as web-based productivity applications, and public art (specifically promoting Midtown Manhattan). This station also boasts extremely high ridership and a relatively high gentrification index score compared to the rest of the R line, which might explain the presence of these more up-to-date, app-based ads compared to the generally outdated ads we noticed in Queens.
Whitehall St, Manhattan
Subway Entries: 2.9M / Year (2021) Gentrification Score: -0.34 (Relatively Low)

Whitehall St was one of only two stations on the R Line where we noticed web-based application ads specifically for artificial intelligence and privacy platforms. This may be due to the commercial, office-going population based in the Financial District where the station is located.
Bay Ridge, Brooklyn
Subway Entries: 0.8M / Year (2021) Gentrification Score: -0.11 (Low)
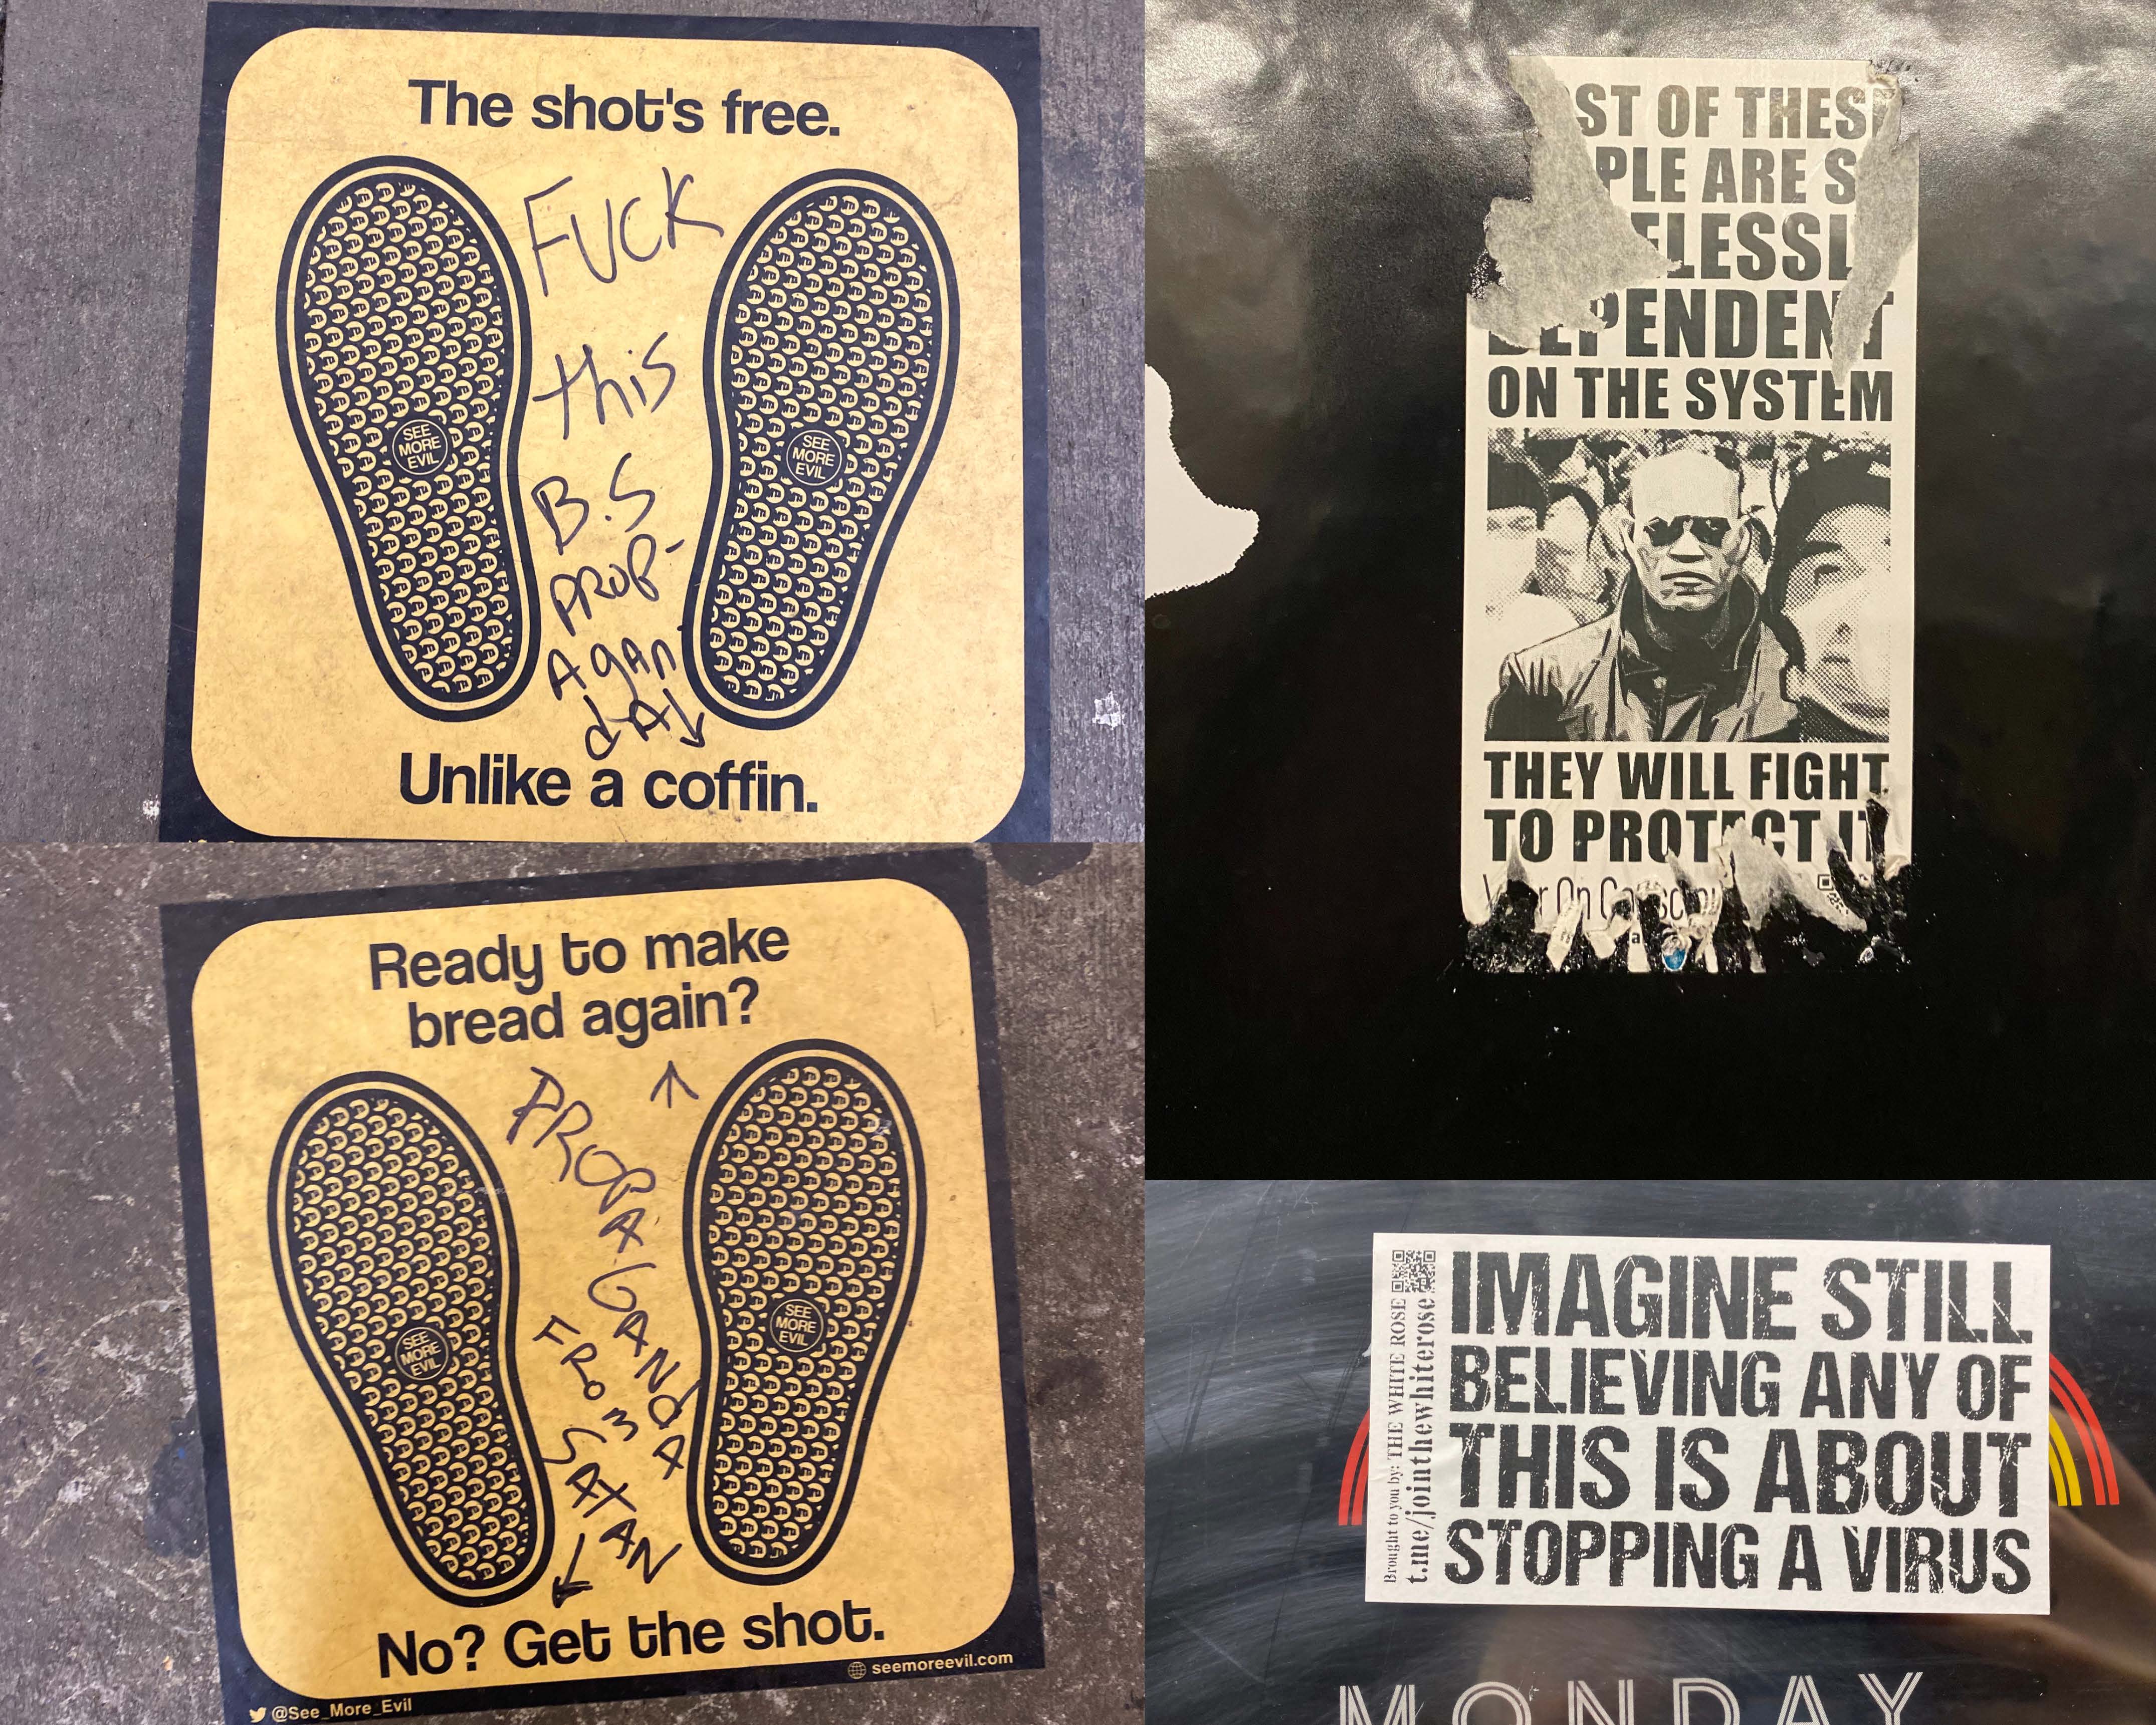
One of the most surprising things we noted during our data collection was that this station, the start/end of the R in Brooklyn, had no advertising at all. The station’s low gentrification index score and low ridership may explain the lack of advertising at this stop, even subway infomercials. One other reason for this might be that some stations on this end of the R were recently renovated. This station is also where we saw moments of non-sanctioned, infrapolitical friction and communication—where informally-made social distancing platform markers mimicking the style of MTA’s official pandemic-related signage (the photo collage at the top of the page) had been vandalised.
Conclusion
While there are clear overarching patterns in subway ads across the R line, zooming into specific stations tells another story. Subway ads are tailored to their specific commuting audiences and we saw subtle changes in advertised products with increased ridership and higher scores on the gentrification index. For example, apps (specifically for food delivery, productivity, and information privacy) tended to be advertised in areas with higher ridership and higher gentrification. And as stations like Bay Ridge proves, lower ridership and lower gentrification stations tended to see fewer ads—with more of them being informercials by public agencies like the MTA—or sometimes none at all.
This project aimed to capture the landscape of advertising in just one moment in time and on one subway line in NYC. Further research can consider comparing advertising across several lines to explore the infrapolitical tensions and communications between subway advertising and commuters.
Bibliography
Larkin, Brian. The Politics and Poetics of Infrastructure. Annual Review of Anthropology 42, p. 327-343. 2013.
MTA. MTA R Logo [Logo]. https://pbs.twimg.com/profile_images/378800000280008274/bee3c9b2514dd2bec33390fce8cf36fb_400x400.png
NYC Subway Ridership.https://www.subwayridership.nyc/
Outfront Media. Subway. https://www.outfrontmedia.com/media/transit/subway
Scott, James C. Infrapolitics and Mobilizations: A Response. Revue Française d’études Américaines 1 no. 131, p. 112-117. 2012.
Data
Johnson, Glen. Gentrification Index for NYC (Excel). Harvard Dataverse. https://doi.org/10.7910/DVN/O56ZMB. 2020.
NYC Dept. of City Planning. Borough Boundaries (Shapefile). 2016.
NYC Dept. of City Planning. LION (Shapefile). 2022.
Whong, Chris. New York MTA. NYC Subway Turnstile Counts - 2021 (Excel). https://qri.cloud/nyc-transit-data/turnstile_daily_counts_2021. 2021.