Pandemic Urbanism: Reflections on the Spatial and Rhetorical Devices of the COVID-19 Crisis
Context
It is May 8, 2020 and the coronavirus pandemic steadily continues on its disruptive path. It is a conflict of growing proportions that, in a few short months, became the primary structuring principle of organisms, societies, cities, and infrastructural and global networks. Though the “end” is far from sight, we know that conflict can be destructive and also constructive when it comes to our environments. Prompted by the theme of this course, the architecture school and university we share, and the simple fact that “we’re living it,” this project aims to reflect upon and analyze the documented aspects of the novel coronavirus in order to better understand the present spatial effects and future implications.
The project shares insights into the chronology of unprecedented events; a lexicon of spatial terminology indigenous to the pandemic; a defense of the efficacy of the “Flatten-the-curve” movement; and deeper reflections on the data, methods, and visualizations circulating at present.
Dispersion

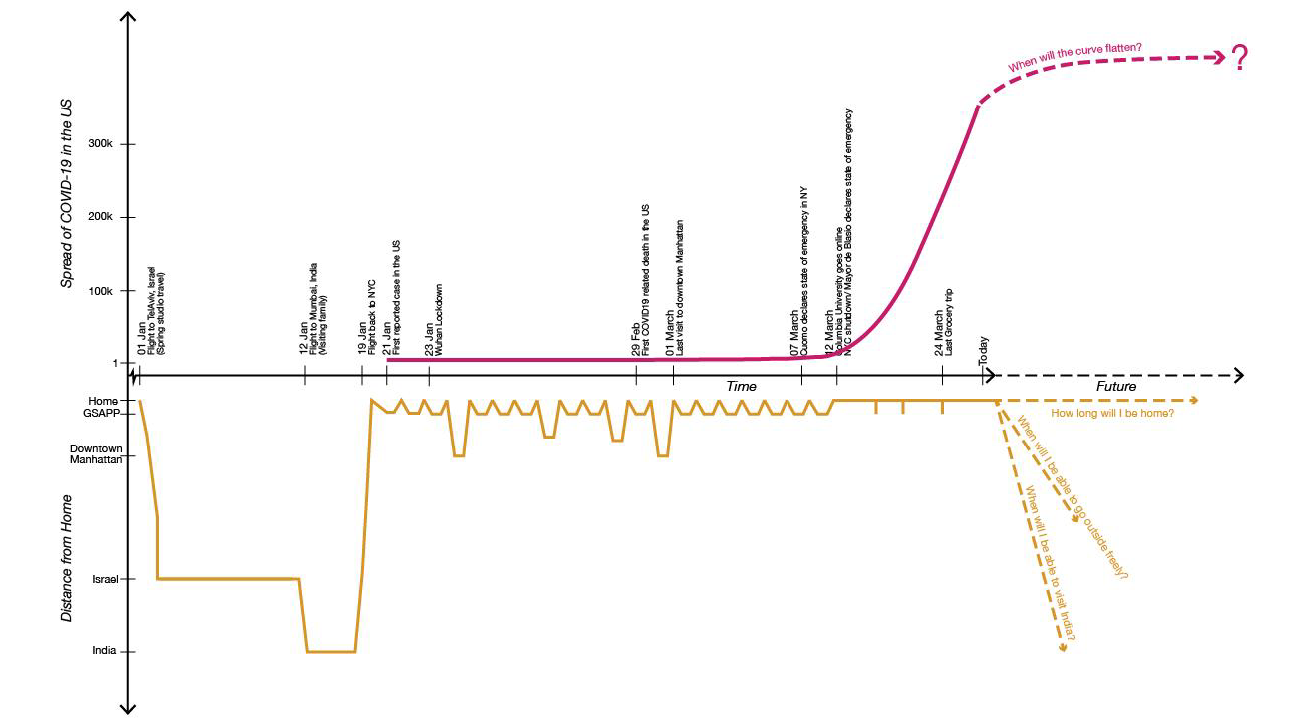
On March 12, 2020, the President of Columbia University, Lee Bollinger, issued the following statement: “in order to reduce the density of our residential environment, while respecting the interests and needs of students who have reason to continue to remain in residence on campus, we are instituting three critical decisions: (1) The University will remain open and functioning; (2) All classes for the remainder of the semester will be conducted online; and (3) We encourage any students who are able to move out of undergraduate residence halls for the rest of the semester to do so.” Thus, there were many cancelled spring break plans (March 16-20) due to the mounting travel restrictions. On March 11 the U.S. barred the entry of all foreign nationals who had visited China, Iran and a group of European countries during the previous 14 days.1 The State Department on March 19 raised its global travel advisory to a Level 4, a recommendation that U.S. citizens either remain in place or return home. While on March 20, the White House Coronavirus Task Force said it was closing the border with Mexico and Canada to any nonessential travel, beginning March 21. By March 27, most students left Columbia to work remotely. Some went home, others stayed in New York.
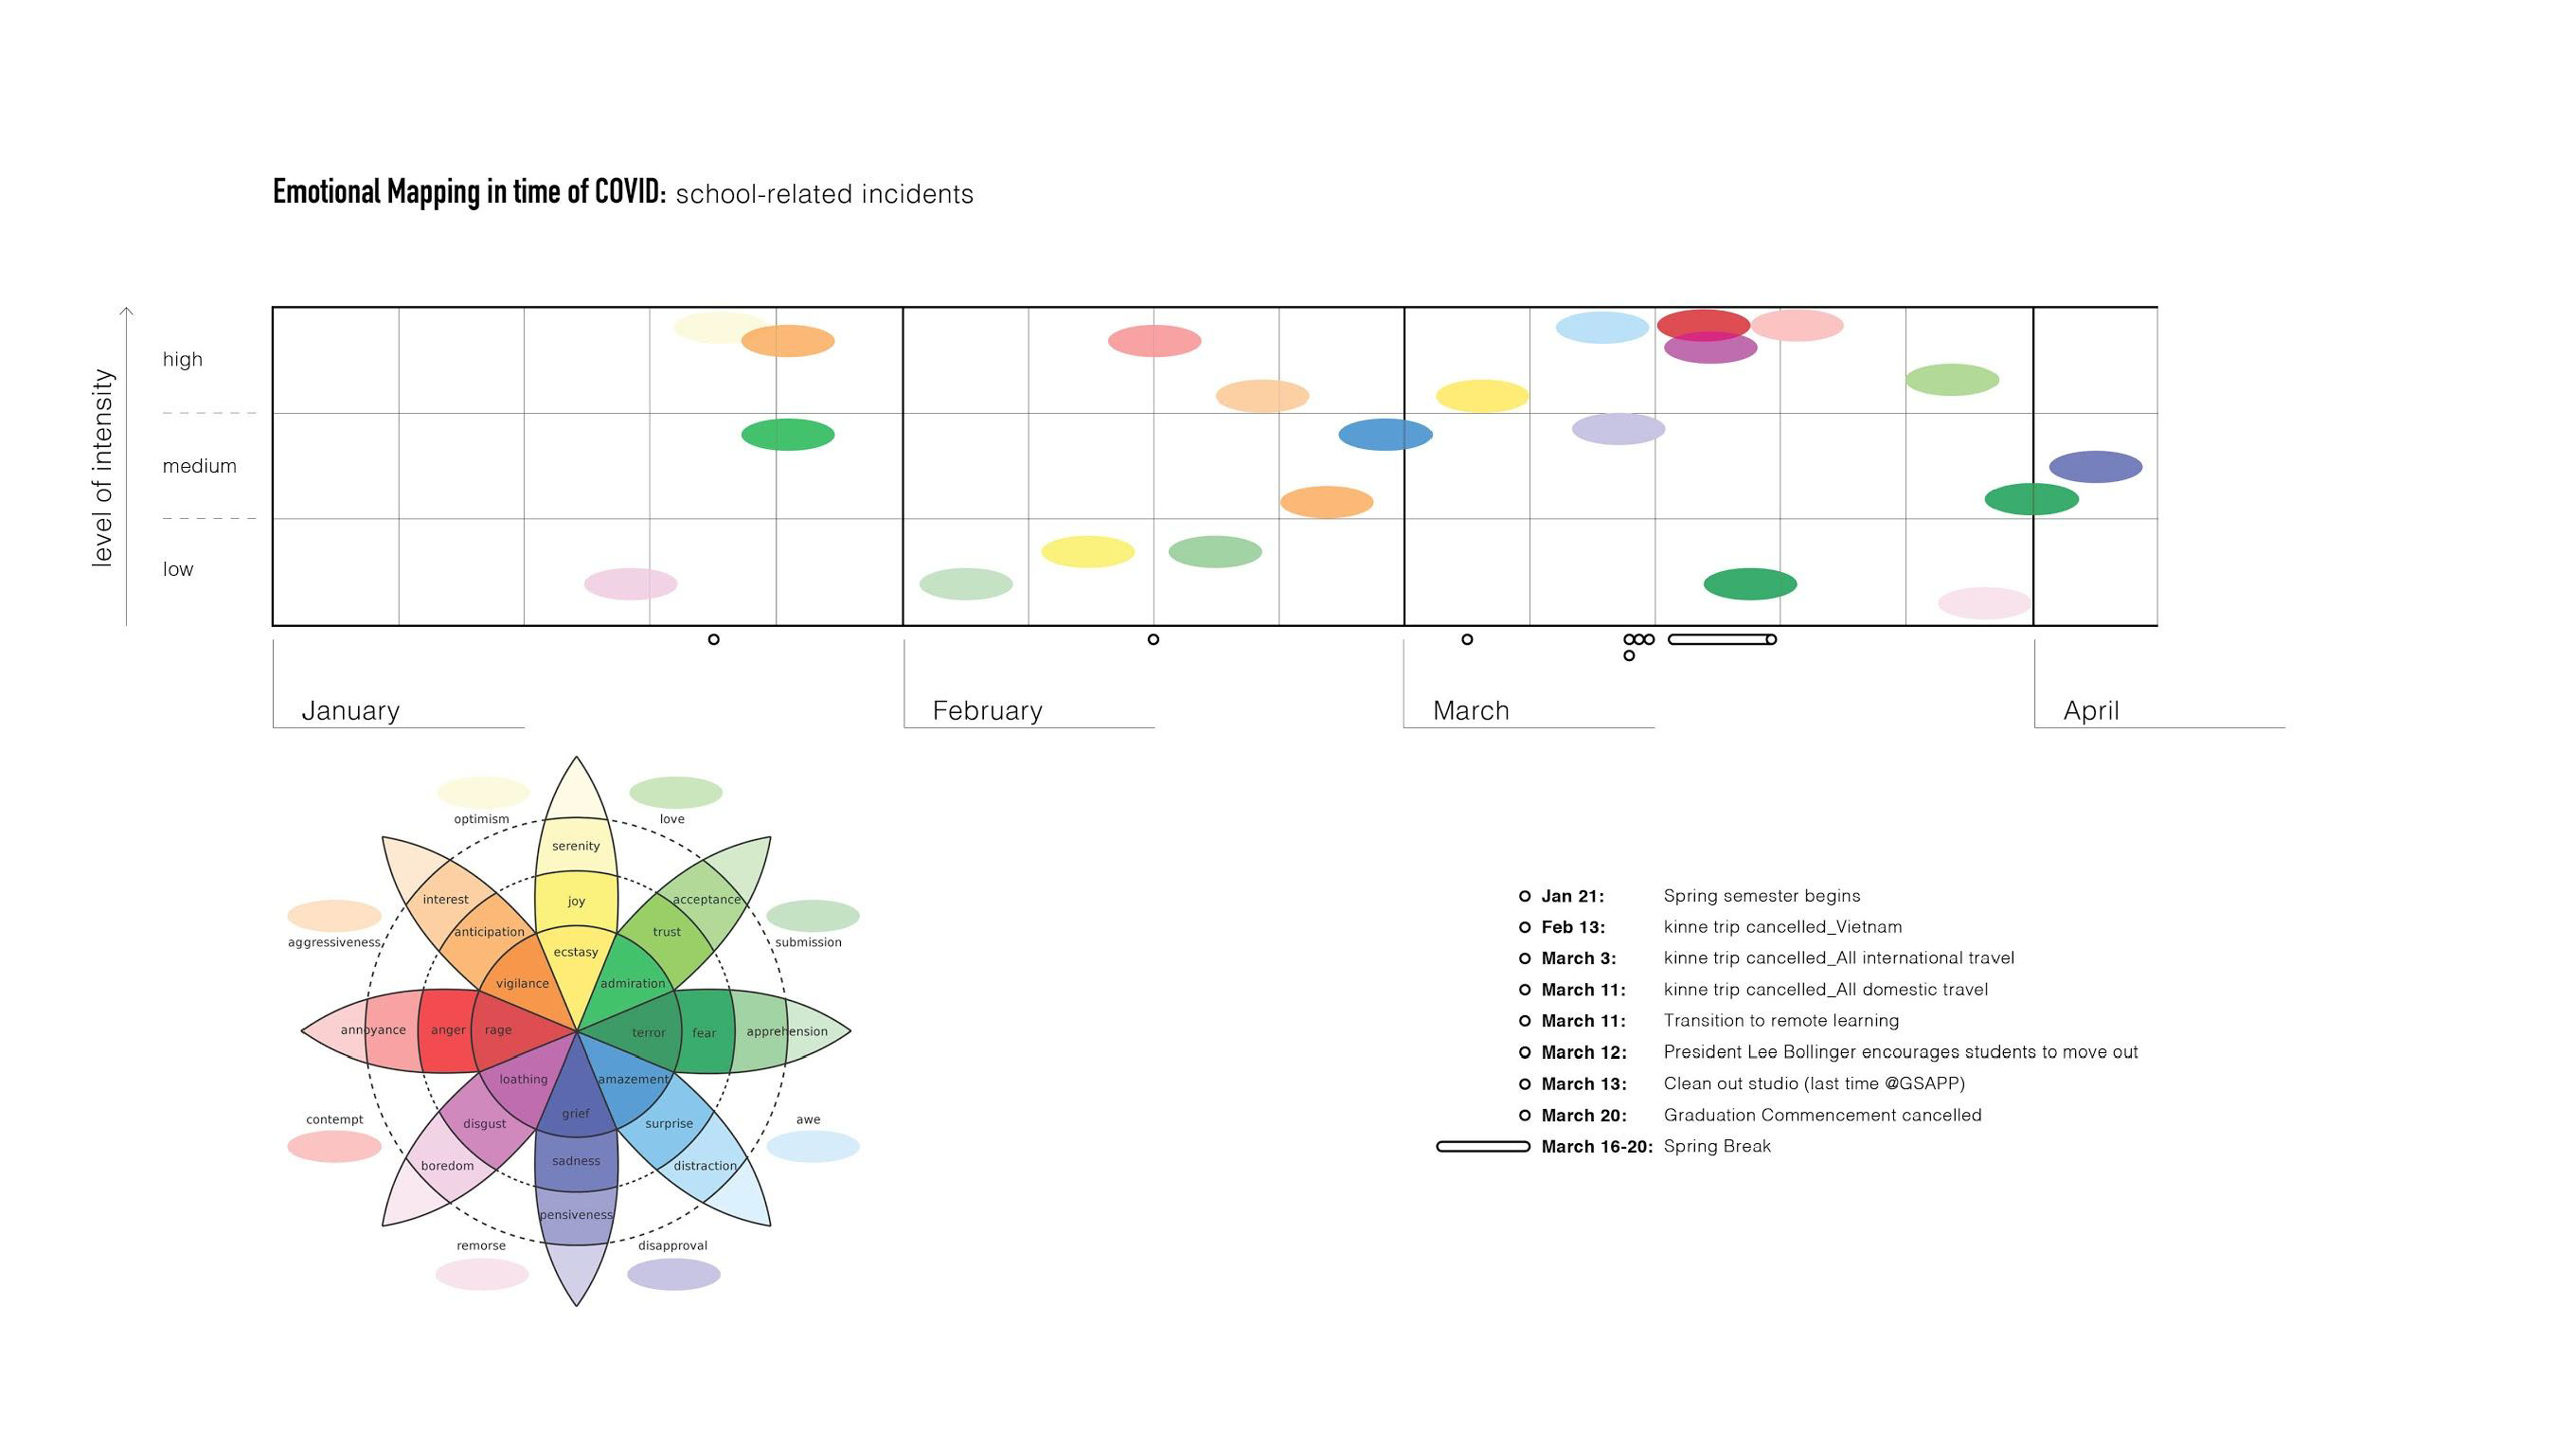
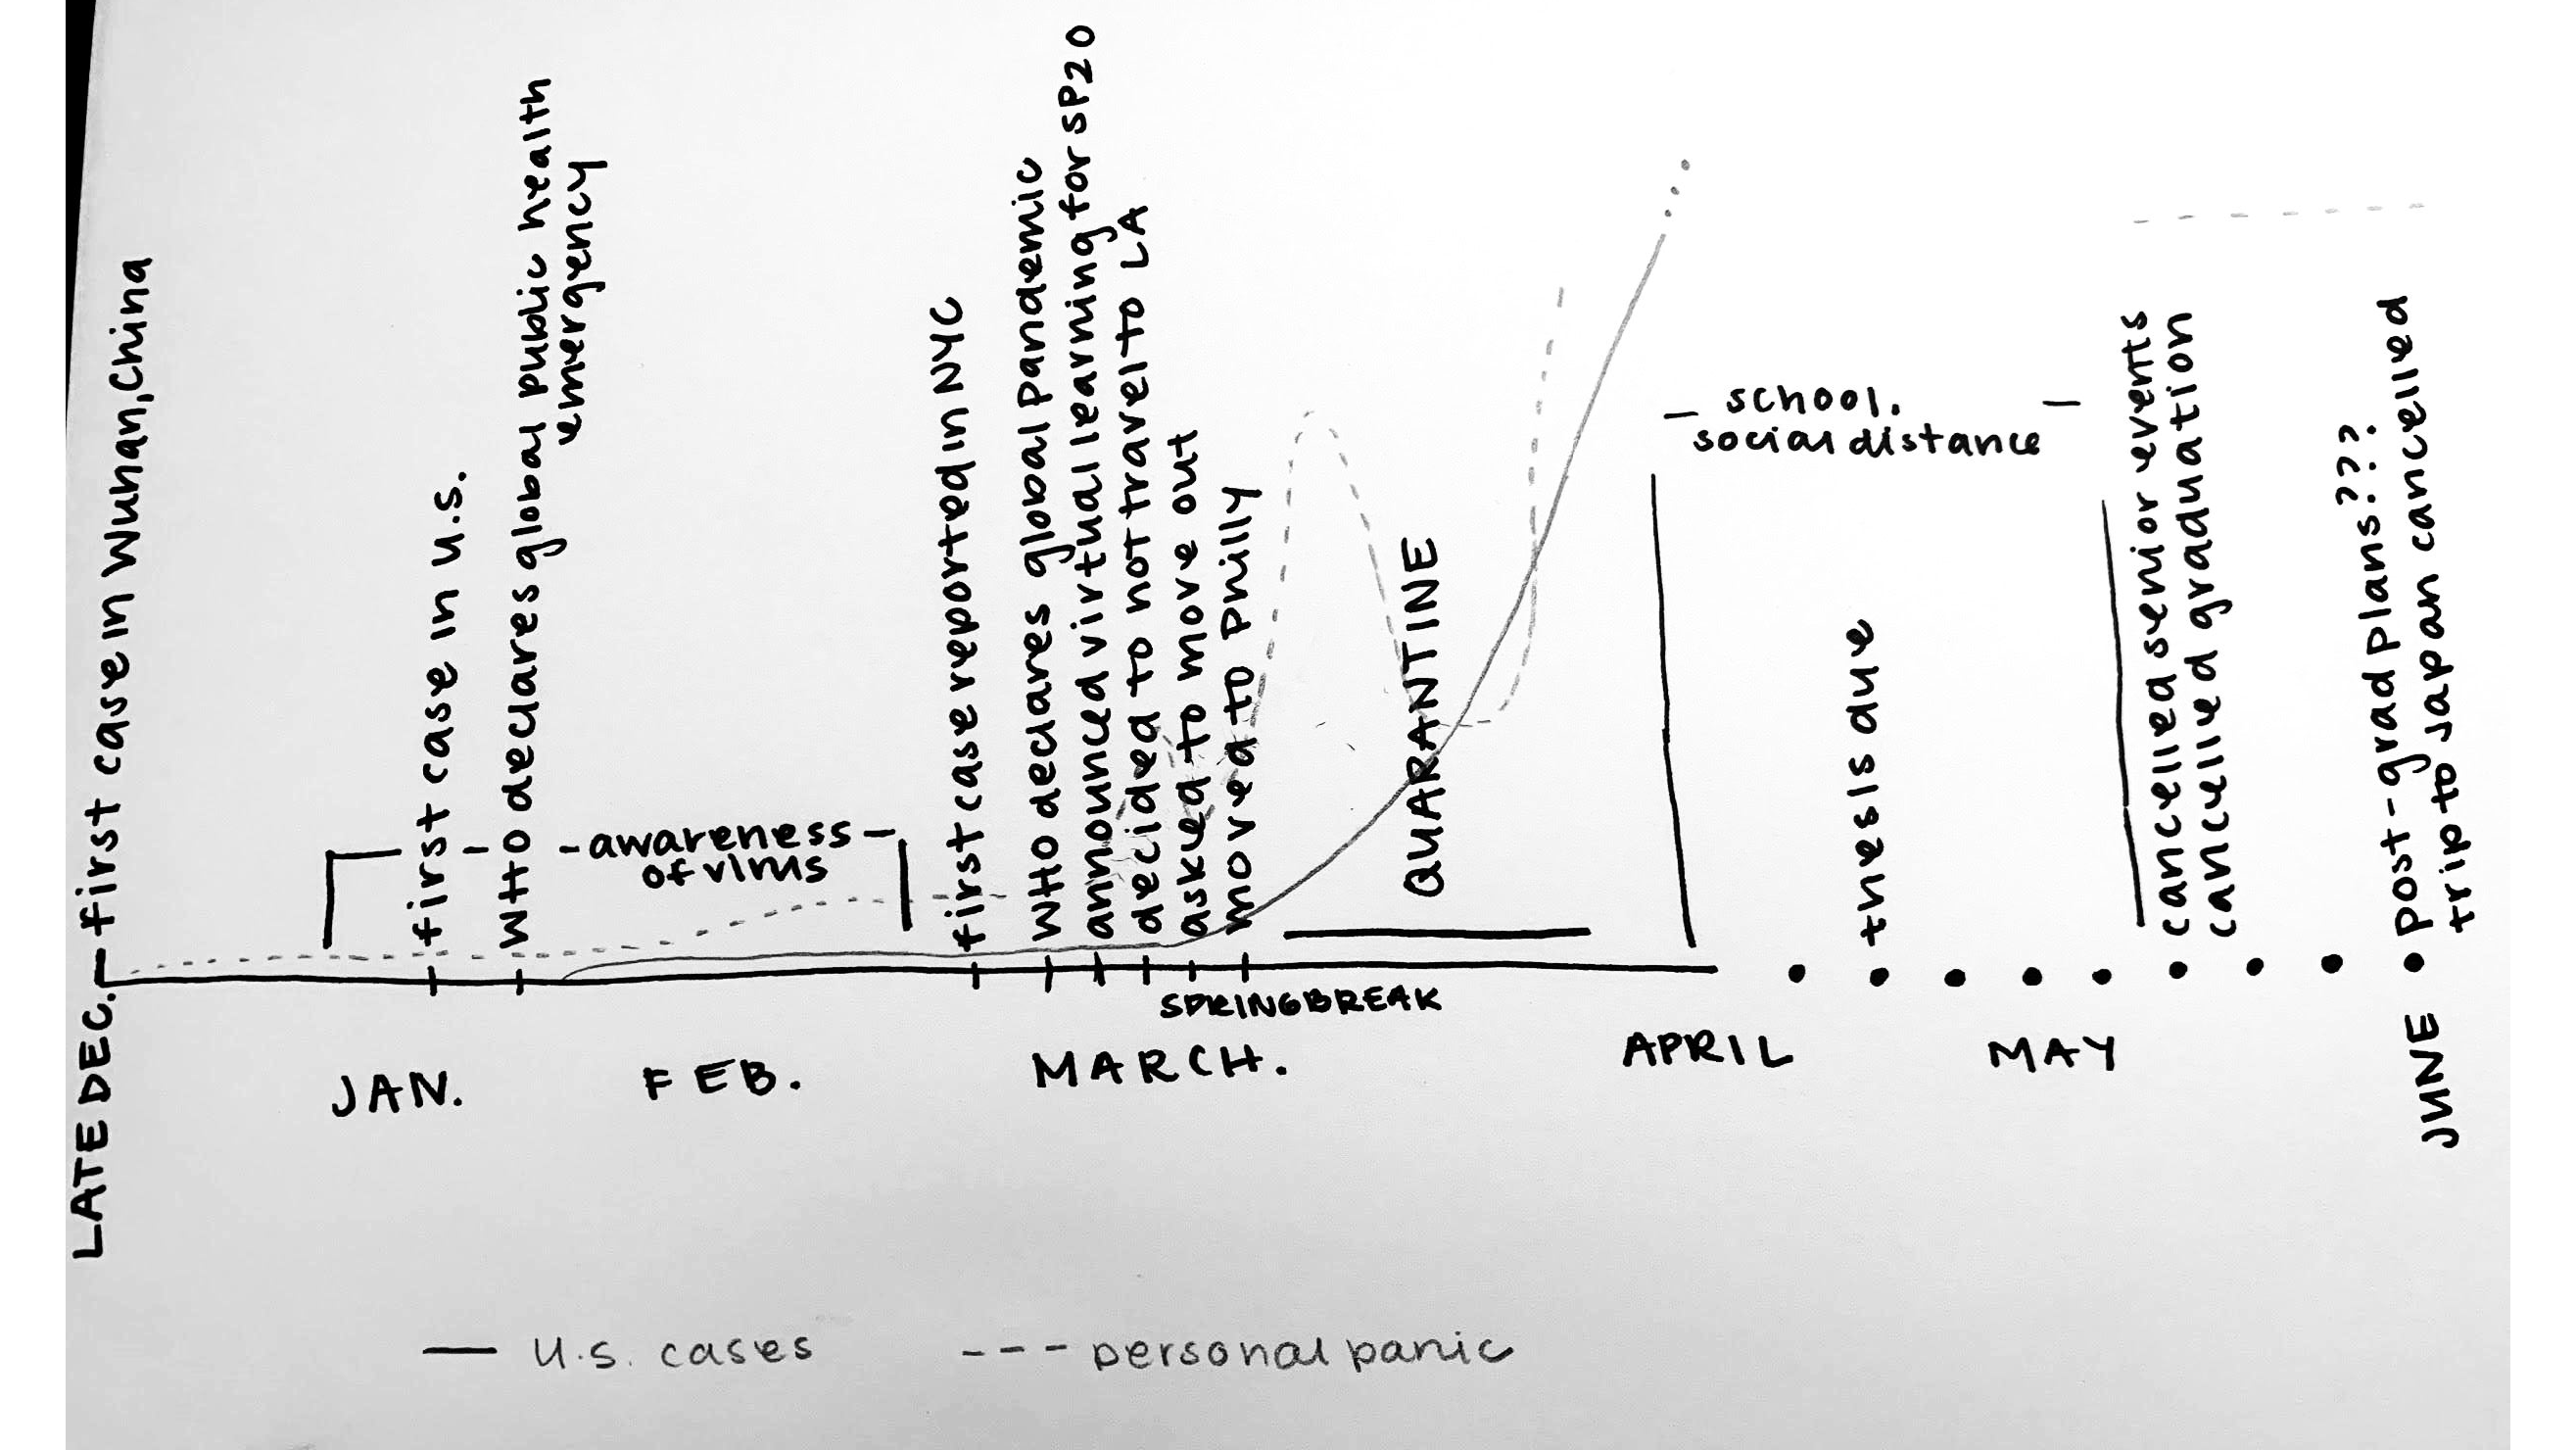
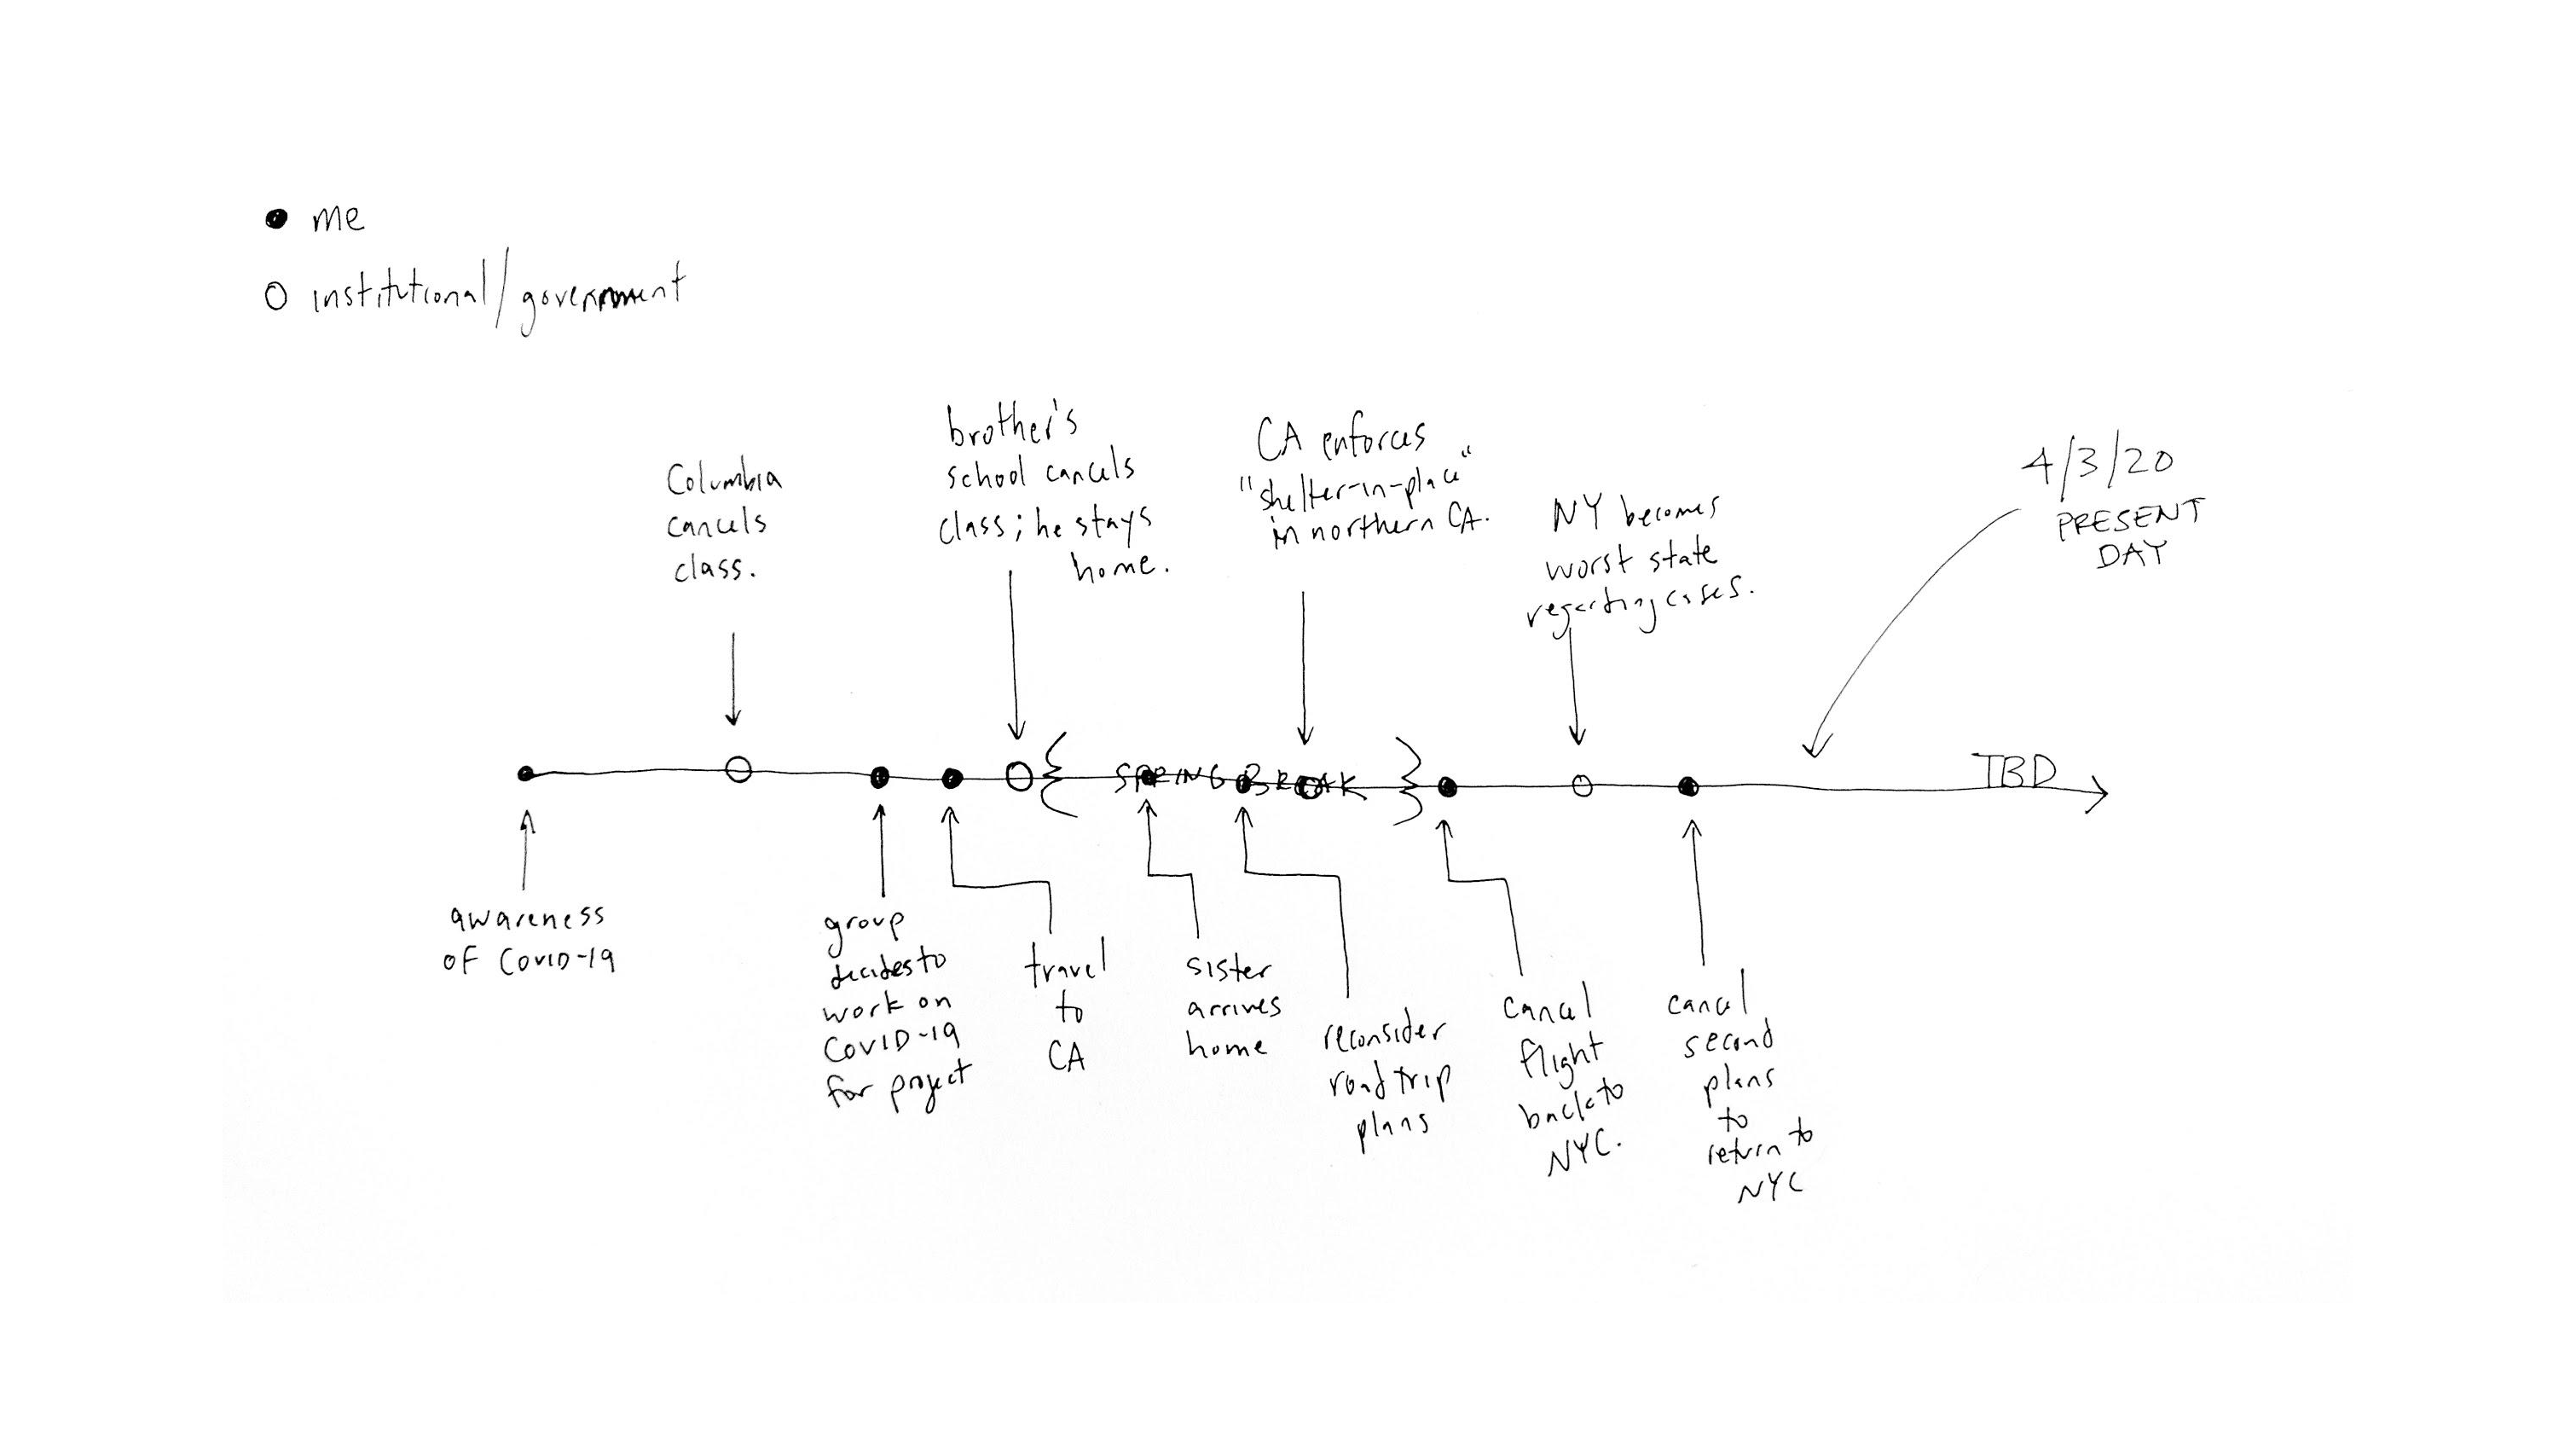
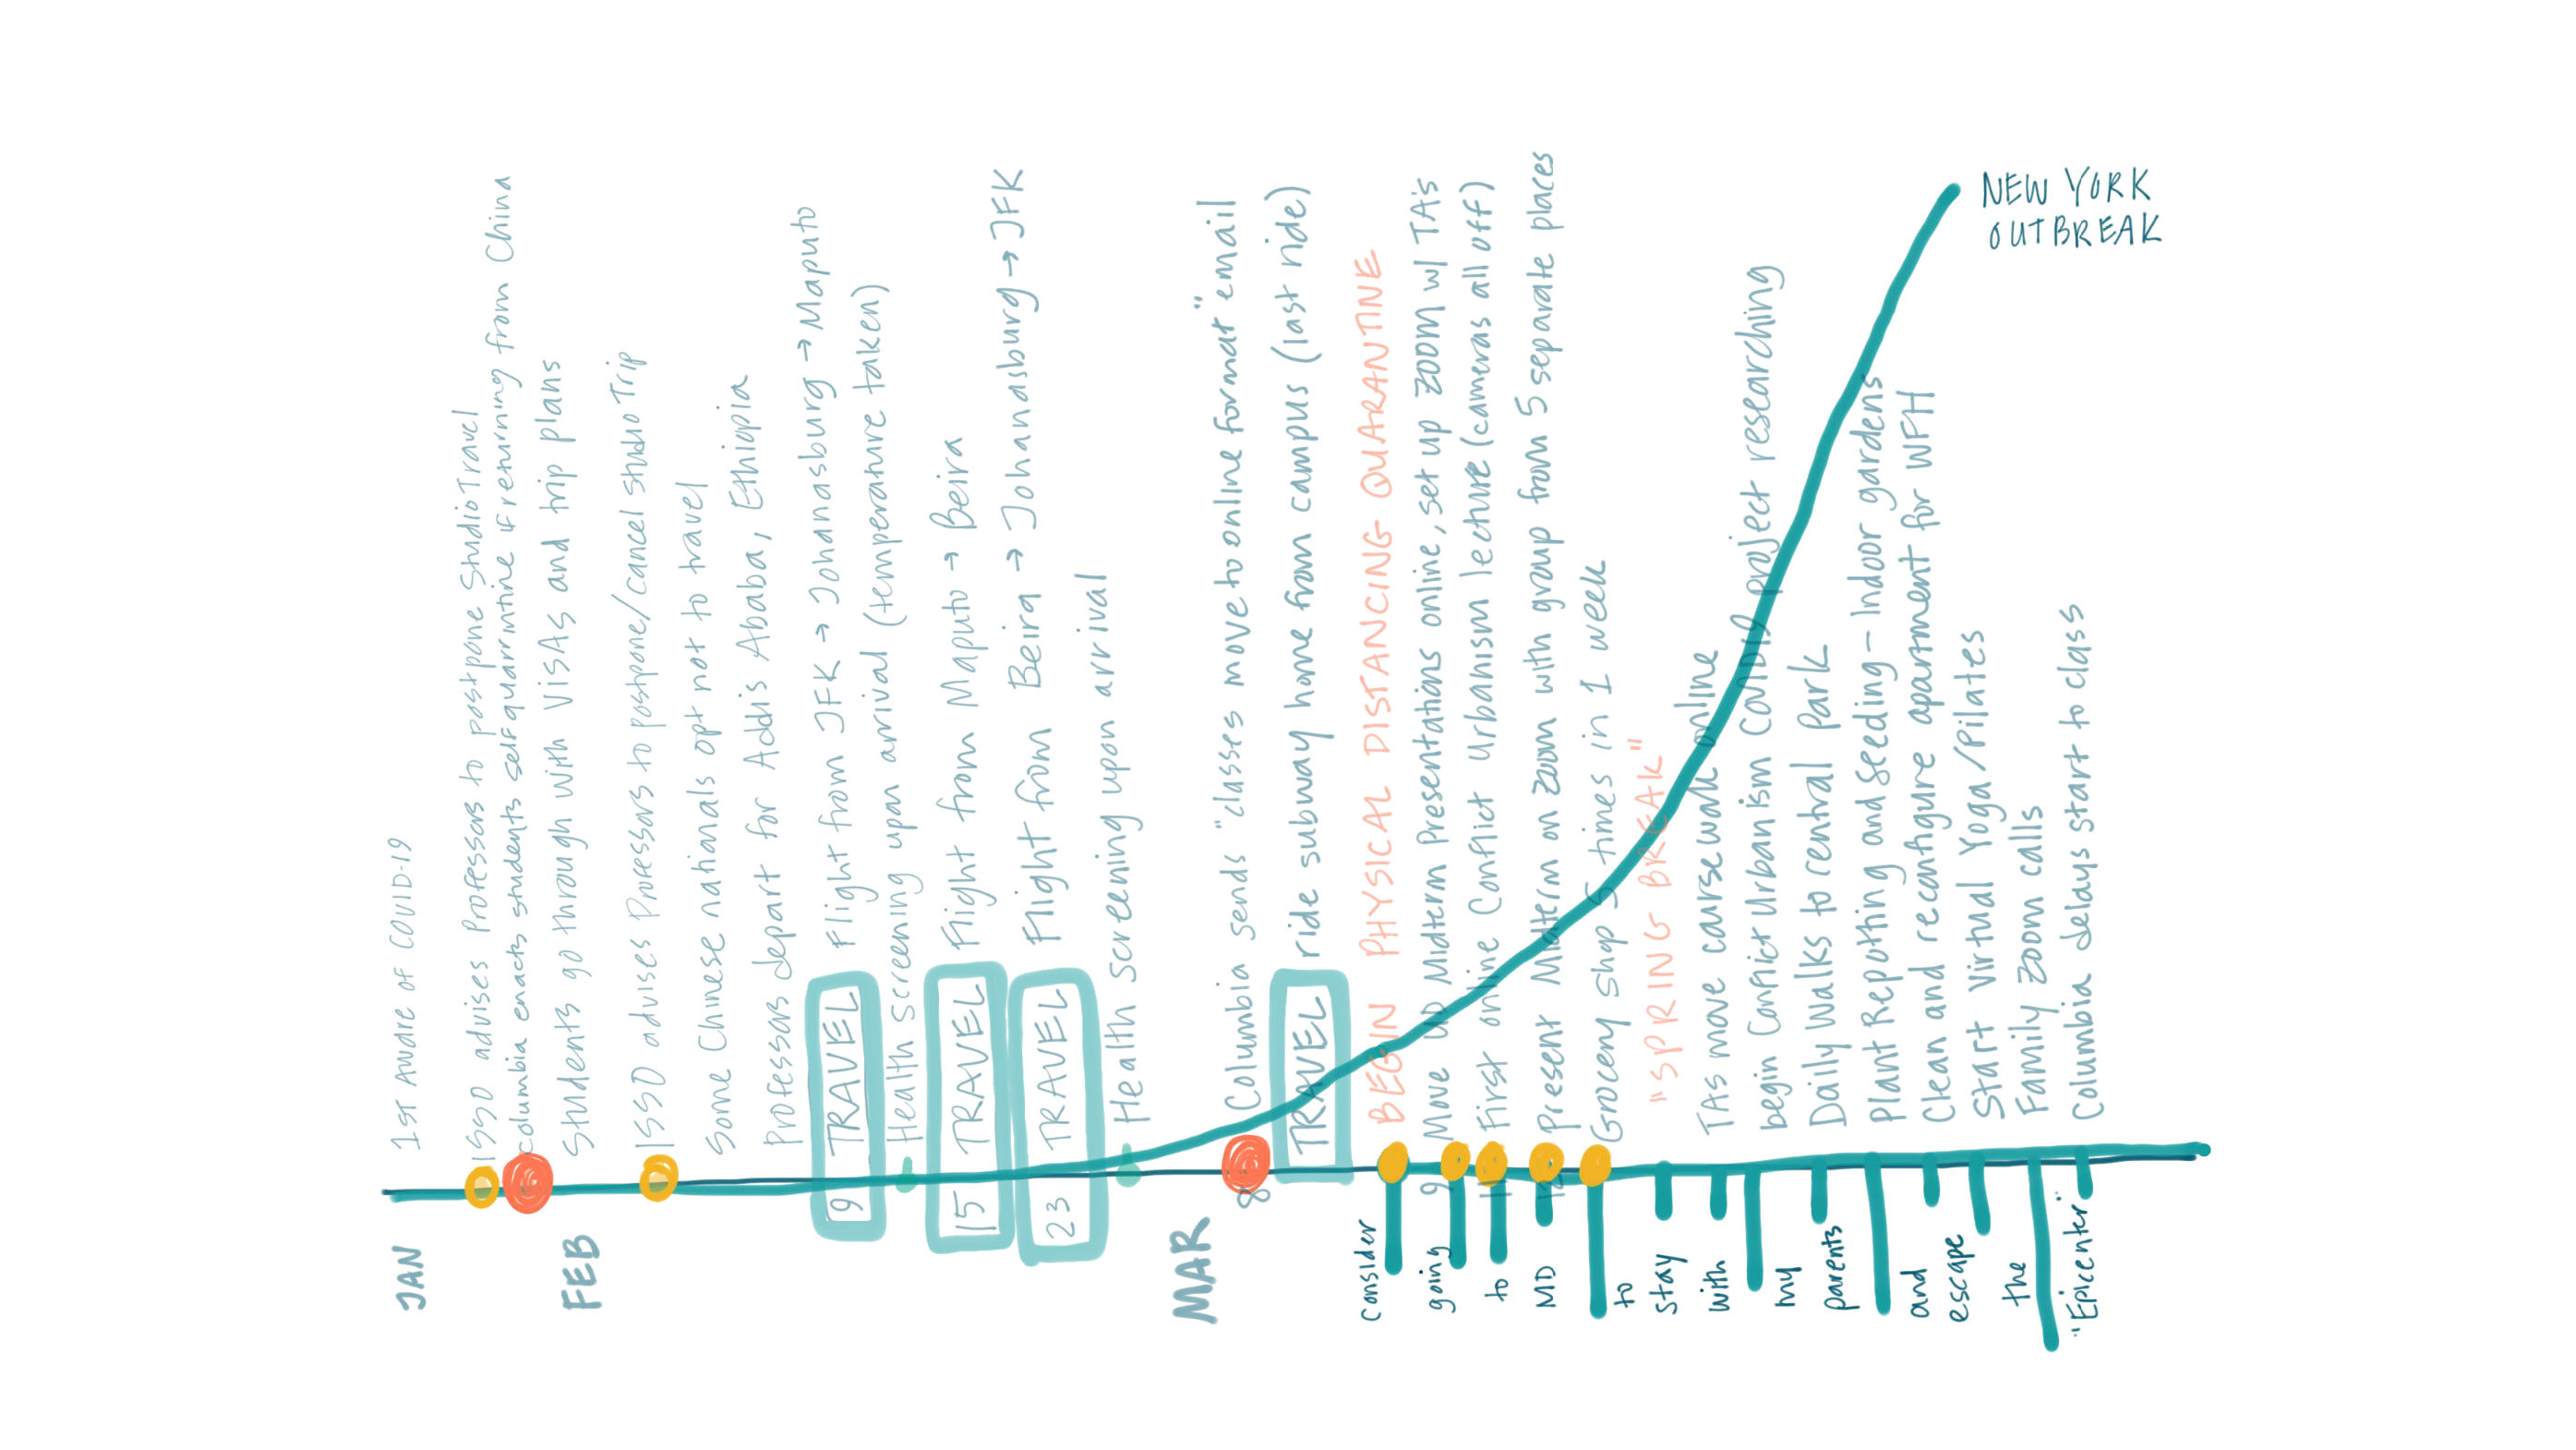
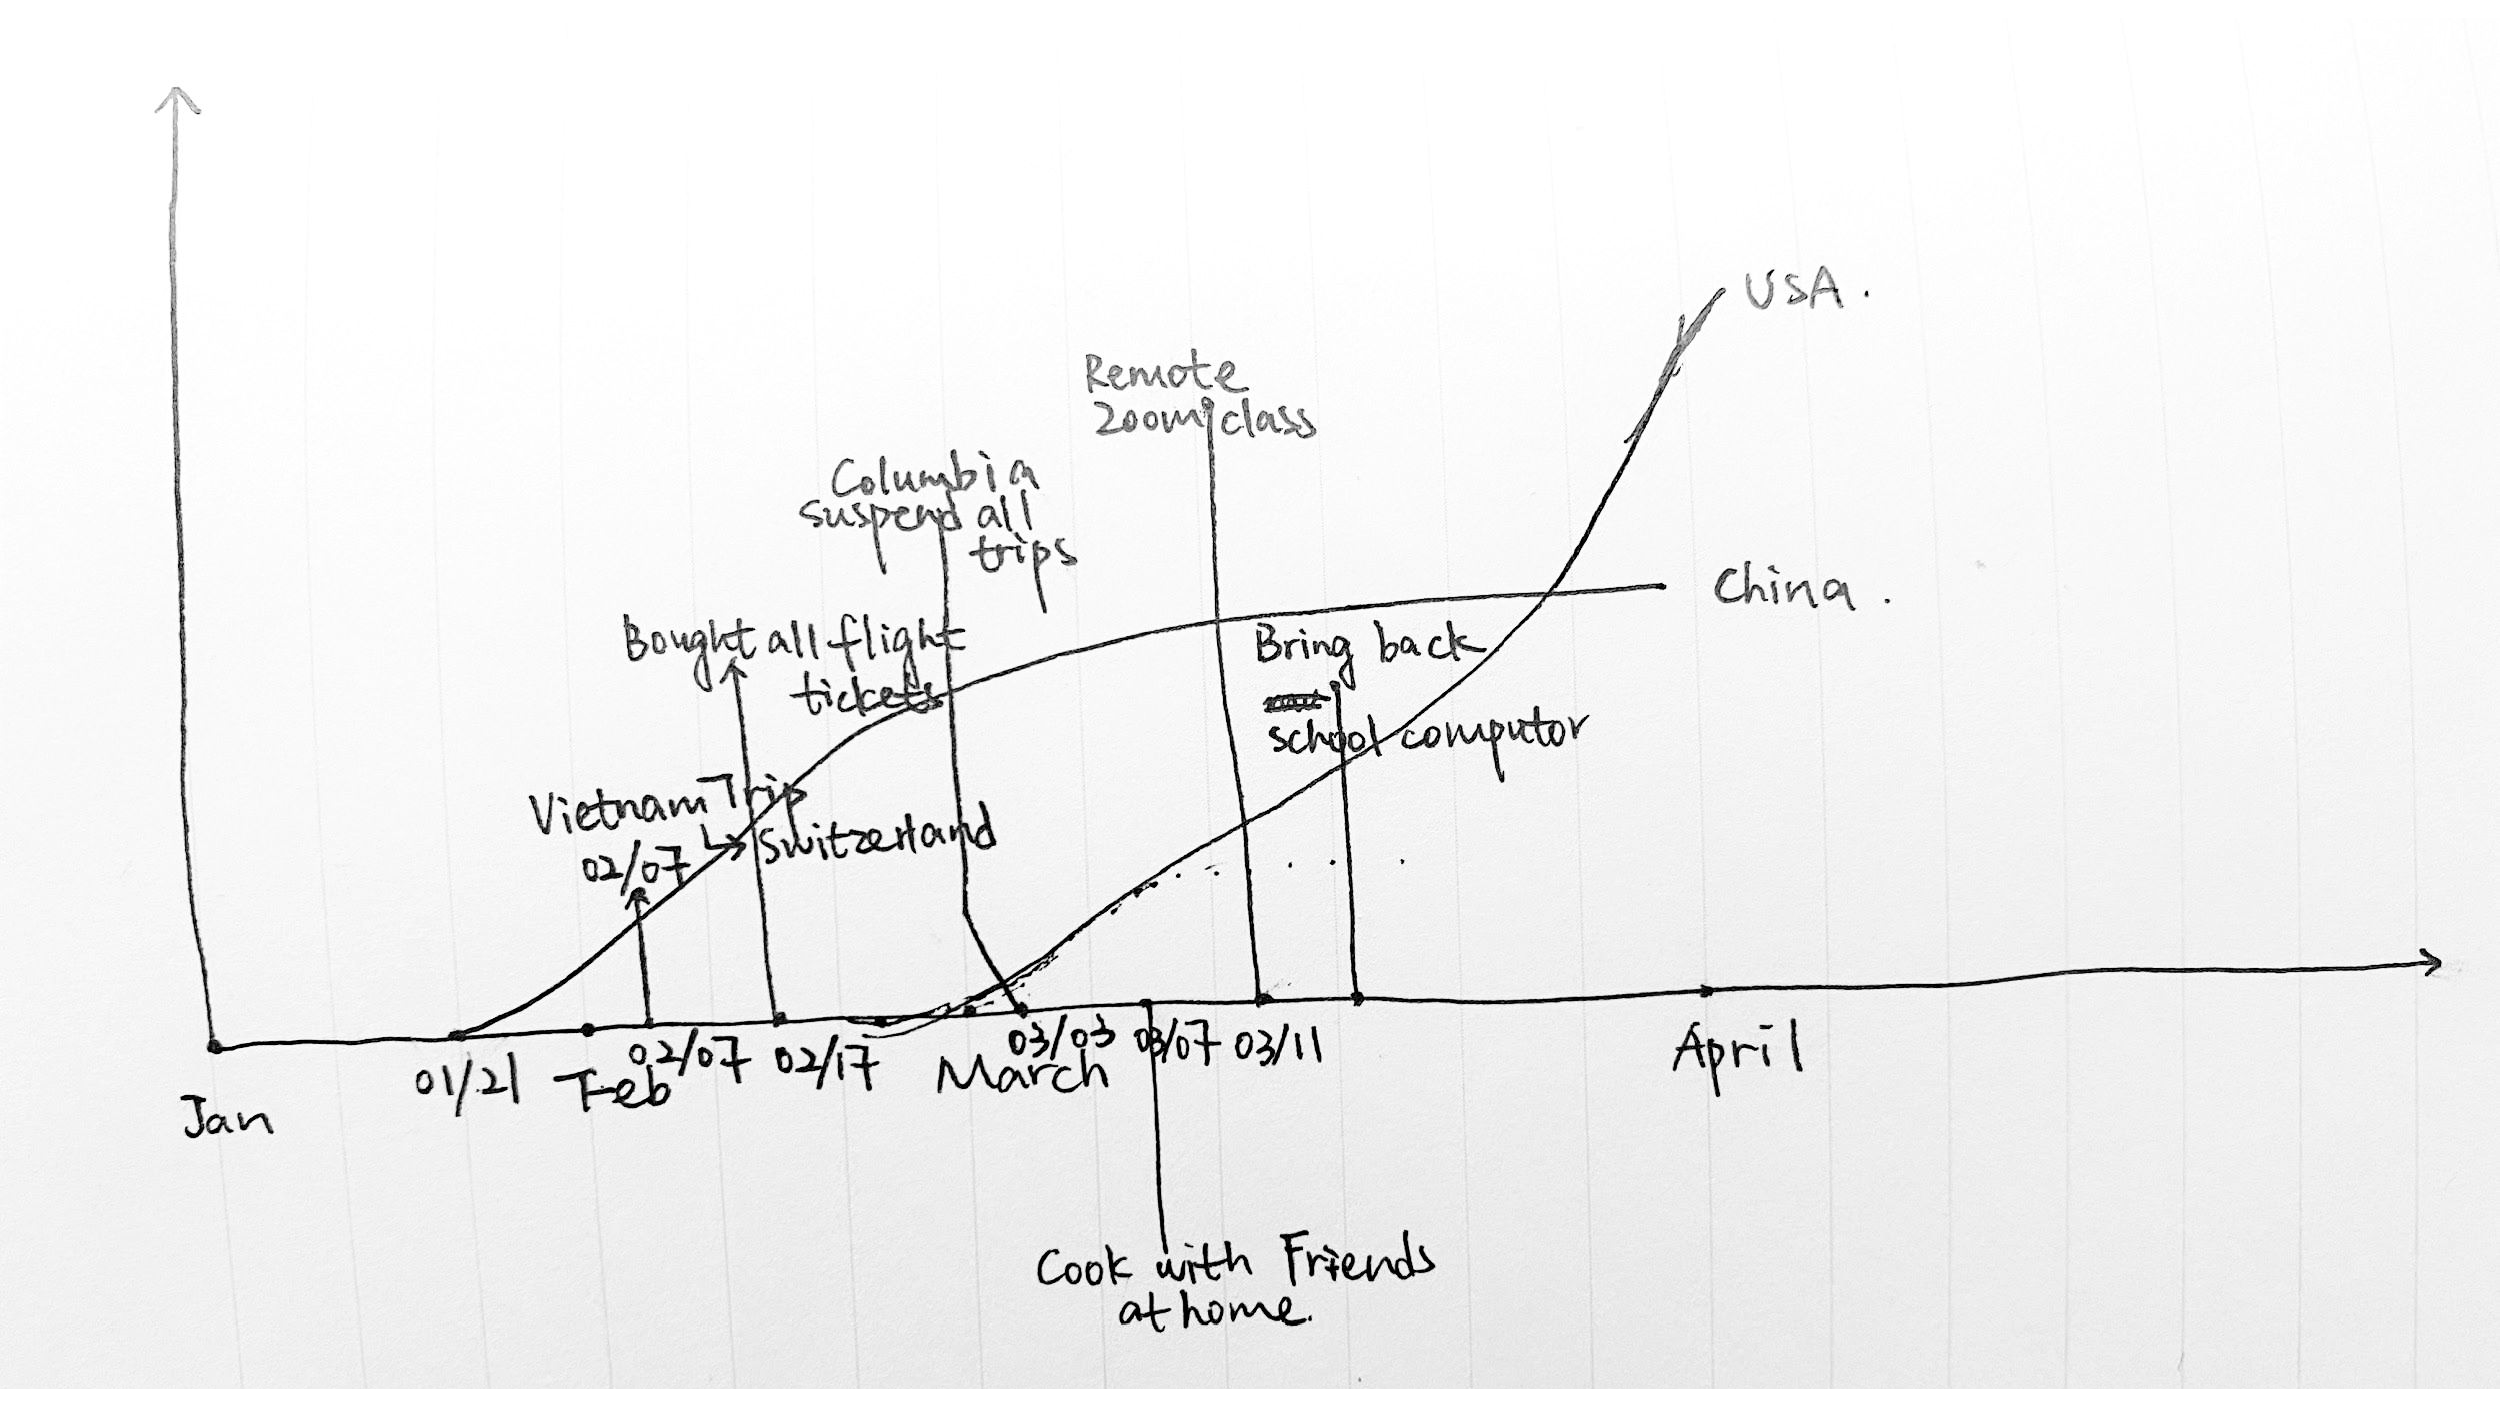
Our awareness of the crisis evolved over time as restrictions and cancellations progressed. In an exercise early in the forming of this project, we found the act of mapping Columbia University and GSAPP events useful in understanding the multitude of personal and institutional circumstances.
Timeline of University Events
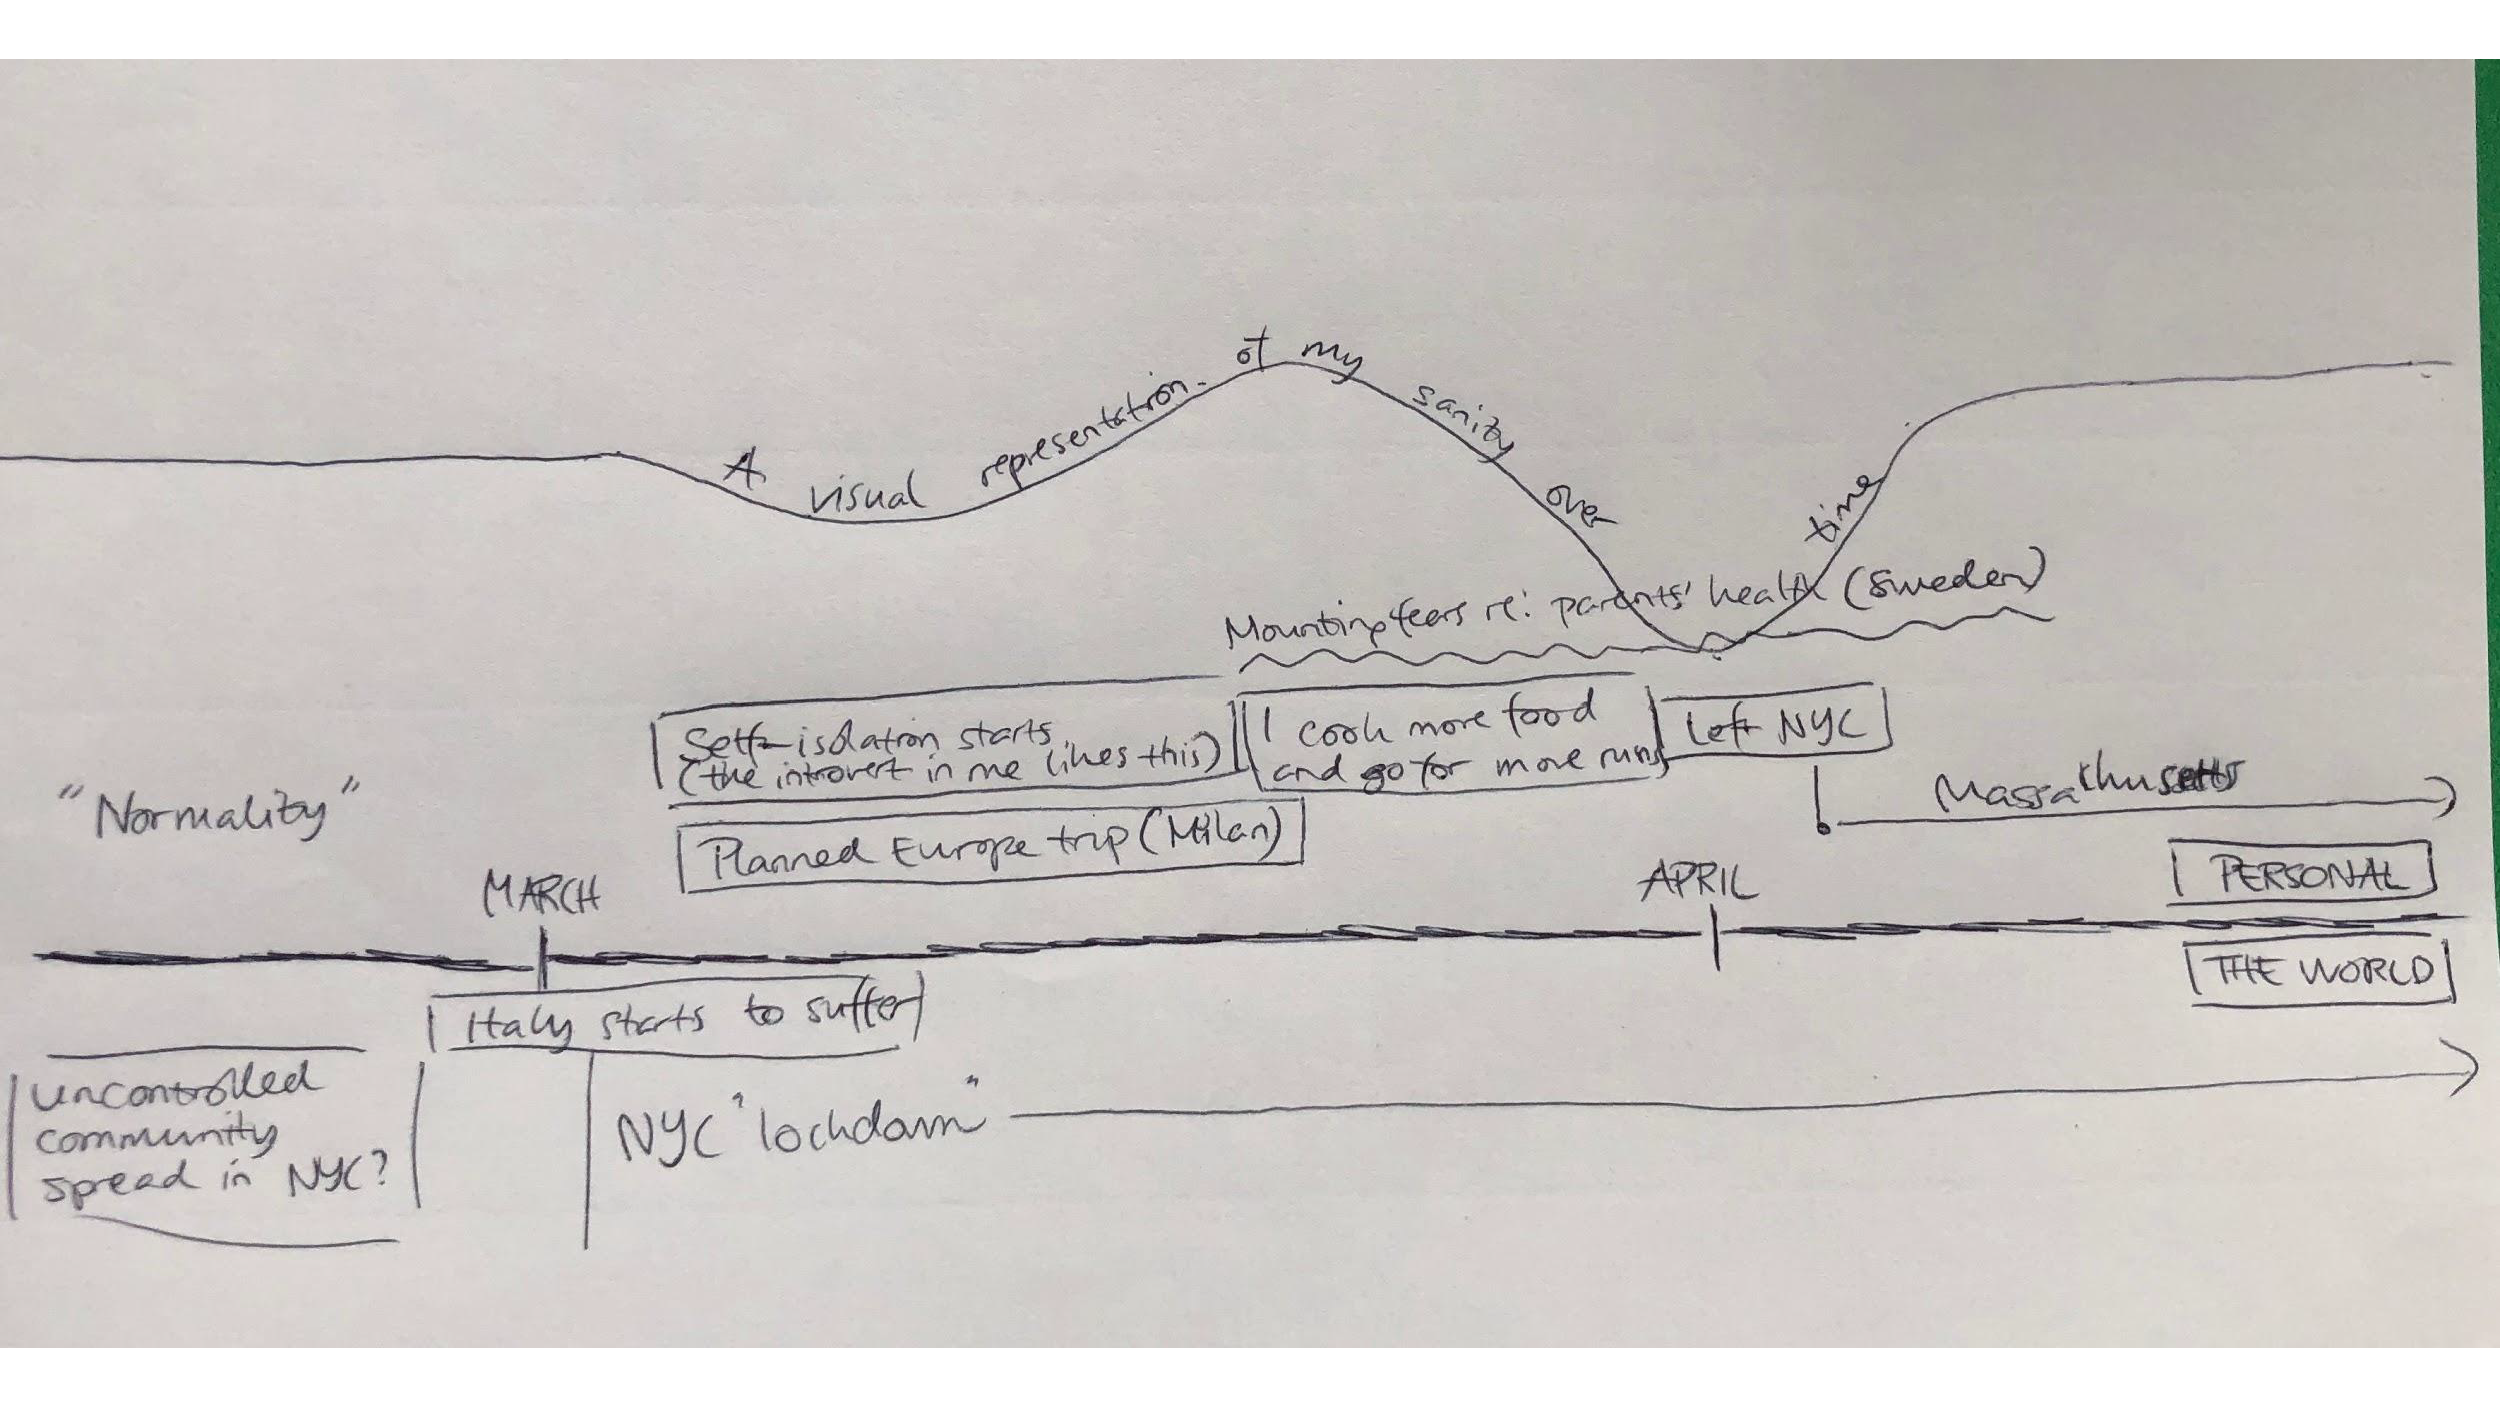
Students also drafted their own personal timelines according to their own experiences.
Lexicon of Spatial Terms
Moving beyond our class’s dispersion, beyond the University’s timeline and lens through which to observe the crisis, our following explorations attempt to represent at minimum three critical demographics: Essential Workers, non-essential workers, and those who have experienced serious disruptions to their livelihood on account of falling ill or having a close relation compromised by the virus. From the many mediums and platforms broadcasting information about COVID-19, a lexicon of spatial terms continues to emerge and shape the way we understand the current and potential effects of the pandemic on the urban environment. As part of this project’s efforts to keep up, we collected these terms throughout March and April with input from our classmates and extensive online research. After a critical mass was reached, we sought to classify our findings as a form of analysis: scalar divisions added another dimension to the old, new, and ever-changing definitions and uses of these words.
Flatten-the-Curve
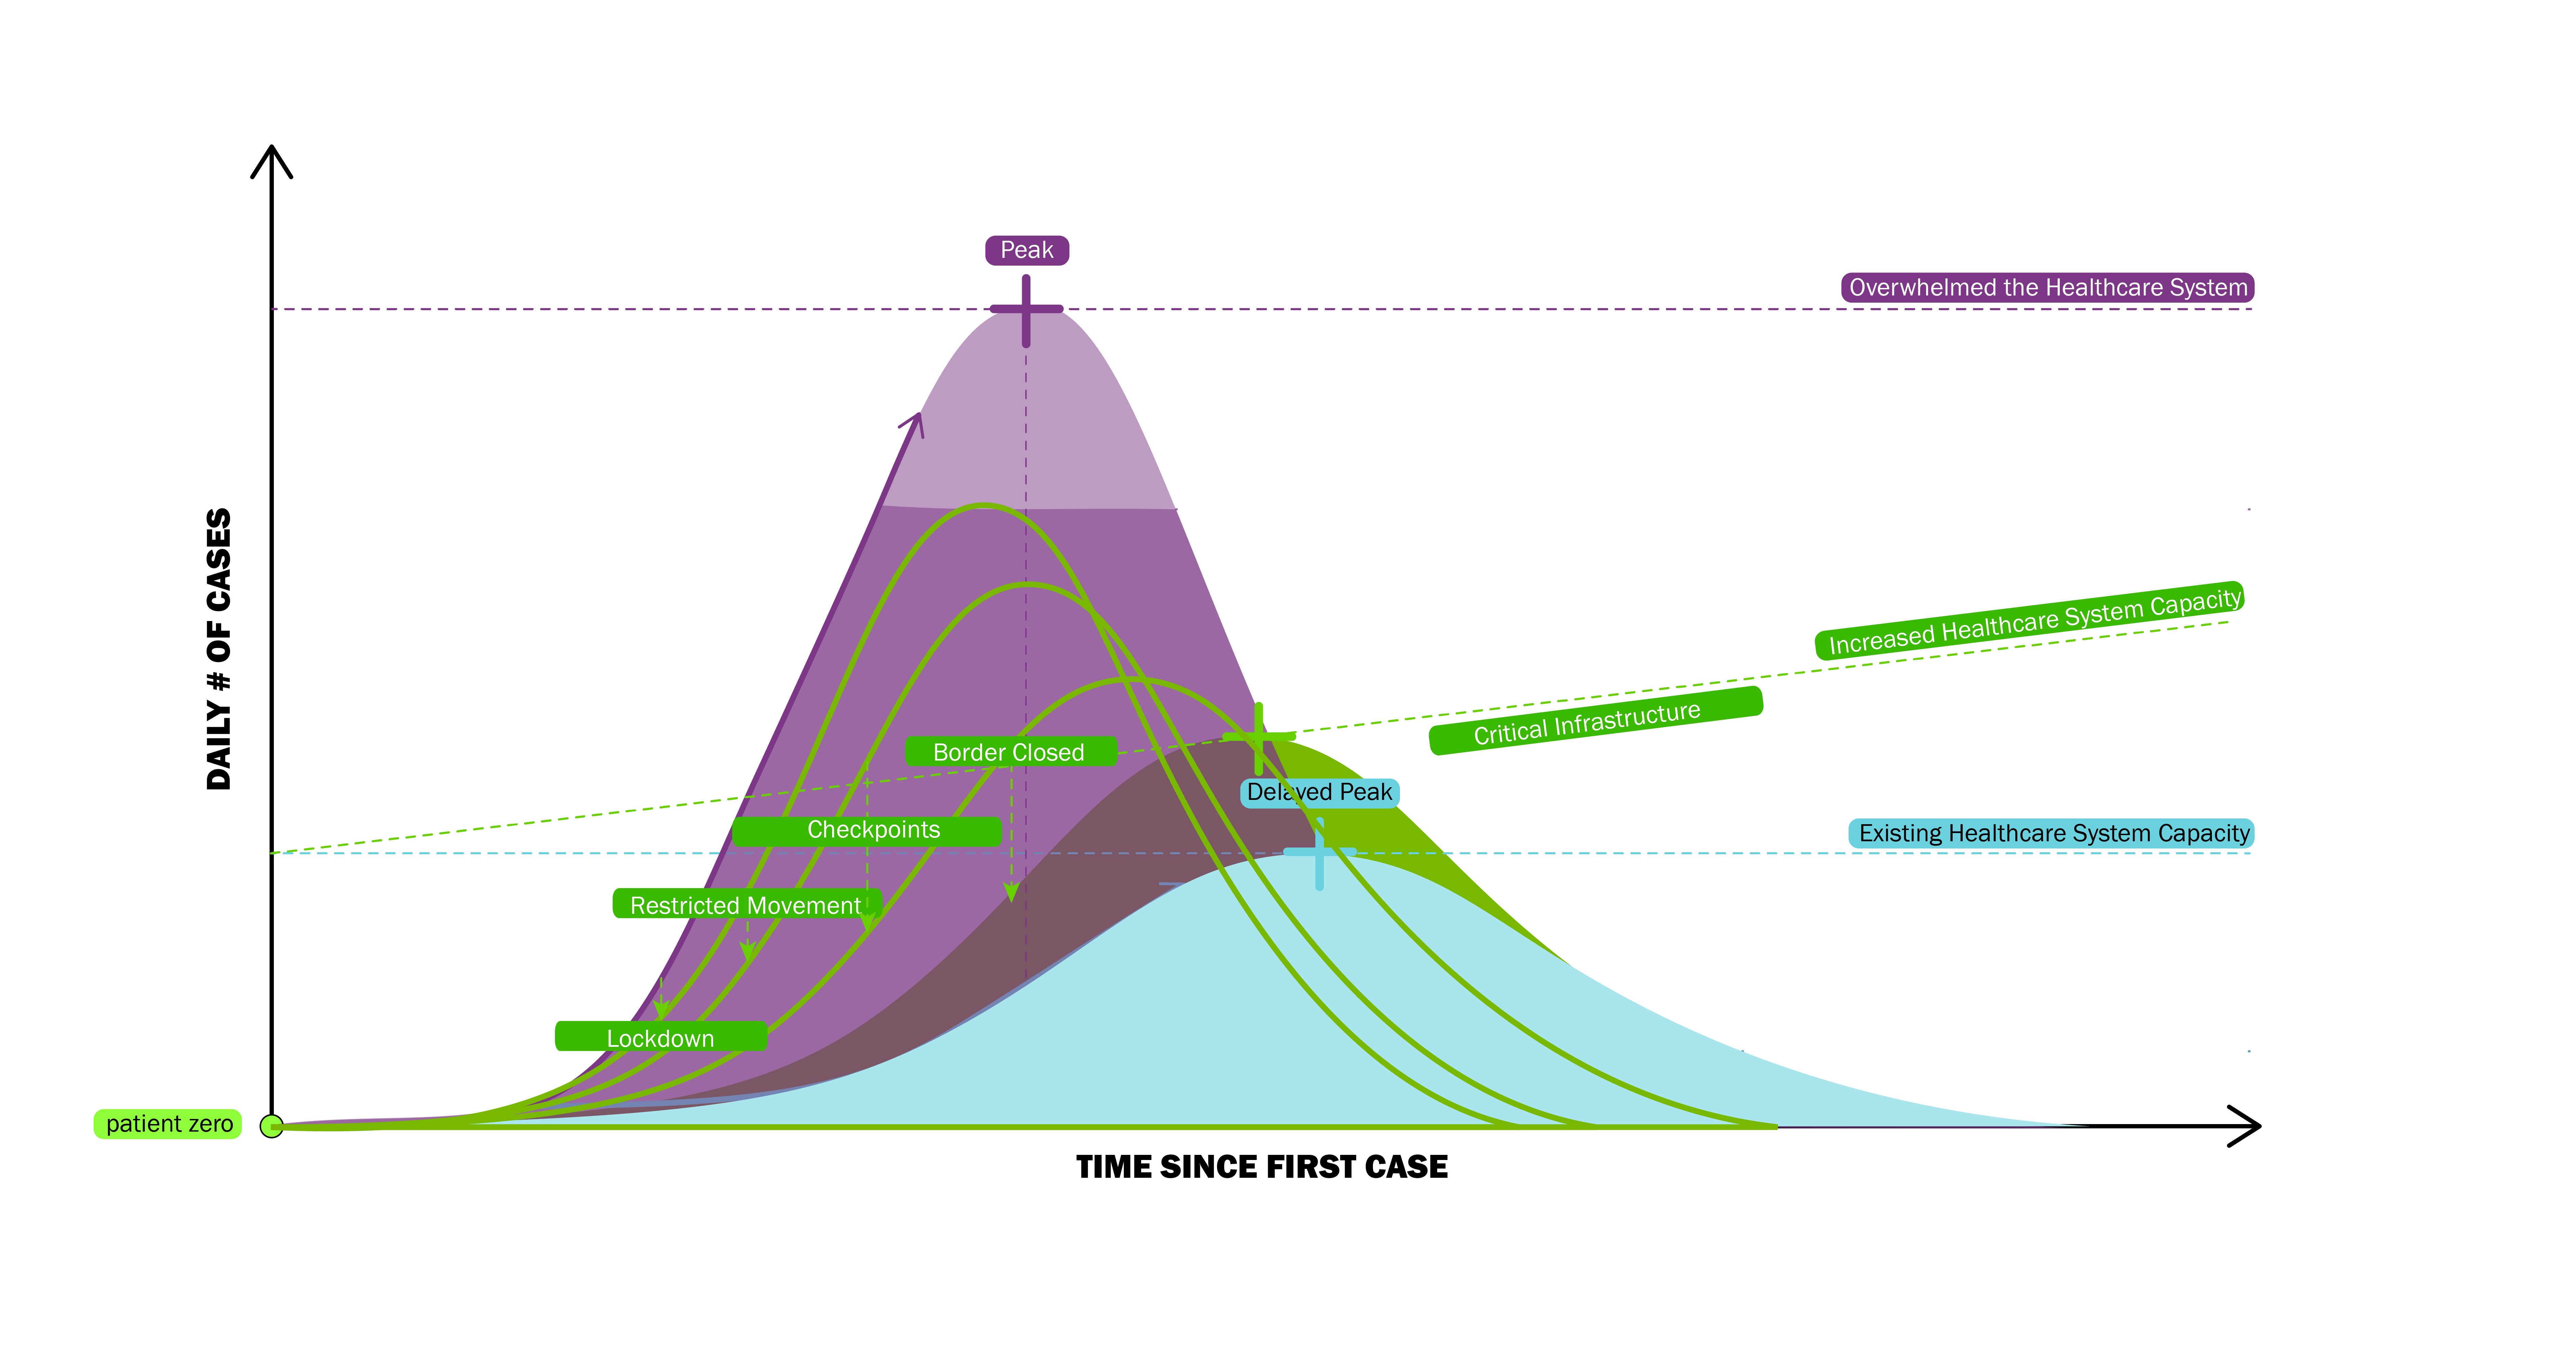
A widely circulated diagram serves as an organizing principle for the spatial terms within the various scales.
The flatten the curve diagram started to become popular in early March after microbiologist Siouxsie Wiles and illustrator Toby Morris 2 circulated a clear GIF that emphasizes the importance of preventing the spread with simple actions. The diagram charts two projected outcomes of COVID-19 and the healthcare system. The high peak illustrates the catastrophic outcomes that come from taking no preventative measures and the spread infecting people beyond the capacity of the healthcare system (shown in purple). Whereas the second peak highlights how the curve would look when taking preventative measures, in which the number of infected cases can drastically be reduced by small actions that avoid the spread (shown in blue). This diagram emphasizes the combination of the threat of COVID-19’s high contagion spread combined with the limitations of the healthcare system.
The diagram disseminates the two scenarios simply and not mathematically, becoming a powerful tool to educate and spread the news. As a result, we now find a large diversity of the same diagram, in different languages, some with added information, some through a more fun and creative lens, etc.
The diagram is annotated with terminology and analysis to explore six spatial scales:
Microbial | Personal | Social | Urban | Infrastructural | Global
===========================================================================================
Microbial Scale
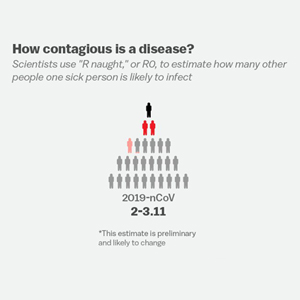
Policies implemented at lowering the Rt value to below 1 shifts the epidemic curve towards a downward trend. The r-naught (R0)value, or the infectious rate of the disease is estimated to be in between 2.5 and 3, meaning that for every one person infected, 2.5 to 3 persons are likely to be infected over the virus’ serial interval. However, the Rt value (effective reproduction rate), which takes human and environmental controls into consideration, shows how policies implemented over time can decrease the infectious rate of the disease.
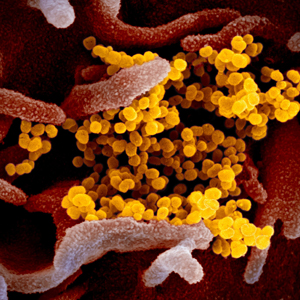
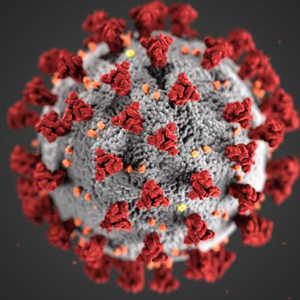


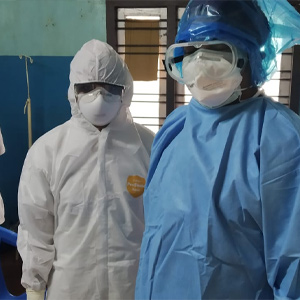
The fight against COVID-19 starts at a microbial scale – a conflict that is invisible to the eye yet has serious repercussions in the way we manage space. In the frontlines, scientists are trying to make visible the invisible virus that is SARS-CoV-2 while doctors are donning their limited supply of personal protective equipment to shield themselves at the microbial scale. The rest of the city are wearing N95 masks that filter out 95% of particulate matter invisible to the naked eye. People are advised to wash their hands for 20-seconds with soap and disinfect surfaces with alcoholic wipes to prevent further spread. Geospatial Resolution of Human and Bacterial Diversity with City-Scale Metagenomics by Afshinnekoo et al. mapping the diversity of bacterial species existing on various surfaces of New York City’s subway system is more relevant today than ever regarding the spatial conditions of the pandemic.
Every week, hundreds of newspapers are published that use statistical and evidence-based modeling to help “see” the virus and understand it in more concrete ways. There are three critical numbers, based on numerous papers, that influence policy measures to help slow the spread of the virus: Rt (effective reproduction rate), severity, and total number of cases.
Rt
Based on R0 (r-naught) value, known as the reproduction number signals how contagious a disease is. For example, an R0 value of 2 means that the one person has a likelihood of spreading it to two persons over its serial interval, the average time between each successive infection. Likewise, a R0 value of lower than 1 means that it spreads to fewer people over time. However, R0 is static and is not helpful in determining which policies are effective and therefore Rt value, which takes human and environmental controls into consideration, becomes more valuable. Studies have shown that the initial Rt value of COVID-19 in Wuhan started at 3.9 but with effective lockdown and quarantine measures, they were able to bring it down to 0.32. While calculation methods for this value vary widely and are much disputed, it has shown to increase in confidence interval over time as more data becomes available.
Number of cases
At the early stages of the pandemic, there was unreliable data in the total number of cases being reported, largely due to a lack of understanding overall about the virus. As governments came to agree diagnostic testing was of utmost priority in order to understand the full extent of the pandemic, there was a rush to manufacture test kits. In South Korea, their early action to mass produce test kits allowed for abundant access to testing and was their primary tool for effectively seeing and controlling the virus. Alternatively, when the United States announced travel restrictions to and from China after nine confirmed cases, there speculations that it was already too late and that the virus had already infected thousands more in the country.
Personal Scale
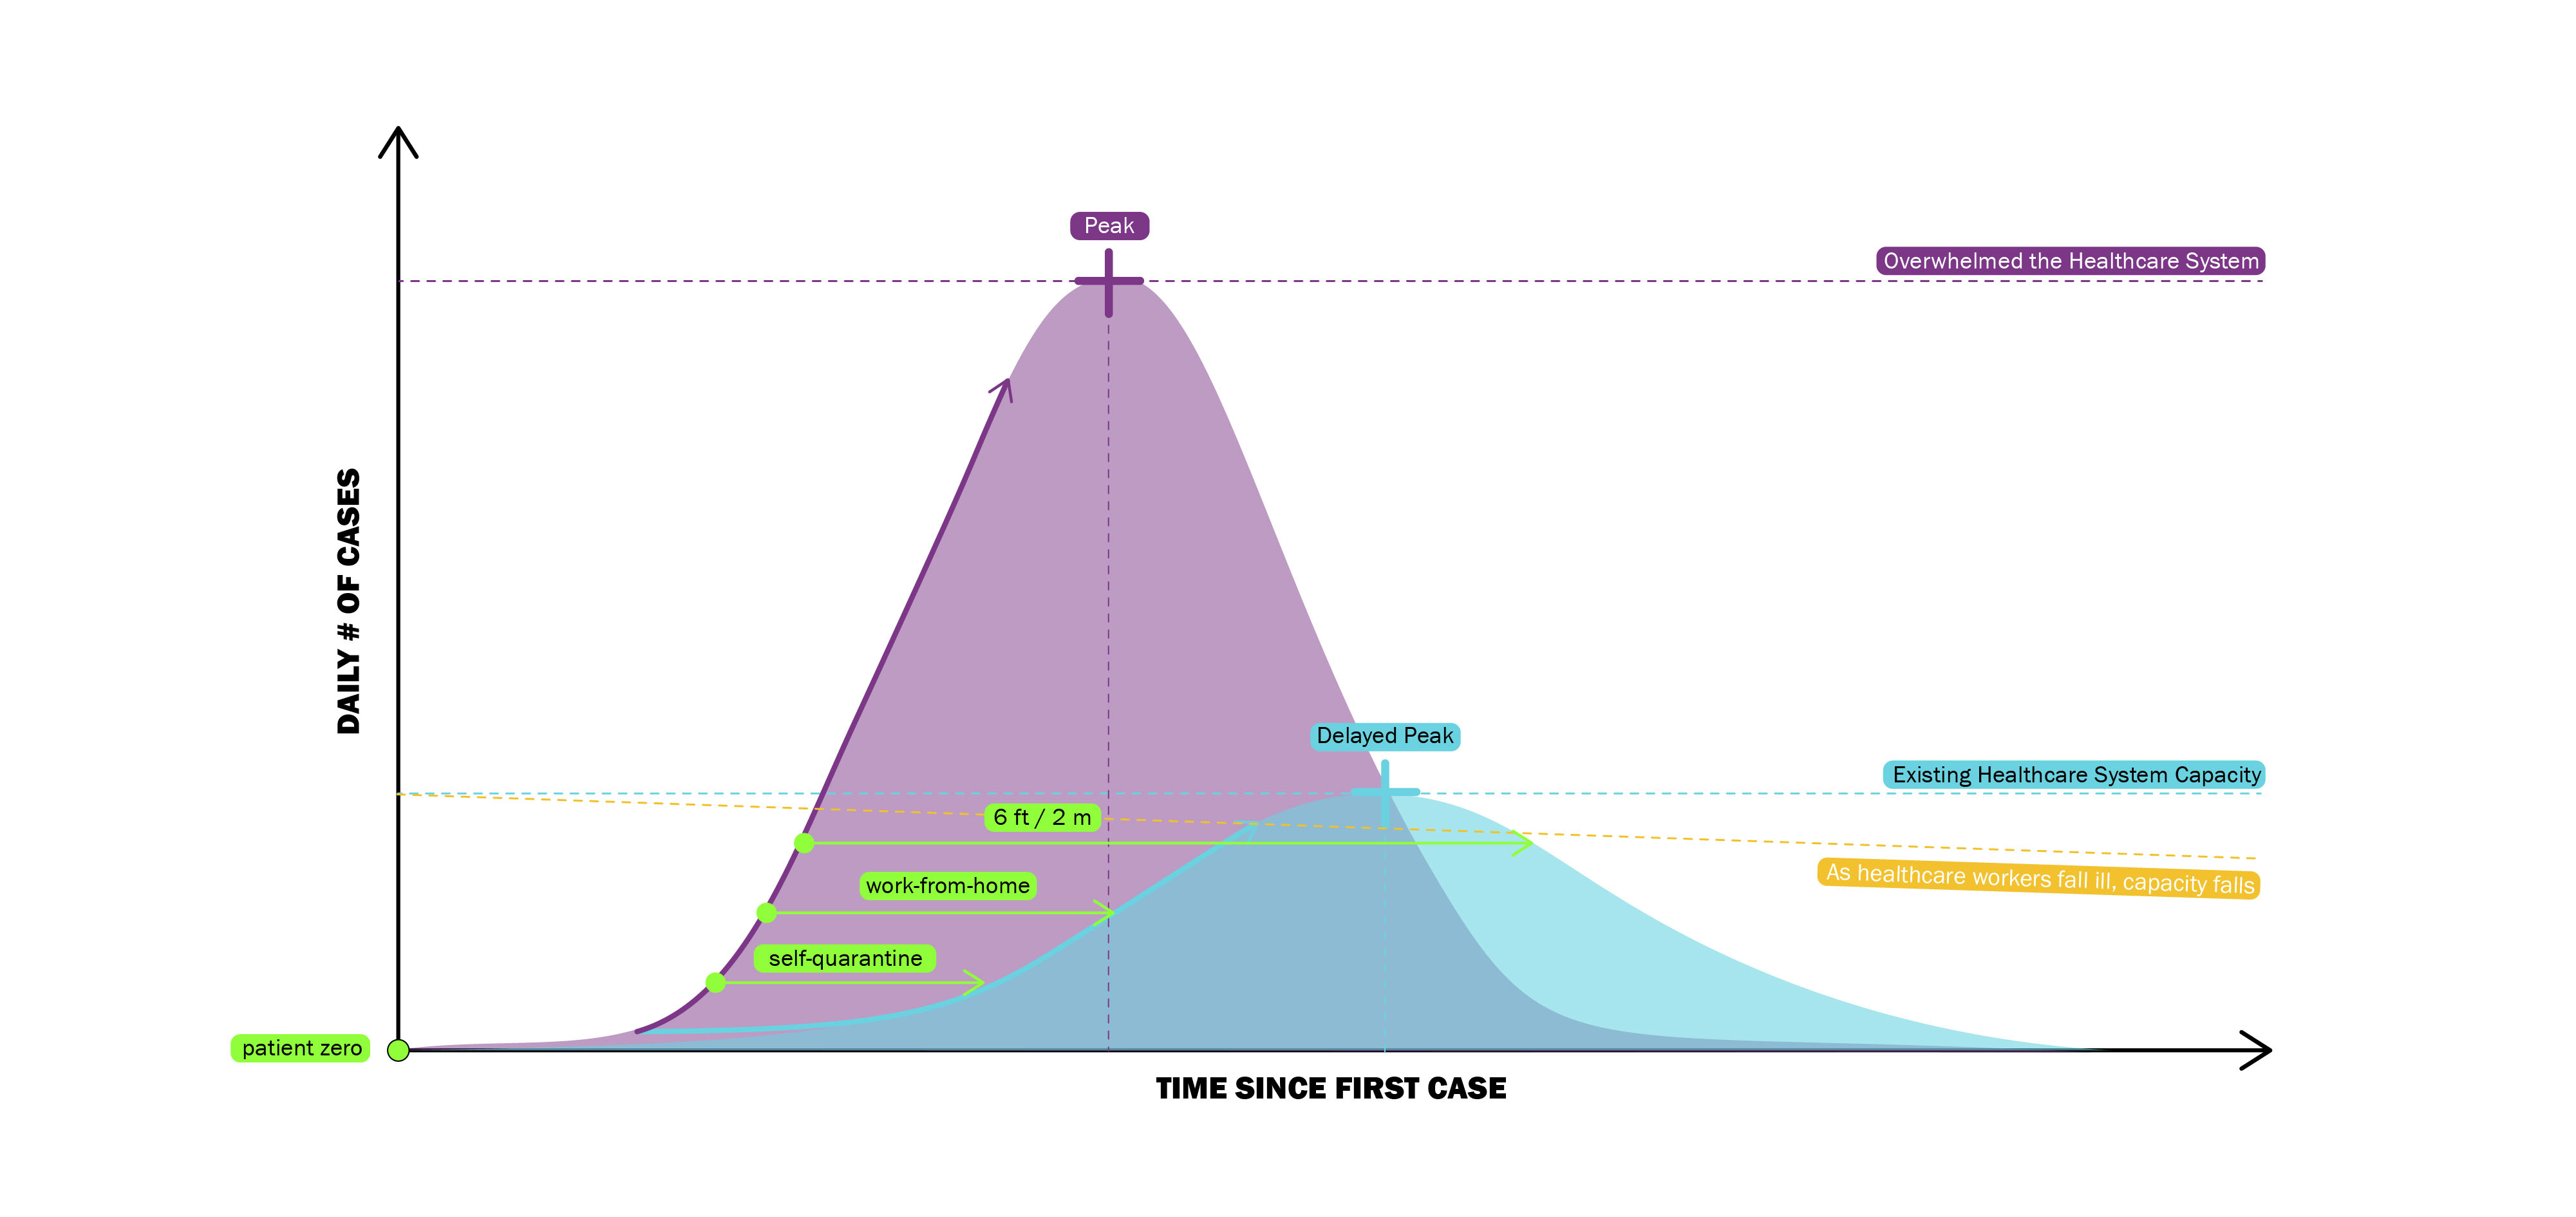
Actions taken at the Personal Scale result in a flattening of the epidemic curve and a potential lowering of the healthcare system capacity line. Individuals abiding by social distancing protocol like maintaining six feet of separation or working from home decreases the potential number of cases by minimizing unnecessary contact with others. If healthcare workers follow similar principles (ie. self-quarantining if potentially exposed to the virus), they would be required to remove themselves from the frontline for a dedicated period of time therefore decreasing the healthcare system capacity.

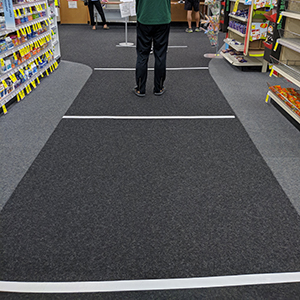

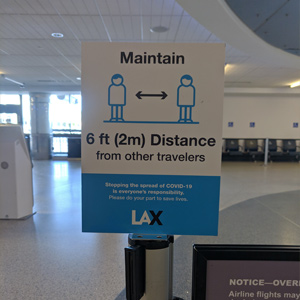
The Personal Scale encompasses an individual’s agency and concerns. The virus spreads through contact between healthy and infected persons, therefore governments and institutions mandate distancing. Work-from-home or remote-learning requirements promote dispersion of large concentrations of people. Occupancy restrictions limit the number of people allowed to gather in or enter one place. Maintaining six feet apart from strangers provides a buffer for contagious symptoms. But how do these new rules augment an individual’s experience of personal space?
For non-essential workers, operation within one’s personal space becomes an act of reducing the risk of exposure by physically removing oneself from contact with other people. Essential workers navigate hygienic measures intended to cleanse their personal space between shifts—between moments when risk of exposure from strangers is high to moments of being the greatest risk for their families and/or relations. Falling ill, or caring for someone else who is ill, amplifies the adherence to the new guidelines for social distancing and cleanliness. In all spheres, routines have been upended and therefore personal space has taken on new meaning and value.
While all of the new measures are proposed in the service of protecting one’s physical health, the Personal Scale also makes evident the effect of the pandemic on a subconscious level. The adjustments necessary to follow distancing practices affects mental health, habits, and the spaces we inhabit.
Rhetorics of Isolation Enforcement
In the United States, restrictions and guidelines in response to COVID-19 with spatiotemporal effects vary across borders, yet repeat similar phrases: shelter in place and stay home. The primary differences between the phrases lie in their historical use and nuances of the English language. The language of the measures matter insofar as how the public reacts to them. To consider briefly how the importance of rhetoric has played out already, the series of announcements, orders, and plans put forth by California and New York in March offer comparable case studies.
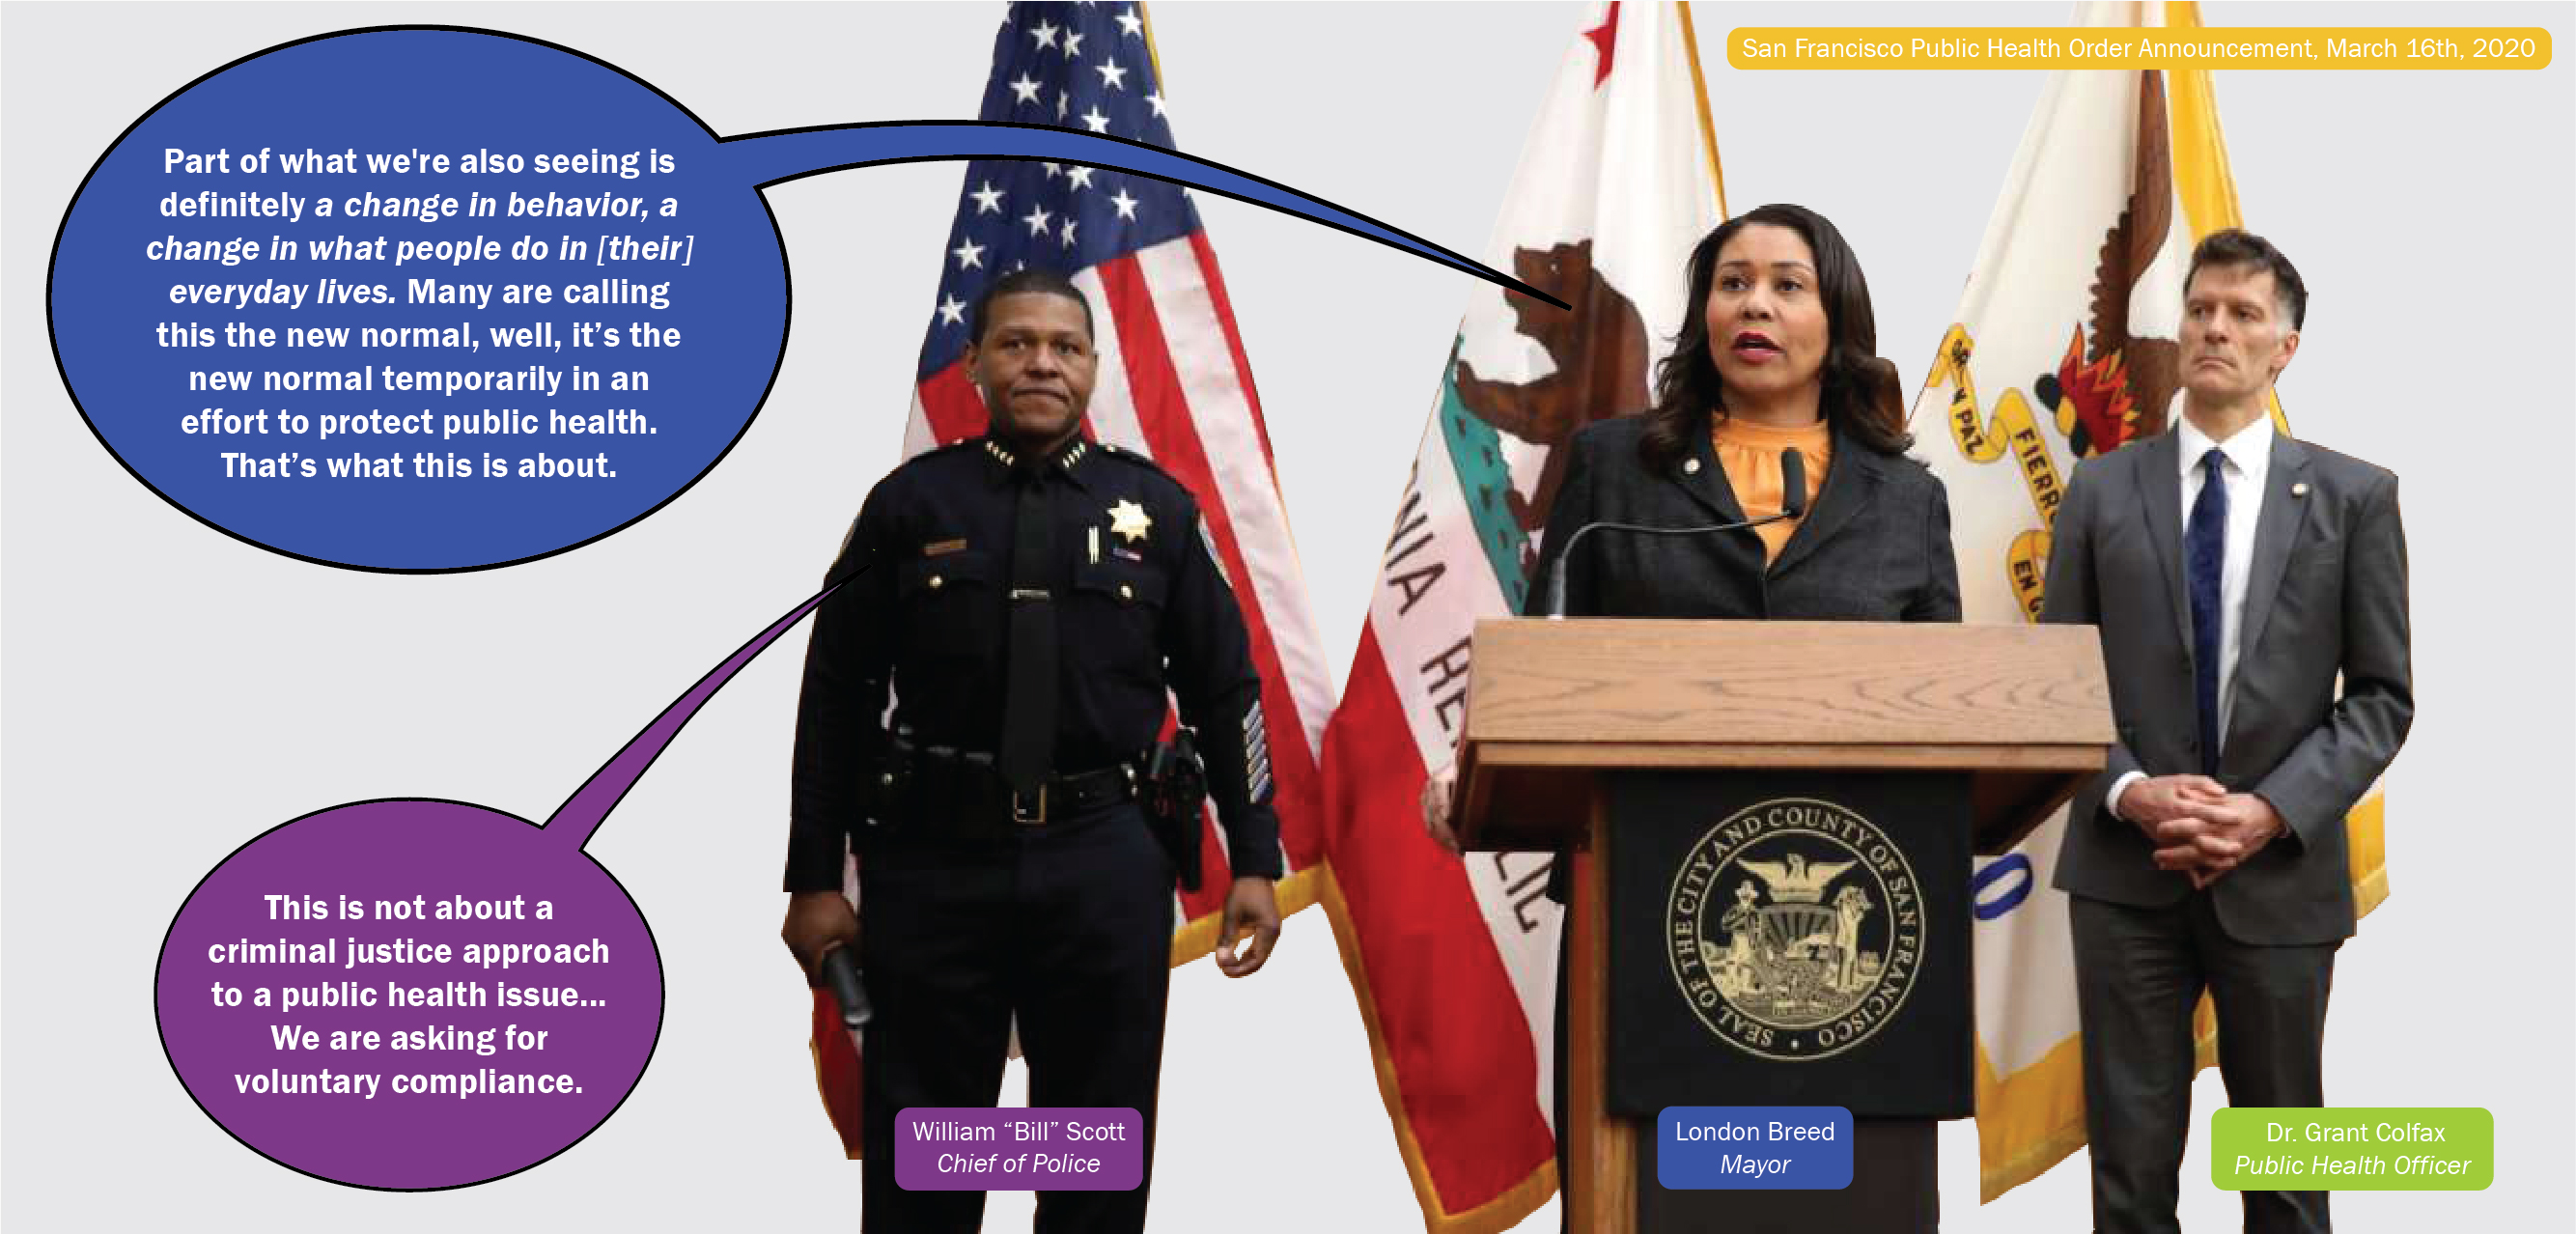
Part of the ongoing crisis is the concurrent infodemic—the proliferation of false or inaccurate information. Much has been said about steps taken in northern California to stop the spread ranging from commending their early action to accusing the local governments of inducing fear and panic by invoking the phrase: shelter in place.3 One caveat to this reporting is that during the press briefing for the most densely populated county (San Francisco) introducing Public Health Order No. C19-07, “shelter in place” was never uttered by any officials.4 It appeared in the language of the order as follows: “this Order requires all individuals anywhere in San Francisco to shelter in place—that is, stay at home—except for certain essential activities.”
In this moment when every government is under the stress of acting quickly and efficiently, one approach to disseminating helpful information is to reuse known legal terminology. “Shelter in place” is a formal warning previously used in situations when it would be more dangerous for people to evacuate than stay indoors. Since the criticism of its inextricable association with more alarming circumstances, California switched to “stay-at-home order.”
One of the loudest critics of naming public health orders came from New York Governor Andrew M. Cuomo after New York City Mayor, Bill de Blasio, expressed support for California’s action. “Look at your words, ‘shelter in place,’ you know where that came from? That came from nuclear war. What it said is people should go into an interior room of their home with no windows, stay there until they get the all-clear sign. Now, that’s not what people really mean, but that’s what it sounds like.”5 Instead, on March 20, Cuomo announced New York’s Executive Order, NYS on P.A.U.S.E., an acronym for Policies Assure Uniform Safety for Everyone.The regulations it outlined were built up over the month of March; gradually more of the non-essential workforce was sent home until the numbers reached 100%. The order also introduced stricter rules for vulnerable populations, particularly the elderly. Cuomo nicknamed this section Matilda’s Law, after his own mother, to act as a reminder that what an individual does affects those around them.6 Both the acronym (alternatively understood as the avoidance of using alarmist language concurrently circulating) and personal touches intend to present an empathetic approach, the efficacy of which is still running its course.
Source: YouTube
It could be argued that northern California was going to face backlash regardless of the formal language of their announcements because they introduced the strictest rules first. The rhetoric of the order, the press briefing, and subsequent reporting was one mere scapegoat for the anger, disappointment, and anxiety of the public. It is also worth questioning if the seriousness of the situation can and should be matched by the language used. The measures suggested at the Personal Scale, like maintaining six feet or working from home, feel somewhat voluntary (because they are in many places on the globe) despite having life or death effects. Further, political, medical, or scientific fields have historically attempted to use neutral, matter-of-fact tones to emphasize seriousness—like shelter in place—which is sufficiently vague. Using “stay-at-home” or stay home in its stead introduces a new, potentially contentious term: home. As the crisis continues, it is becoming increasingly evident that home can mean many different situations depending on individuals’ circumstances.
Social Scale
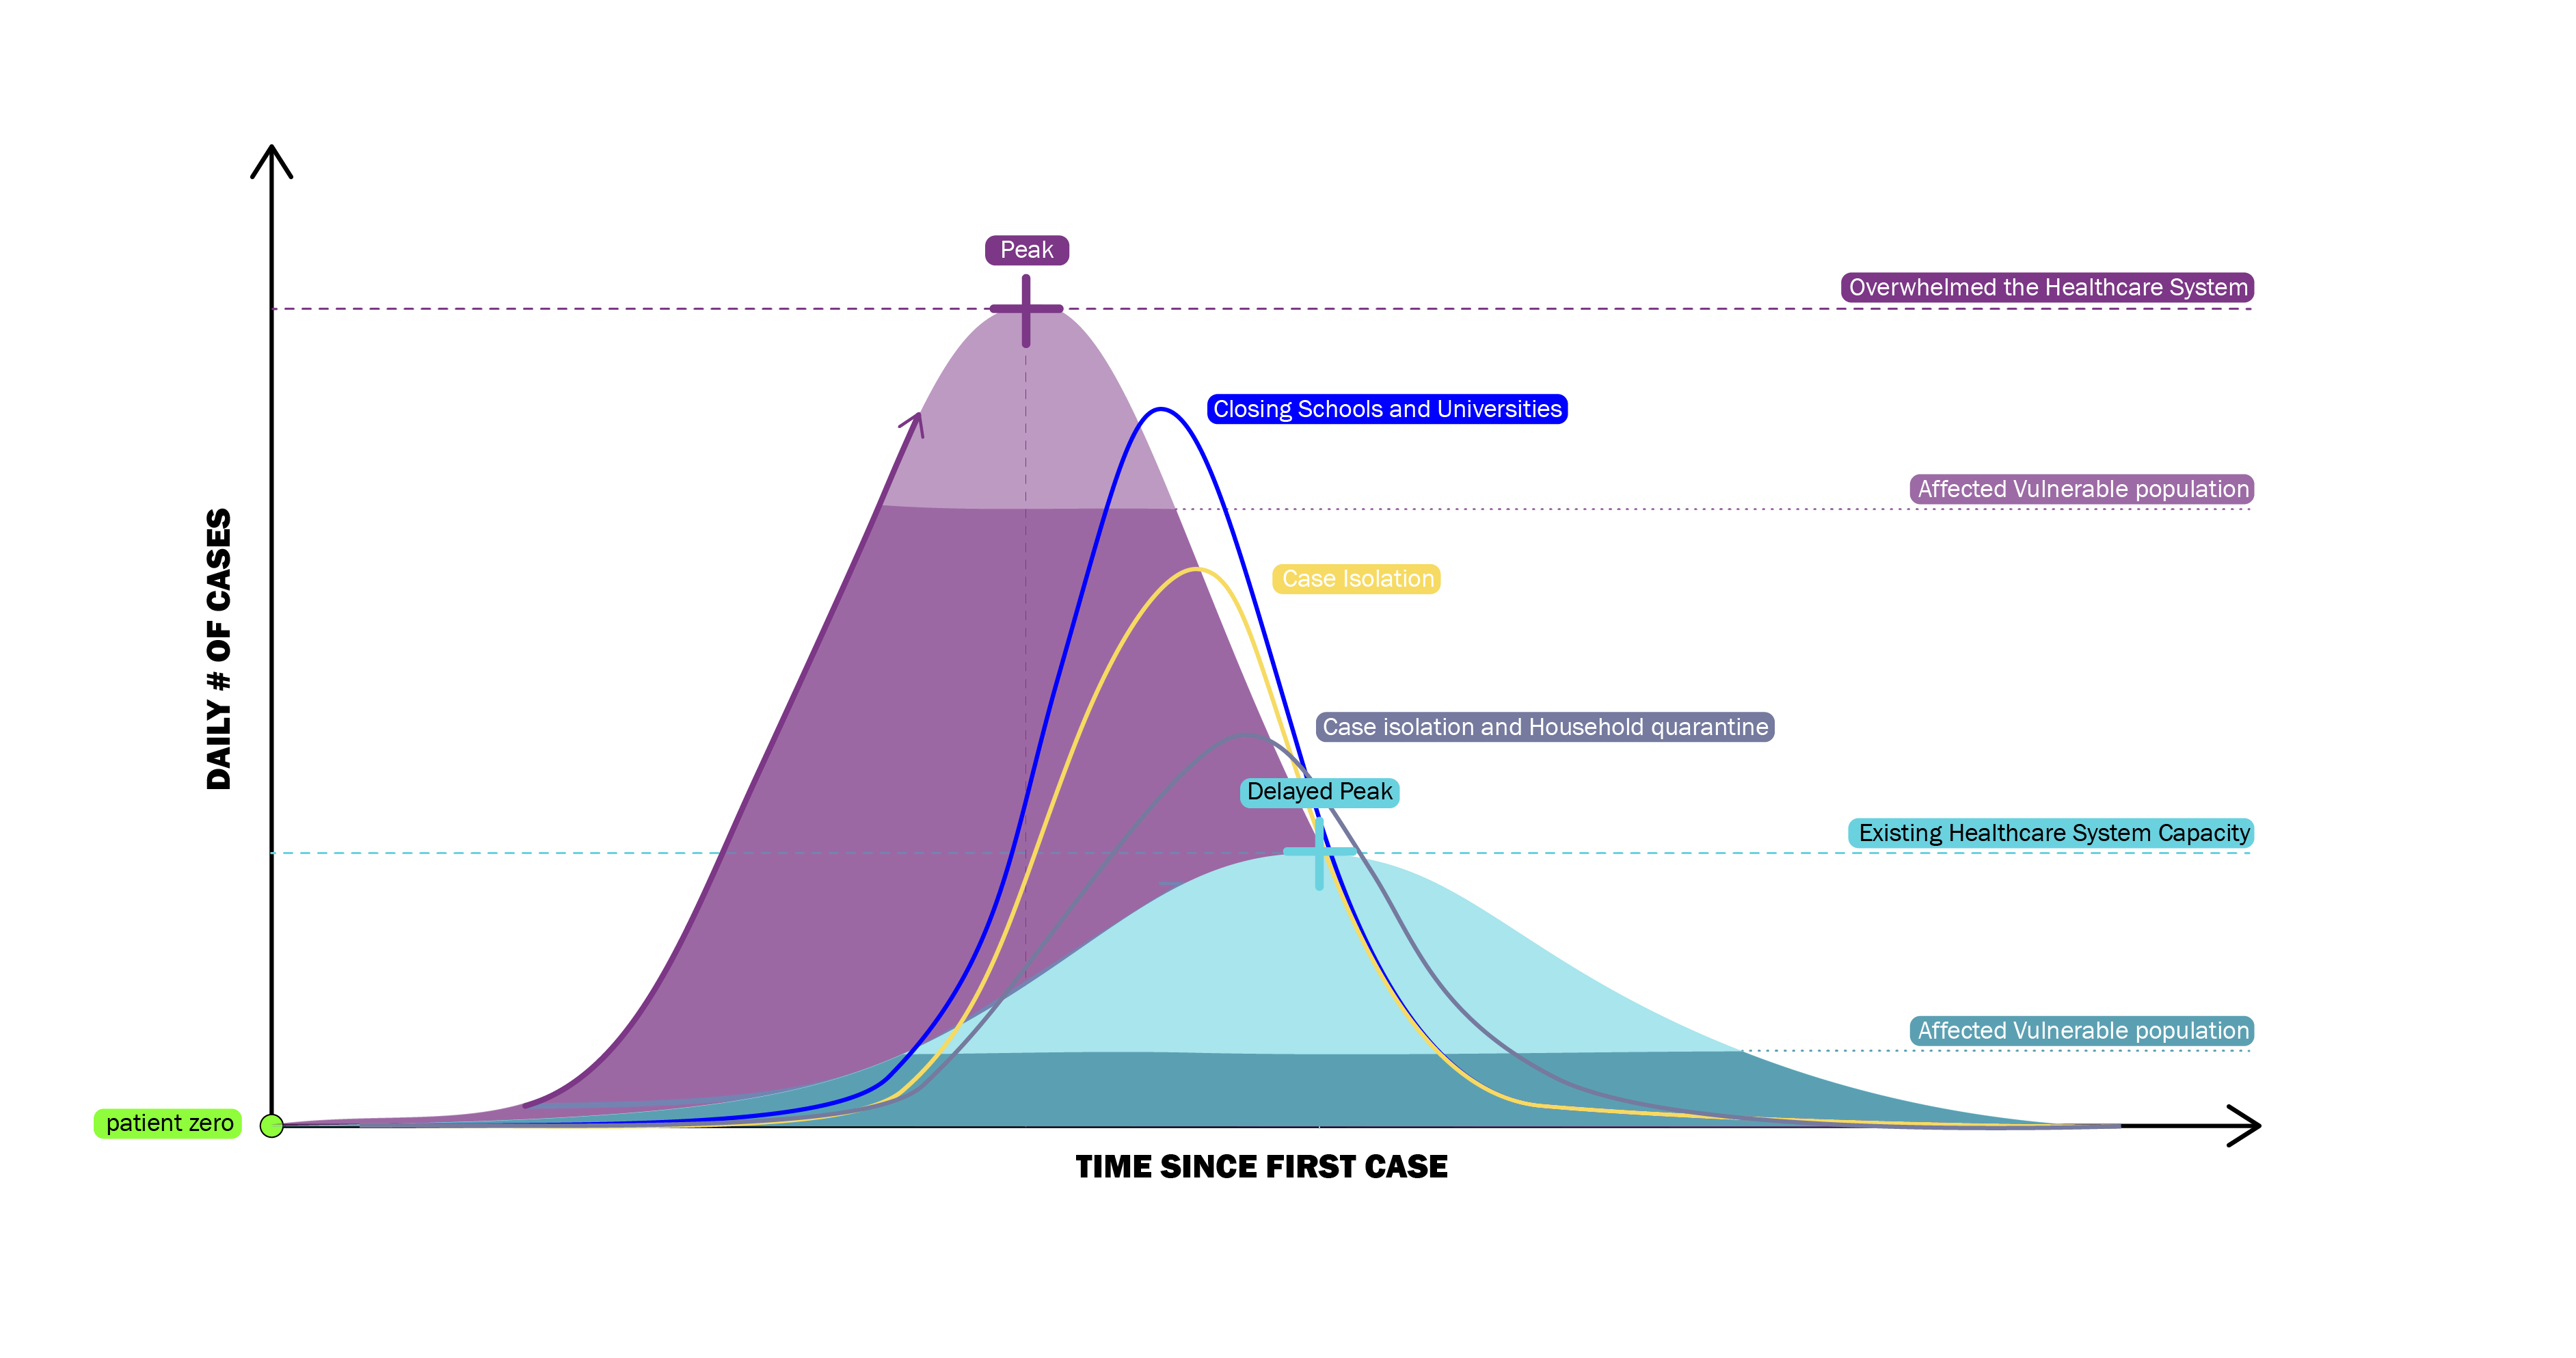
The widely known diagram of “Flattening the Curve” takes terminologies like Social distancing, Quarantine, Isolation, Postponing and others as its base to highlight how social interaction influences the amount of stress put on the Healthcare system. Therefore, when annotating the “Flatten the Curve” diagram with a “Social Space” Lexicon approach, two additional layers come to mind. The first is the different levels of social distancing and how strictly each state or country applies them. We already know that depending on these different levels of social distancing, the Healthcare system will perform drastically differently. The wide known diagram highlights the huge difference between not doing anything and taking radical cautionary measures to reduce the spread of the virus. However the added curves highlight how measures that would seem drastic, are still not enough, like for example closing down schools and universities. Instead these added curves point out that only when isolating cases, plus any other additional effort, will we start seeing better results in containing the spread of the virus.
The second layer is about how these different outcomes have an effect on vulnerable populations. This category includes both people who have pre existing conditions that make them more susceptible to the virus and certain age groups, but it also includes low-income populations who can not afford to isolate and stay home, or do not have the means to get tested and treated accordingly.
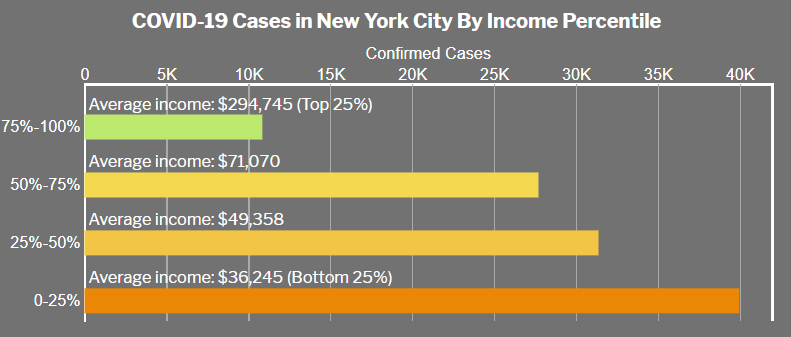 Source: Chris Wilson, “These Graphs Show How COVID-19 Is Ravaging New York City’s Low-Income Neighborhoods“ Time, April 2020. https://time.com/5821212/coronavirus-low-income-communities/
It is therefore possible to make the following deduction: The first scenario of the “Flatten the Curve” diagram (in purple) most probably includes a much higher percentage of affected people that fall under any of the “vulnerable population’’ categories, since they are the ones more likely to get it and not get an adequate treatment fast enough. This scenario shows a disregard for vulnerable populations which is also reflected in statements given by certain leaders, like Texas Governor, who considered “that the economic well-being of the country was more important than the lives of older people”.7 On the other hand, if the curve remains controlled, the second scenario in light blue, then the vulnerable population, meaning older people or groups with pre existing conditions, will still be mostly affected, but they will be able to get treatment, reducing their death toll. Unfortunately this was not the case for many cities and countries, in which the economy was put before the well being of their population.
It is due to these many debates, on whether to do this or that, that talk around Social Space has become a very dominating topic since the start of COVID-19.
The speed of the spread of the virus is currently dictating the way we interact in society. It has been constantly repeated that people who have the regular flu will spread it to 1.3 people, whereas someone with COVID-19 will give it to 2.5, meaning that our social behaviour needed to change drastically in order to avoid the exponential growth of the curve and avoid overloading the health infrastructure.
With this concept in mind, a big variety of new terms started to become very popular ranging from basic social distancing understanding, to terms like “postponed” or “cancelled” that start travelling the media at exponential rates. A few weeks into the social distancing, people start talking about the “new normal”, anticipating and thinking of what the future might look like after this pandemic.
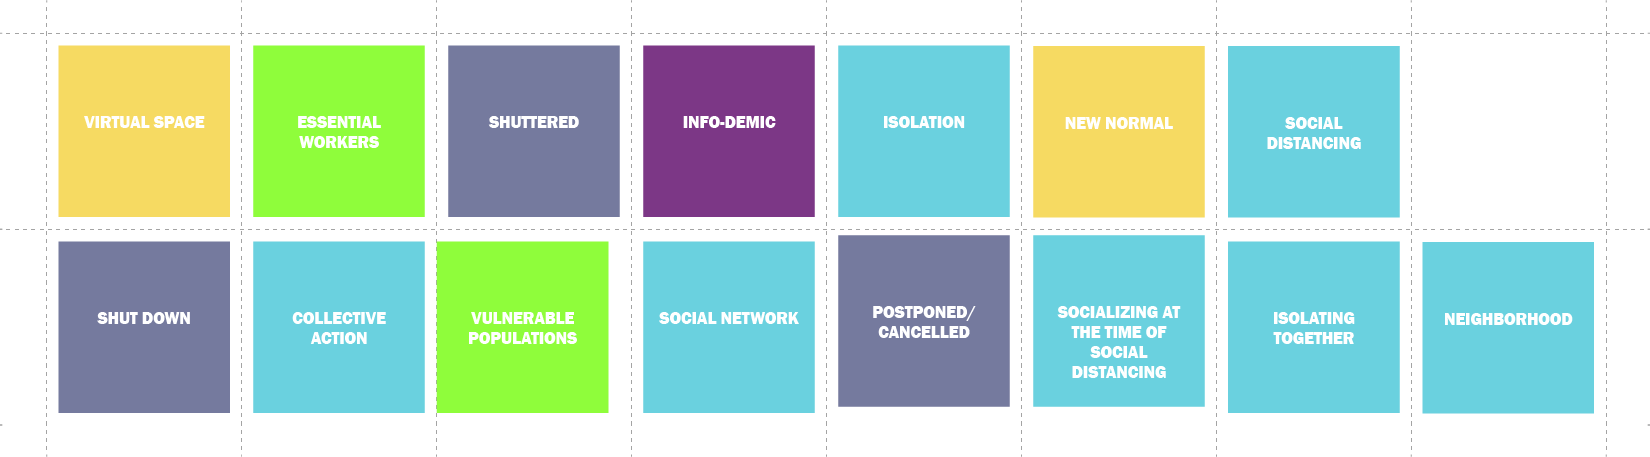
Of course all these new terms start to give shape to a broader one: “Infodemic”. It is as important as pandemic due to how fast and easily it “spreads”. The overwhelming amount of information and the easy access becomes the foundation of this one last term. Which is why the chronology of these terms is of particular interest. There is an order to how certain terms start to become more and more popular, also displaying how one leads to the next. In a way one can talk of an evolution of spatial terms that start to grow and diversify as time goes by since the start of the outbreak and as we see new outcomes, new reactions, unexpected growth in numbers and new social patterns.
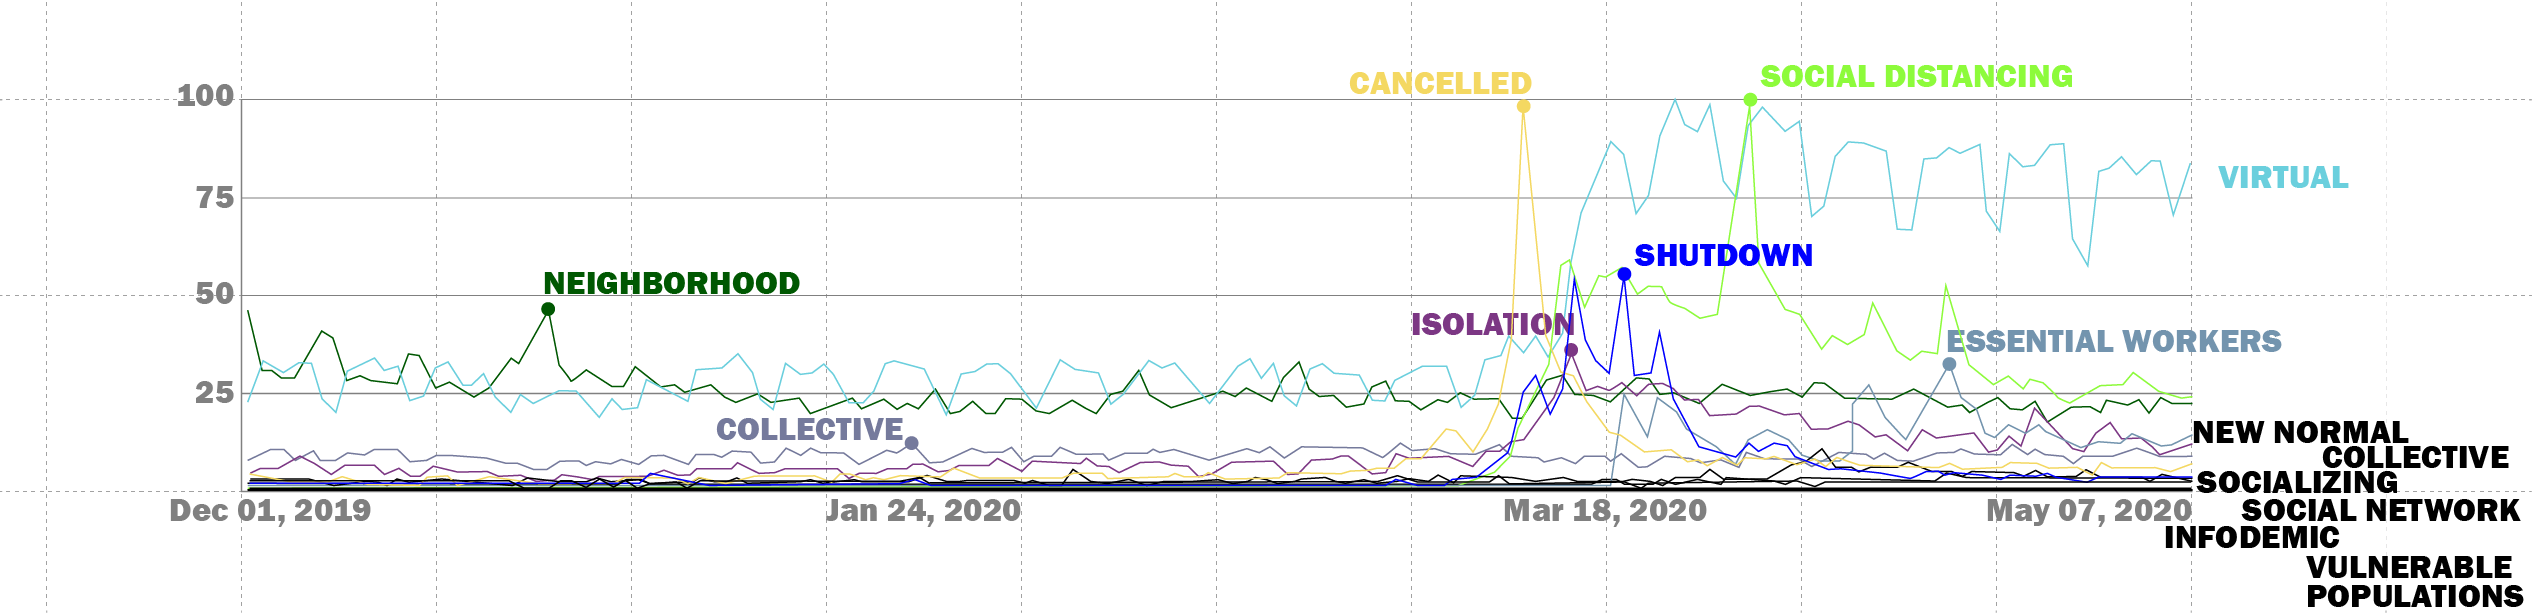 Source: Google Word Search - United States
When running a Google Word Search for the U.S from December to May, we see that the terms that mostly stand out are Cancelled, Isolation, Shutdown, Social Distancing, Virtual and Essential Workers, all very related to Covid-19. However, even though it is hard to establish an actual chronological order, one could say that there is a “first” and a following chain reaction, starting with “Cancelled”. However, a Google Word Search will focus on trends, which does not accurately reflect the real order, which is why starting with “Essential workers”, due to their position as the frontline and first responders, can make more sense for a chronological collage.

Image Credits: 13 14 15 16 17 18 19 20 21 22 23 24 25 26
There are many ways to organize this lexicon chronologically and probably none is entirely correct or incorrect. However this exercise allows us to raise important questions regarding the past present and future, questioning underlying issues that are now more visible, understanding the present, which is changing extremely fast under these circumstances and speculating about what will happen. For example, is there a new understanding of vulnerable populations that will include first responders or essential workers that cannot leave because they are needed, making them more vulnerable in a crisis like this? Does this mean that these job positions could finally become more valued, leading to a raise in salary or social benefits? How will we continue using spaces? And are we learning new values and appreciating existing Social Networks? Maybe even discovering new ones that were always there but never evident? All of this will finally lead to our New Normal.
Urban Scale
Typically the healthcare system’s available resources, space and staff all limit its capacity to treat patients. Urban areas with high populations and potential for Covid-19 spread create emergent needs to expand the healthcare systems capacity and mitigate high mortality by meeting increased needs–and fast.
Expanding Capacity
Small local businesses and large corporations adapt in real time to provide online services and new production streams of PPE, medical equipment and provide basic needs to people around the world. The distancing measures combined with temporary expansion to the healthcare system allow needs to be met and a delayed peak of cases. Re-openings of offices and normal operations and restrictions lifted before a vaccine or herd immunity risks a resurgence of the spread and a potential second peak.
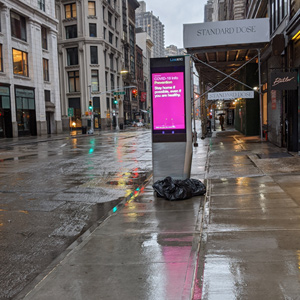
Urban Space Transformation
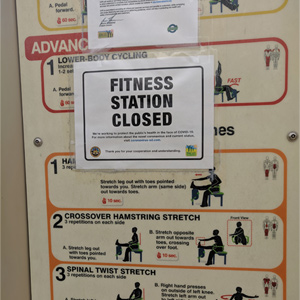
Quiet and eerily empty streets and public spaces. Makeshift hospitals spilling out into parking lots and parks. Caution tape strewn about playgrounds and signs reminding of “social distancing” and “no gathering, stay six-feet apart” displayed in places formerly packed on warm spring days.
Those depictions were unimaginable or seemingly science fiction prior to March. Urban spaces are undergoing reconfigurations which include temporary housing for the homeless, pedestrianized streets and makeshift treatment and testing centers. The streets are experiencing a beautiful resurgence of wildlife in some cases, but the inactivity can also create a post-apocalyptic fear and paranoia.

Imagining Potential Futures
“Never waste a good crisis” has become a motto within the design field throughout the pandemic. The opportunities for change increase while each city experiences transformations. RFP’s and competitions have all launched to meet the challenges of a supposed “new future.” The hope is that we can adapt and customize our cities to work better for people. For far too long cities have been designed for automobiles and perform poorly for pedestrians and cyclists. People find themselves occupying the leftover area between the streets and the buildings–sidewalks. They are uninspired and wildly insufficient for our present reality of physical distancing which causes chaotic dodging on every block. What might the future urban spaces look like at the end of the Covid-19 crisis?
Infrastructural Scale
The Infrastructural space serves as a critical nodal space in fighting against the unprecedented COVID-19 crisis. It refers to the space of the underlying framework connecting different urban spaces, as well as connecting different cities and countries across the world. As Brian Larkin defines infrastructure as the “physical network” that “allows for the possibility of exchange over space,” 8 this scale of space puts an emphasis on the movement and flow of goods, people, materials and services across different scales of space. Because of the contagious nature of the virus, movement and connectivity, infrastructure assumes a critical role, as it becomes questionable and sometimes even dangerous.
From the lockdown of the city of Wuhan to the Hubei Province, to bringing national guards to New Rochelle in the New York State, we saw top-down measures to use infrastructure to restrict movement in an attempt to flatten the curve. Surveillance and tracking of the movement history of positive cases were also considered effective in containing the transmission of the virus, especially with the successful case of South Korea. On the other hand, the public infrastructural spaces, such as the subways, airports and highways, become empty since they could be the “hot zone” of the virus due to their public and connective nature. Reflecting on the Infrastructural space, we have to ask: what is the new role of infrastructure in such a crisis? Or should we think about the infrastructural space less in the form of “physical built networks” but more as the exchange of invisible service and ideas across space?
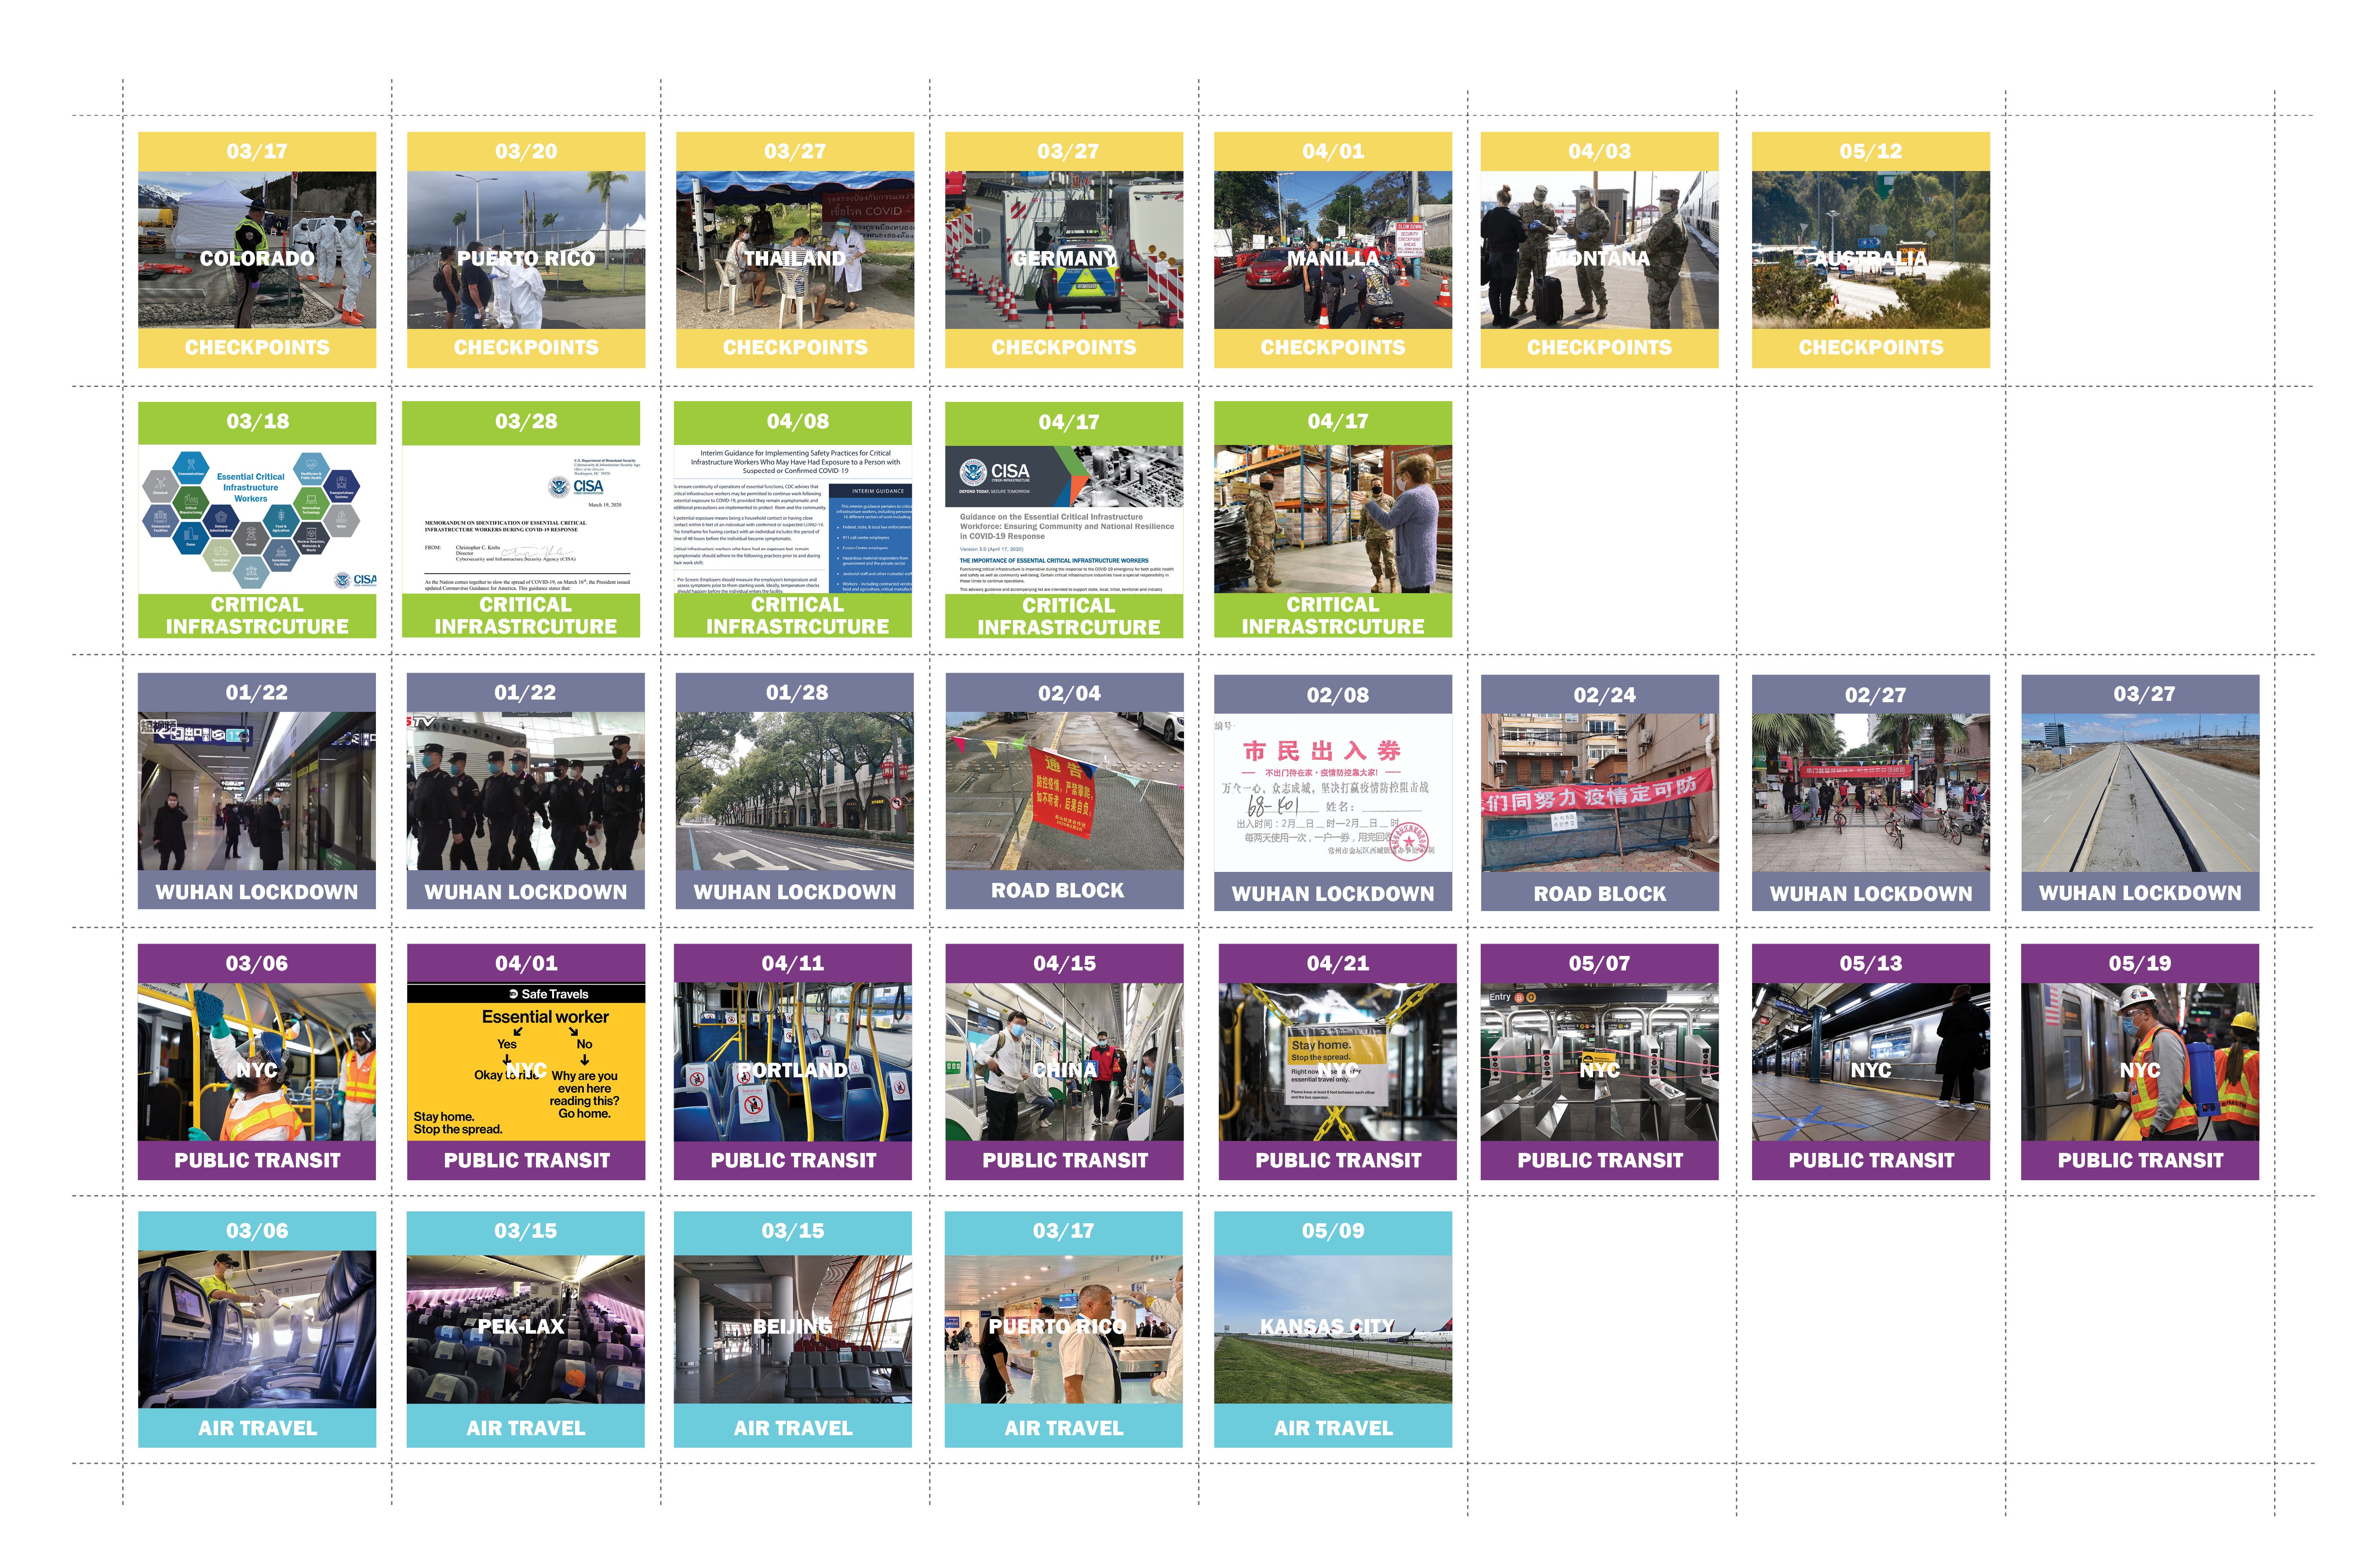
Image Credits: 27 28 29 30 31 32 33 34 35 36 37 38 39 40 41 42 43 44 45 46 47 48 49 50 51 52 53 54 55 56 57 58 59
Analysis of different scales of intervention in the Infrastructural Space to restrict movement and to flatten the curve
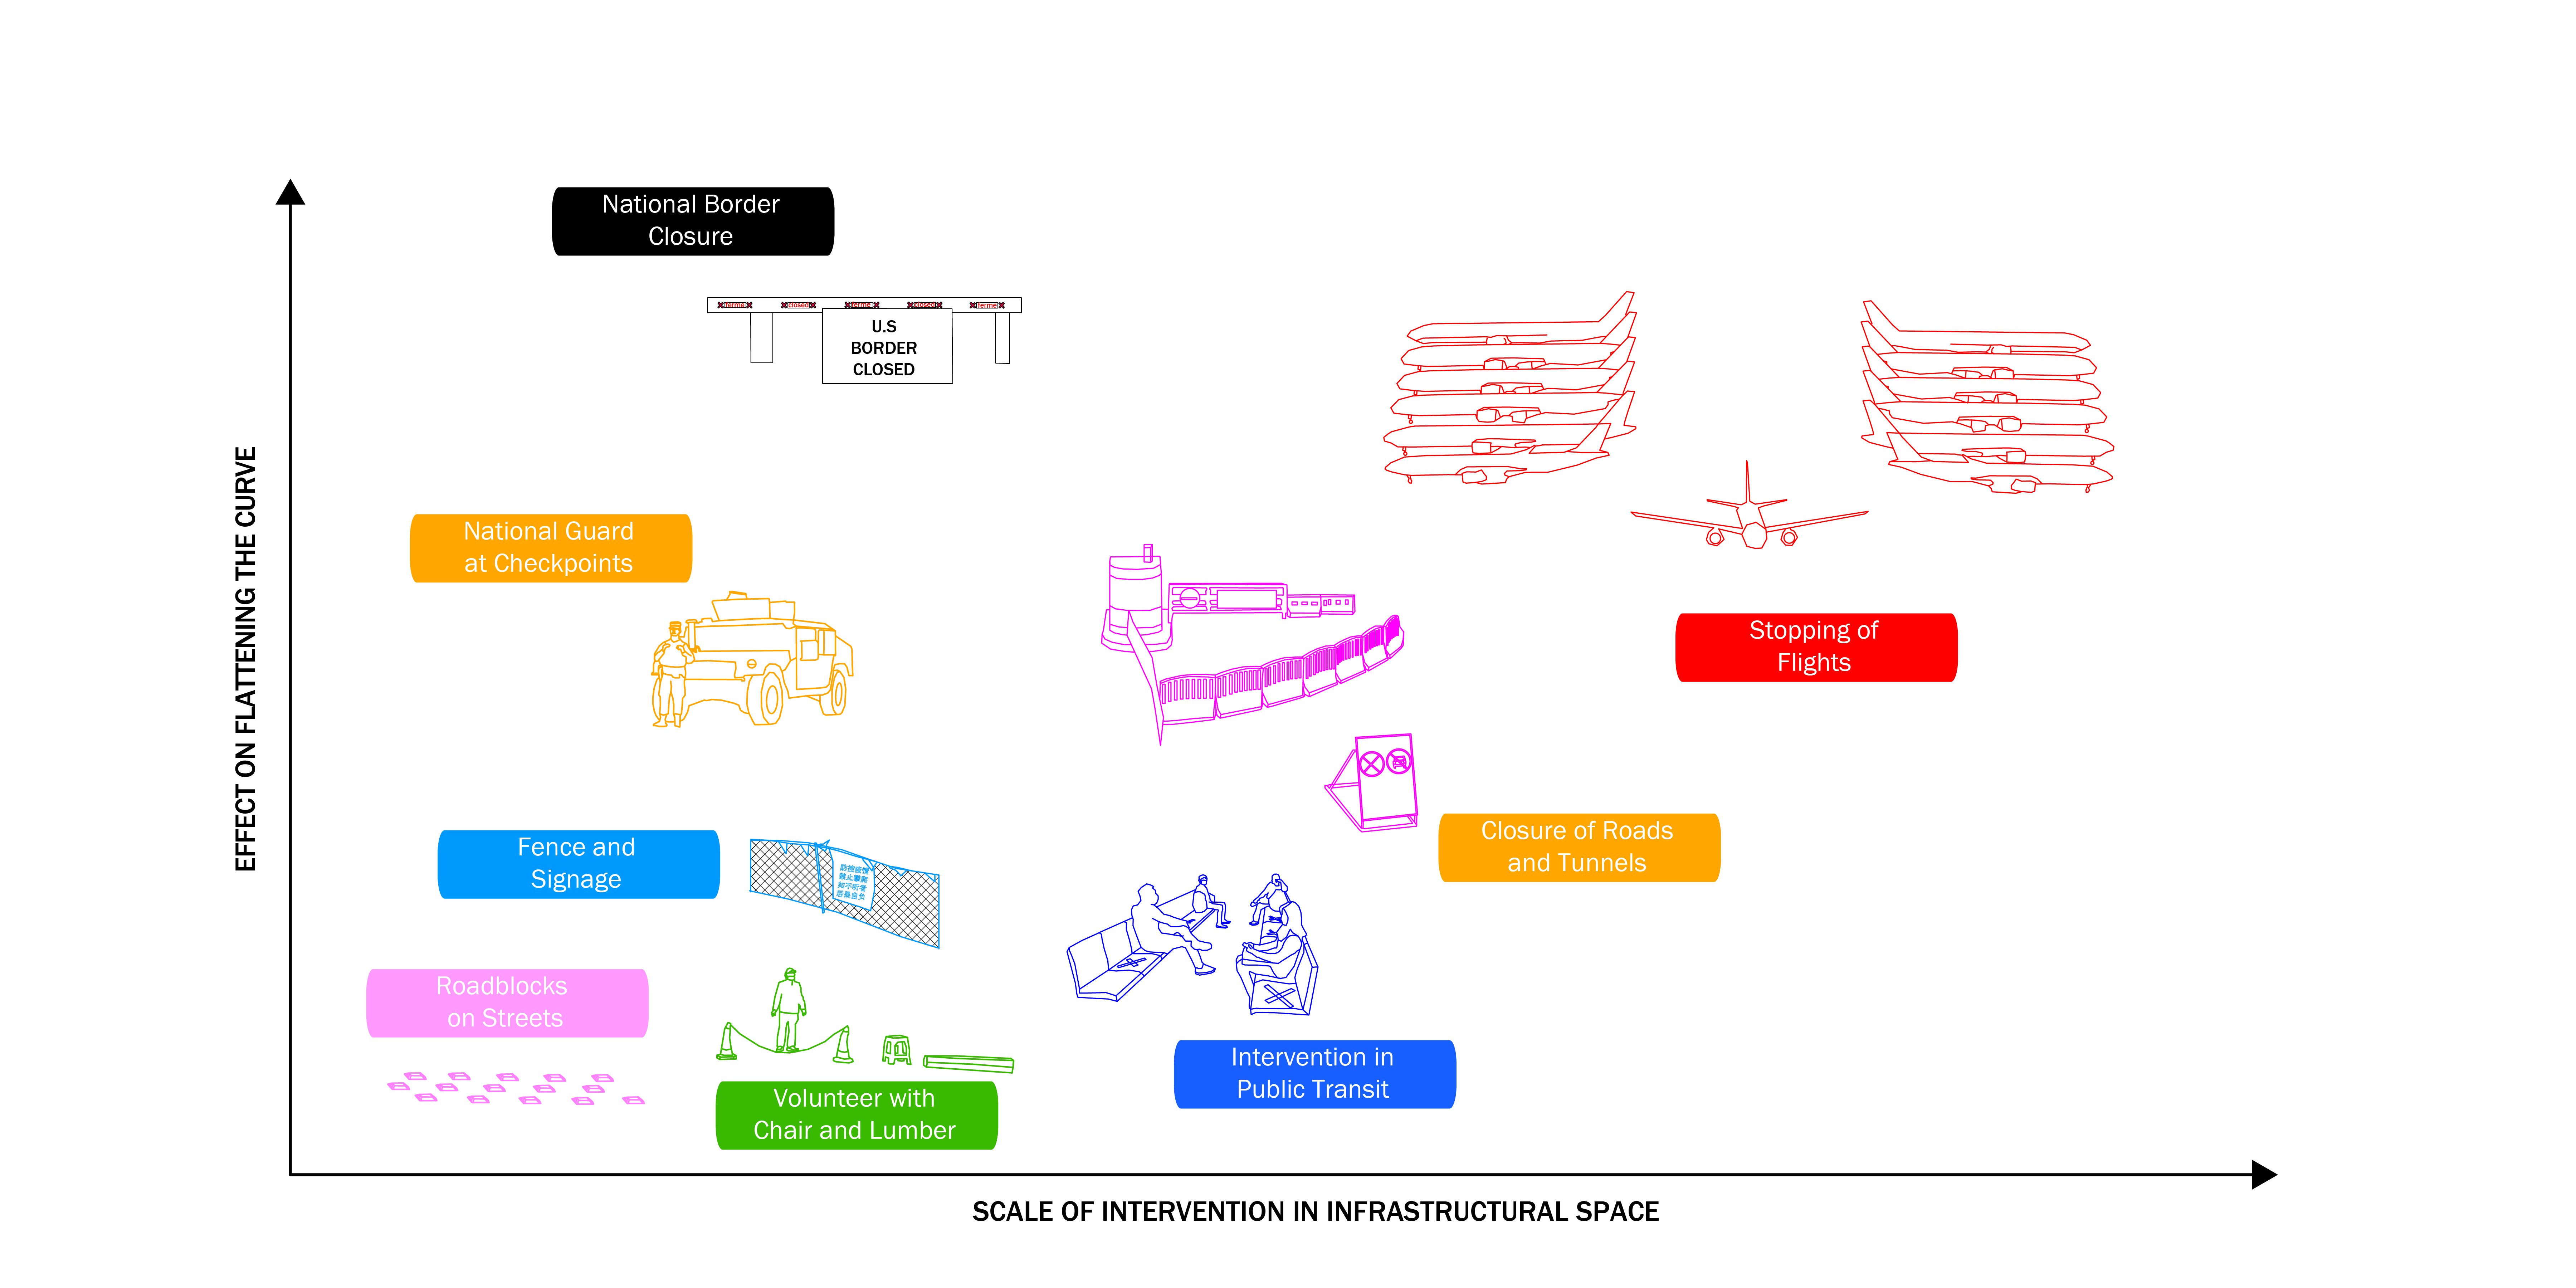
This diagram attempts to extract different strategies used to restrict movement in the infrastructural space9 and to analyze them according to their scales of intervention versus the effect on flattening the curve of COVID-19 (the effect is generalized rather than scientific). It shows that generally the effect of the intervention is proportional to the scale of intervention. At the same time, actions taken on the nodal spaces, such as the border between states and nations are usually the most effective since they have a large impact in containing the movement across space. This points to the critical role of infrastructure as a network of exchange, especially at an age of maximized connectivity. At the same time, such strategies, even taken at small scales such as at the level of checkpoints, usually require top-down approaches from the local government or even the collaboration between governments.
It is demonstrated that the infrastructural space is a critical space in the crisis of COIVD-19 due to its nature as a space of exchange. This crisis prompts us to reflect on the question of control over this exchange. Is control over infrastructural space necessary during such a crisis? If so, does it assume that we should accept the inherent political nature of the infrastructure since such control usually comes from top-down approaches? In the case of COVID-19, is infrapolitics still a possibility? Lastly, if physical exchange is inherently controlled by power, how about immaterial exchange such as ideas and emotions?
Global Scale
The global impacts of the COVID-19 crisis, which was declared as a pandemic by the WHO on March 11, are unprecedented and severe. It is a health pandemic and economic crisis that became global in a short span of time, resulting in a combination of disruptions to our way of life and mobility, uncertainty over privacy concerns, and demand and supply chain disruptions to major economies. 10 The crisis has revealed racial biases showing up in coronavirus testing and incidences of individuals racializing COVID-19 as the “Chinese virus”. Superspreader events have occurred in environments where many people are in close quarters for sustained periods, such as the outbreaks in nursing homes, cruise ships, and church gatherings. Satellite imagery show reductions of greenhouse gas emissions in numerous cities, and photos of wildlife sightings suggest that the coronavirus is changing the environment. However, many experts are less certain about the long-term environmental impacts as activists are pressing governments to ensure tougher rules on emissions to post-pandemic stimulus aid.11
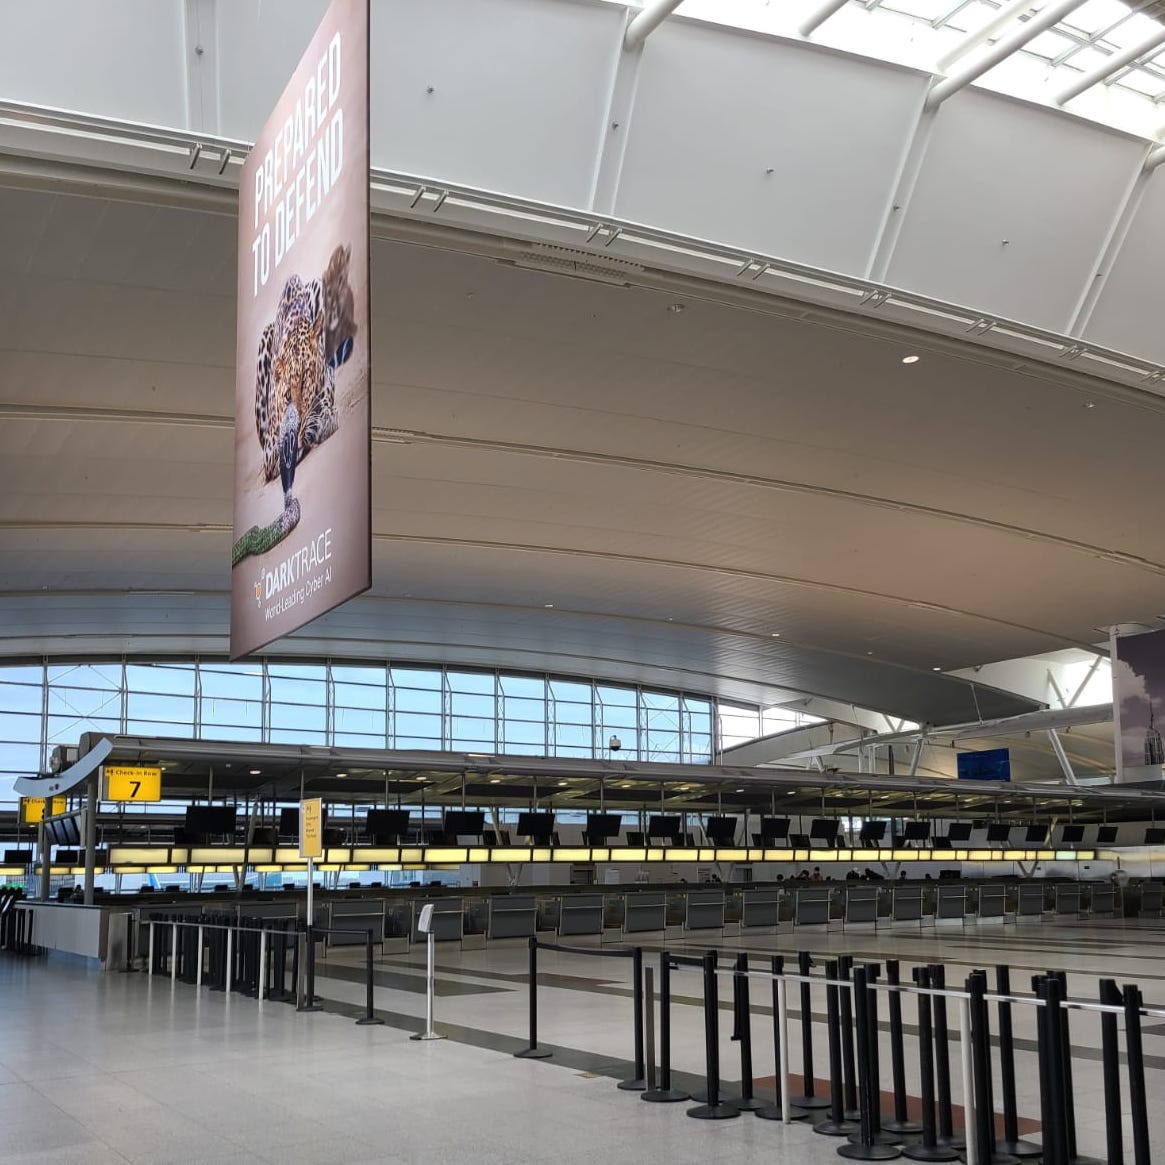
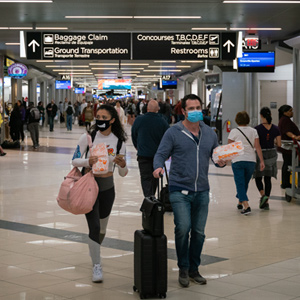

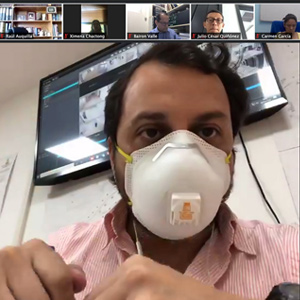
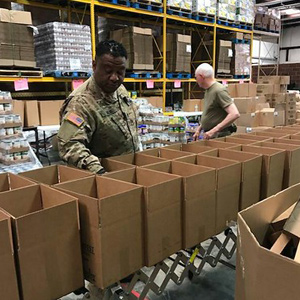
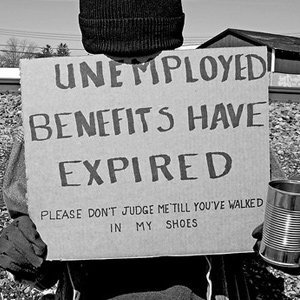
Image Credits: 60 61 62 63 64 65
 Source: John Hopkins University (JHU) and New England Complex Systems Institute Inc. (NECSI) 2020
Spotlight of Countries Beating COVID-19 (blue), Countries That Are Nearly There (green), and Countries That Need to Take Action (purple)
The plots are based on JHU and NECSI’s data, adjusted for each country with a rolling 10-day average to reduce the size of the features, which show up on timescales of a few days. The vertical axis is plotted in arbitrary units, in order to easily compare the shapes of the curves. Data from recovering countries show that it takes about 5-7 weeks of strong interventions to get rid of the majority of cases, while taking half-measures do not work according to NESCI.12
South Korea (country beating COVID-19):
South Korea has employed a comprehensive free, 10-minute testing strategy in drive-thru and walk-in centers, and a contact tracing strategy that has enabled it to successfully curb the spread of coronavirus without a strict lockdown. To flatten the curve, legislation enacted in South Korea gave the government authority to collect mobile phone, credit card, and other data from those who test positive to reconstruct their daily routes. That information, stripped of personal identifiers, is shared on social media apps that allow others to determine whether they may have crossed paths with an infected person.13
In April, South Korea’s Democratic party won a landslide victory in elections and enacted a pledge to reach net zero emissions by 2050 through large-scale investments in renewable energy, the introduction of a carbon tax, the phase out of domestic and overseas coal financing by public institutions, and the creation of a Regional Energy Transition Centre to support workers transition to green jobs. However, the South Korean government supported a $2 billion dollar bailout of the country’s largest coal plant manufacturer in the same month.
Netherlands (country that is nearly there):
The Netherlands has been in a so-called “intelligent lockdown” since March 24. Staying at home is not mandatory, but encouraged. Unlike its direct neighboring countries—Germany, Belgium, the U.K. and Denmark—and unlike many other countries in the rest of the world, there is no hard lockdown, hardly any visible surveillance, very limited testing and borders remain open. Currently, regions will go into lockdown if it has more than 50 infections per 100,000 inhabitants every week in the Netherlands.14 Behind the “intelligent lockdown” is the idea of self-regulation, in combination with good citizenship and individual responsibility to control the number of infections so that people gradually build up immunity.15
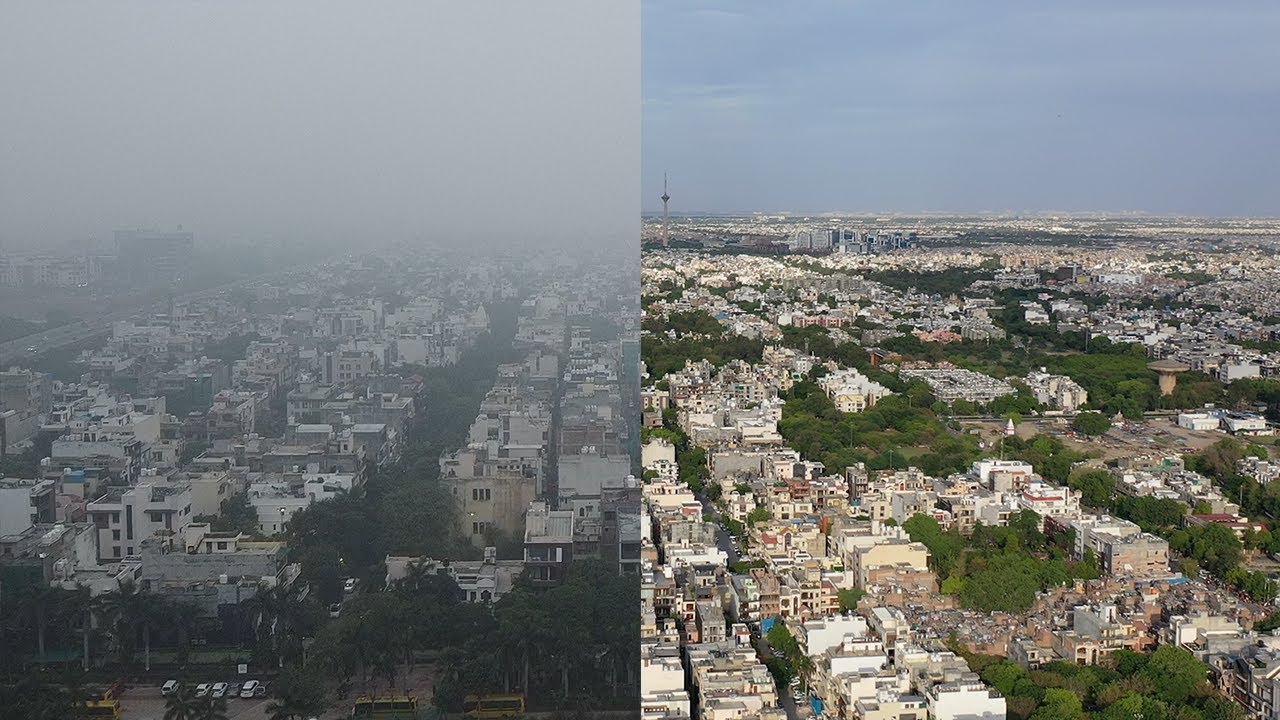 Delhi’s air quality has improved remarkably during the shutdown. Source: Karl Rock, YouTube
India (country that needs to take action):
India placed 1.3 billion citizens under a nationwide lockdown on March 25 and extended until at least May 17, marking it as the world’s largest, and one of the strictest lockdowns.16 Businesses and transportation, schools and religious sites were closed. There have been many challenges to the lockdown– when Prime Minister Narendra Modi announced the lockdown, thousands of migrant workers were initially stranded in cities without a way to reach their home villages, and some took 100-mile journeys on foot. With supply chain disruptions across the country, there has been widespread chaos and suffering among its 300 million poor, as many have relied on the government for food handouts.
Due to the lockdown, India is experiencing the best air quality on record in 2020. New Delhi saw a 60% reduction in PM2.5 levels from March 23 to April 13 from the same period in 2019. However, as Sunil Dahiya, an analyst based in New Delhi for CREA shares, “India (is) a highly fossil-fueled country . . . In order to tackle pollution, we need to tackle that. . . . When we come out of the outbreak, it will be interesting to see if we invest money in the cleaner future,” adding that at the minimum, the government should commit to keeping existing policy pledges.17
There have been a variety of terms describing the global nature of the pandemic. Here are just a few of them described in more detail:
Epicenter:
Wuhan, China the epicenter of the crisis, entered the first 76-Day Lockdown on January 23. The epicenter of the outbreak soon spread to Europe, then the US as these countries saw an exponential growth of cases.
 03/02 Superspreader Lee Man-hee, the leader of the Shincheonji church Source: CNN
Super spreader & exponential growth:
The Shincheonji Church of Jesus has been linked to more than 5,000 coronavirus cases in South Korea. Its leader Lee Man-hee kneeled on the floor at a conference and begged for forgiveness after Seoul city authorities filed a murder complaint against him for failing to cooperate with government measures to curb the epidemic. Cruise ships have also become settings for outbreaks of infectious diseases because of their closed environment and contact between travelers from many countries. More than 800 cases of laboratory-confirmed COVID-19 cases occurred during outbreaks on three cruise ship voyages, and cases linked to several additional cruises have been reported across the United States. Transmission occurred across multiple voyages from ship to ship by crew members; both crew members and passengers were affected; 10 deaths associated with cruise ships have been reported to date, according to the CDC on March 27, 2020.18
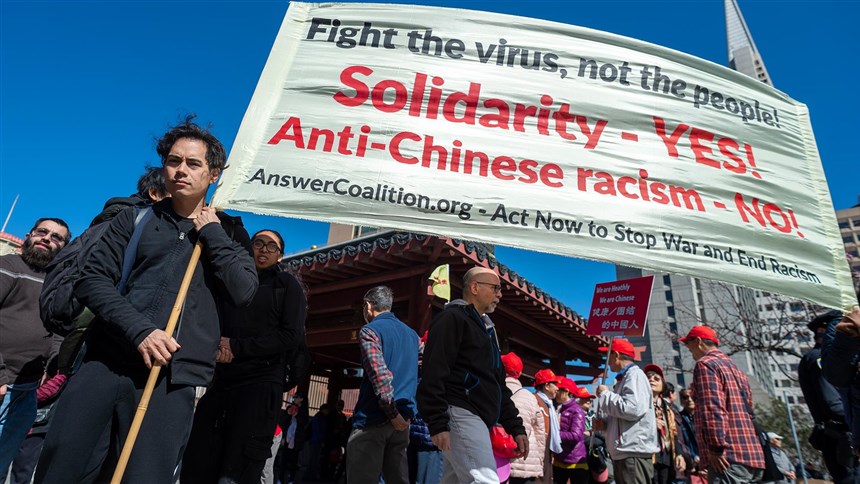 03/18 Protests against racism in San Francisco. Source: KimmyYam
Racialized terms:
On March 16, President Trump, started stoking xenophobia with his rhetoric about the coronavirus through terms such as the “Chinese virus.” In 2020, we’ve seen people arrested in New York City for hate crimes against Asian Americans, while researchers in San Francisco found more than 1,000 reported cases of xenophobia toward Chinese Americans and their communities between January 28 and February 24.19 In the past, colloquial names for epidemics have appeared for different reasons— for example, the Spanish flu actually started in Kansas, but the name took hold because in the middle of World War I, in which Spain remained neutral, Spain was one of the only Western nations willing to report frankly on the pandemic.
Mobility:
Mobility patterns are also changing as more people are working from home. Some have the privilege and luxury to pause and move to second homes, while rising tension with year round residences have become prevalent, as many are struggling to pay rent. There has been a steep drop in ridership of public transit, while some trains have been used to transport the sick. Airports are reducing operations and some are at risk of closure. Airlines under pressure have reduced scheduled flights by 60-90%, as some companies have been criticized for burning fuel flying empty ‘ghost’ planes.20 Many ports of entry are suspending entry for foreigners, immigrants and quarantining citizens who have been to countries stricken by COVID-19 to contain the spread of the virus.
Remote working:
Companies have shifted to enhance safety protocols and enable remote work where possible, with increases in paid sick and family leaf. Some companies have also sought alternatives, such as cutting employees’ work hours by 50%, rather than laying off 50% of staff.
Environment & impacts on climate change:
In the US, the EPA temporarily relaxed pollution enforcement measures to allow companies to focus on survival. Many cities such as Albuquerque and New Mexico, are reversing recent bans on plastic bags,21 while stores are readopting plastic containers and wrapping on fruits and vegetables. However, some governments are acting to ensure an environmentally conscious comeback. In April, New York State passed the Accelerated Renewable Energy Growth and Community Benefit Act, which will create a first-in-the-nation Office of Renewable Energy Siting to improve and streamline the process for environmentally responsible and cost-effective siting of large-scale renewable energy projects across New York–including the mandate to obtain 70% of the state’s electricity from renewable sources.22 Some initiatives to ensure an environmentally conscious recovery effort include the C40 Covid Task Force, while the Climate Interactive green equitable stimulus plans tracker collects examples where city, state, and national leaders are making COVID-19 recovery plans in ways that could also produce benefits in racial, gender, and economic equity and in climate change mitigation and resilience.
Economy & Supply Chain:
The impact on the economy is especially severe for small and medium enterprises that are affected by quarantines. Lockdowns have resulted in unprecedented unemployment and reduced work schedules. The coronavirus crisis also reveals the fragility of the modern supply chain– recent data shows the week-on-week trade in China, the US and Europe halved because of the crisis. According to the World Economic Forum, diverse sourcing and digitization will be the key to building stronger, smarter supply chains and ensuring a lasting recovery. The Brookings Institute has also proposed using a framework of health and social protection, monetary policy, fiscal policy, and financial and regulatory policies to flatten the “human suffering, recession, and bankruptcies” curve through timely, time-bound, targeted, and transparent measures. The IMF policy tracker and University of Minnesota’s Center for Infectious Disease Research and Policy Supply Chain Issues Tracker collect examples on this front.
Technology & Surveillance:
Unprecedented levels of surveillance, data exploitation, and misinformation are being tested, as measures often only used temporarily in emergencies are being taken. Some countries such as South Korea use exemptions in data protection laws to share data, and governments and citizens must ensure the measures are temporary, necessary, and proportionate. Privacy international’s global responses tracker and WHO’s Digital Health & innovation page collect examples of technological responses to the virus. For example, in response to the infodemic, the WHO’s communication team has been working with social media channels to ensure that anytime someone searches the internet for “coronavirus” or a related term, a box comes up directing them to a reliable source such as the WHO or the CDC.
Questions for the future:
- What do equitable stimulus plans that focus on people and the environment look like in the future?
- How will privacy and public trust towards the government be ensured after the pandemic?
- How will personal travel patterns, local and global production change? How can we manufacture in a circular economy and reduce the mounting plastic pollution as a result of COVID-19?
As we reflect on the spatial and rhetorical devices of the COVID-19 crisis, we recognize that the coronavirus is not only a pandemic on a global scale, it is also an infodemic that we are fighting, which the WHO recognized and defined in February as “an overabundance of information—some accurate and some not—that makes it hard for people to find trustworthy sources and reliable guidance when they need it.”23 In this project, we aim to explore and untangle some of the spatial and rhetorical dimensions of the pandemic, as media, public, political attention has scrutinized it in detail. We hope to open up discussion through questions for the future as we imagine the possibilities after the crisis.
References:
1. Salcedo, A., Yar, S., & Cherelus, G. (2020, May 8). Coronavirus Travel Restrictions, Across the Globe. Retrieved from https://www.nytimes.com/article/coronavirus-travel-restrictions.html ↩
2. Mark Wilson, “The story behind ‘flatten the curve,’ the defining chart of the coronavirus” Fast Company, March 2020. https://www.fastcompany.com/90476143/the-story-behind-flatten-the-curve-the-defining-chart-of-the-coronavirus ↩
3. A PDF of Public Health Order No. C19-07 can be found here: https://www.sfdph.org/dph/alerts/files/HealthOrderC19-07-%20Shelter-in-Place.pdf ↩
4. SFGovTV. (2020, March 16). City Officials to announce new Public Health Order. Retrieved from https://www.youtube.com/watch?v=_VwHUvVyO_M ↩
5. Keshia Cluckey and Henry Goldman. “De Blasio Insists on NYC Shelter-in-Place Order; Cuomo Resists” Bloomberg News, March 20, 2020. ↩
6. Governor Andrew M. Cuomo. (2020, March 20). Governor Cuomo Signs the “New York State on PAUSE” Executive Order. Retrieved from https://www.youtube.com/watch?v=XxA4HL-I8sc ↩
7. Celia Viggo Wexler, “Coronavirus has shown that the economy is more important to Trump than elderly people” Euronews, March 2020. https://www.euronews.com/2020/03/28/coronavirus-has-donald-trump-dan-patrick-ready-sacrifice-older-people-view ↩
8. Larkin, Brian. “The Politics and Poetics of Infrastructure”. The Annual Review of Anthropology.2013 ↩
9. All the information is extracted from the photos of the photo grid. Refer to their sources. ↩
12. Izvorski et al. (2020). A policy framework for mitigating the economic impact of COVID-19. Brookings Institute. https://www.brookings.edu/blog/future-development/2020/04/20/a-policy-framework-for-mitigating-the-economic-impact-of-covid-19/ ↩
11. McFarlane, Sarah. (April 6, 2020). How Environmental Movement Plans to Leverage the Coronavirus Pandemic. WSJ. https://www.wsj.com/articles/how-the-environmental-movement-plans-to-leverage-the-coronavirus-pandemic-11586164191 ↩
12. New England Complex Systems Institute Inc. (2020). Some are Winning - Some are not: Which countries are Best in Beating COVID-19? https://www.endcoronavirus.org/countries ↩
13. Sternlicht, Alexandra. (April 30, 2020). South Korea’s Widespread Testing And Contact Tracing Lead To First Day With No New Cases. Forbes. ↩
14. Wiltsham, Serena. (May 7, 2020). What do the experts have to say about the easing of the intelligent lockdown? Dutch Review. https://dutchreview.com/news/dutch/what-do-the-experts-have-to-say-about-the-easing-of-the-intelligent-lockdown/ ↩
15. Kraaijenbrink, Jeroen. (April 14, 2020). The Dutch Answer To COVID-19: The ‘1.5 Meter Economy’. Forbes. https://www.forbes.com/sites/jeroenkraaijenbrink/2020/04/14/the-dutch-answer-to-covid-19-the-15-meter-economy/#731480084627 ↩
16. New York Times. (May 10, 2020). India Coronavirus Map and Case Count. New York Times. https://www.nytimes.com/interactive/2020/world/asia/india-coronavirus-cases.html ↩
17. Wright, Rebecca. (April 1, 2020). The world’s largest coronavirus lockdown is having a dramatic impact on pollution in India. CNN. https://www.cnn.com/2020/03/31/asia/coronavirus-lockdown-impact-pollution-india-intl-hnk/index.html ↩
18. Moriarty LF, Plucinski MM, Marston BJ, et al. Public Health Responses to COVID-19 Outbreaks on Cruise Ships — Worldwide, February–March 2020. MMWR Morb Mortal Wkly Rep 2020;69:347-352. DOI: http://dx.doi.org/10.15585/mmwr.mm6912e3external icon. ↩
19. Scott, Dylan. (2020). Trump’s new fixation on using a racist name for the coronavirus is dangerous. Vox. https://www.vox.com/2020/3/18/21185478/coronavirus-usa-trump-chinese-virus ↩
20. Hamwey, Robert. (April 20 2020). Environmental impacts of coronavirus crisis, challenges ahead. UN Conference on Trade and Development. https://unctad.org/en/pages/newsdetails.aspx?OriginalVersionID=2333 ↩
21. Flaccus, Gilliana nd the Associated Press. (April 2020). Coronavirus fears spur cities to reverse hard-fought bans on single-use plastic. Fortune. https://fortune.com/2020/04/08/coronavirus-reverse-bans-single-use-plastic/ ↩
22. Bates, Michael. (April 6 2020). NY Legislation Creates New Siting Process for Renewables. North American Wind Power. https://nawindpower.com/cuomo-passes-renewable-energy-legislation ↩
23. Katella, Kathy. (April 13, 2020). A COVID-19 ‘Infodemic’? How to Make Sense of What You’re Reading. Yale Medicine. https://www.yalemedicine.org/stories/covid-19-infodemic/ ↩
Image Credits:
1. 0417 Scanning Electron Microscope, NIAD-RML, NIH ↩
2. 0417 Ultrastructural Morphology, Alissa Eckert and Dan Higgins, CDC ↩
3. 0418 CDC Test Kit, CDC ↩
4. Hand Washing, Flickr, Peter Wong ↩
5. 0310 Healthcare Workers Wearing PPE, District Hospital, tirur, Javed Anees ↩
6. 0418 R0, Vox ↩
7. Physical Distance, US Airforce, Trang Le ↩
8. Stay Home, Flickr, Eden, Janine and Jim ↩
9. 0409 Grocery Store Sticker, Spenser Krut ↩
10. Exercise, Spenser Krut ↩
11. 6 Feet / 2 Meters, Spenser Krut ↩
12. 0327 Emergency ALert, CBC News ↩
13. Marc A. Hermann, MTA New York City Transit, April 29 licensed by CC2.0 ↩
14. Rafael Robles, Flickr, May 27 licensed by CC2.0 ↩
15. Pippipip, April 11 licensed by CC4.0 ↩
16. Anthony Quintano, Flickr, April 16 licensed by CC2.0 ↩
17. Kritzolina, March 30 licensed by CC4.0 ↩
18. Russ Allison Loar, April 28 licensed by CC4.0 ↩
19. Oregon National Guard, Warm Springs leaders Oregon National Guard Discuss COVID-19 support, April 21 licensed by CC2.0 ↩
20. Gyles Glover, Flickr, April 14 licensed by CC2.0 ↩
21. Judgefloro, May 17 licensed by CC0 1.0 ↩
22. TitiNicola, May 6 licensed by CC4.0 ↩
23. Alex King, Greece Is, March 16 ↩
24. Caveheraa, Twitter, March 17 ↩
25. Wiles, S., Morris, T., XTOTL March 13 ↩
26. Envato, MSTech, February 13 ↩
27. Members of the Colorado National Guard assist San Miguel County and the Colorado Department of Public Health & Environment with a COVID-19 drive-up testing station in Telluride, Colorado, March 17, 2020 by Jennifer Dinsmore, San Miguel County Sheriff’s Office, licensed under CC BY-SA 2.0, cropped ↩
28. PRNG continues its mission of screening all passengers arriving at the different airports and ports of Puerto Rico to stop the spread of COVID-19 on the island by Puerto Rico National Guard, photos by: Sgt. Carlos Chabert & Spc. Melanie Colondres, licensed under CC BY-SA 2.0, cropped ↩
29. A Covid-19 checkpoint on Mittraphap road in Nong Khai province on 27 March 2020 by Thai PRD, licensed under CC BY-SA 2.0, cropped ↩
30. View of the police control post of the police in Grossenbrode during the COVID-19 pandemic by Fabian Horst, licensed under CC BY-SA 4.0, cropped ↩
31. Police checkpoint near the border of Metro Manila with San Pedro, Laguna in Muntinlupa by City Government of Muntinlupa/Rayman Arcega, a work created by an officer or employee of the Government of the Philippines, cropped ↩
32. Soldiers with the Montana National Guard perform a COVID-19 screening test for an out of state traveler at the Amtrak Train Station in Shelby, Montana, April 3, 2020 by U.S. Air National Guard photo by Staff Sgt. Brandy Burke, a work prepared by an officer or employee of the United States Government as part of that person’s official duties under the terms of Title 17, Chapter 1, Section 105 of the US Code ↩
33. COVID-19 pandemic checkpoint on Great Eastern Hwy in The Lakes, Western Australia by Gnangarra, licensed by CC BY 2.5 AU, cropped ↩
34. Identifying Critical Infrastructure during Covid-19 by CISA ↩
35. Version 3.0-CISA Guidance on Essential Critical Infrastructure Workers by CISA, cropped ↩
36. Interim Guidance for Implementing Safety Practices for Critical Infrastructure Workers Who May Have Had Exposure to a Person with Suspected or Confirmed COVID-19 by CDC&CISA ↩
37. Version 3.0-CISA Guidance on Essential Critical Infrastructure Workers by CISA, cropped ↩
38. North Carolina Army National Guard, Maj. Andrew Burquest (right), executive officer and 1st. Sgt. Michael Russel, speaks with Lisa Richardson during a tour of the food bank in Winston-Salem, N.C. by Sgt. Wayne Becton, North Carolina National Guard Public Affairs, licensed under CC BY 2.0, cropped ↩
39. Last train of Wuhan metro before authorities lock down the city for the Wuhan coronavirus outbreak by Chinanews.com, licensed by CC BY 3.0, cropped ↩
40. Policemen wearing masks patrolling Wuhan Tianhe Airport after the Coronavirus Outbreak by Chinanews.com, licensed by CC BY 3.0, cropped ↩
41. Huiming road ,Wuchang District, Wuhan during 2019-nCoV coronavirus outbreak by Painjet, licensed under CC BY-SA 4.0, cropped ↩
42. A roadblock in Yuhuan of eastern China’s Zhejiang province to contain the 2019-20 Coronavirus outbreak by Rowingbohe, licensed under CC BY-SA 4.0, cropped ↩
43. Exit-Entry Permit for Residents During the Outbreak of 2019-nCoV, issued by People’s Government of Jintan by Lekhaki, Copyright Law of the People’s Republic of China: Article 5 ↩
44. This slogan translates as “We work together and will eventually control the disease” by Super Wang, licensed under CC BY-SA 4.0, cropped ↩
45. Residents in Wuhan were buying daily necessities and food across the fence gate because their community had been closed by Painjet, licensed under CC BY-SA 4.0, cropped ↩
46. Hwy 407 - Very light traffic during the COVID-19 (Wuhan Coronavirus) outbreak by Raysonho @ Open Grid Scheduler/Scalable Grid Engine, licensed under CC0 1.0, cropped ↩
47. MTA New York City Transit Sanitizes Stations and Subway Cars BY Andrew Cashin/MTA New York City Transit, licensed under CC BY-SA 2.0, cropped ↩
48. MTA Issues Update on Precautions Against Coronavirus by Metropolitan Transportation Authority, licensed under CC BY-SA 2.0, cropped ↩
49. Interior of a bus of TriMet (the transit agency serving the Portland, Oregon, metropolitan area) with the majority of seats temporarily marked with “Don’t sit here” signs by Steve Morgan, licensed under CC BY-SA 4.0, cropped ↩
50. The staff in red reminds passengers to wear masks throughout their journeys and maintain social distancing in the carriage during COVID-19 pandemic by Painjet, licensed under CC BY-SA 4.0, cropped ↩
51. MTA Installs Plexiglass and Vinyl Barriers to Protect Employees and Riders During COVID-19 Pandemic by Andrew Cashin / MTA NYC Transit, licensed under CC BY-SA 2.0, cropped ↩
52. Subway Closure Night 2 - Coney Island Terminal by Marc A. Hermann / MTA New York City Transit, licensed under CC BY-SA 2.0, cropped ↩
53. Social Distancing Guide Markings on Subway Platform by Marc A. Hermann / MTA New York City Transit, licensed under CC BY-SA 2.0, cropped ↩
54. MTA Begins 24/7 Cleaning Operation and New MTA Essential Plan Night Service by Marc A. Hermann / MTA New York City Transit, licensed under CC BY-SA 2.0, cropped ↩
55. Delta people disinfect the surfaces of the cabin in a Boeing 757 in Atlanta, Ga., on Friday, March 6, 2020 by Delta News Hub, licensed under CC BY-SA 2.0, cropped ↩
56. A nearly empty flight from PEK to LAX in March 2020 amid the COVID-19 pandemic by Mx. Granger is licensed under CC0 1.0 Universal Public Domain Dedication, cropped ↩
57. A nearly empty international departures area at Beijing Capital International Airport in March 2020 amid the COVID-19 pandemic by Mx. Granger is licensed under CC0 1.0 Universal Public Domain Dedication, cropped ↩
58. Delta Air Lines planes (mostly 737’s and A321’s) parked at MCI on the north end of taxiway F and runway 1R/19L (in the background) due to COVID-19 Pandemic by Delta Planes at MCI, elisfkc2, licensed under CC BY-SA 2.0, cropped ↩
59. Citizen-Soldiers of the Puerto Rico National by the Puerto Rico National Guard, , licensed under CC BY-SA 2.0, cropped ↩
60. 0511 Empty JFK Airport, Jin Hong Kim ↩
61. Mobility, Flickr, Chad Davis ↩
62. Wildlife Sighting, US Airforce, Mike Kaplan ↩
63. Remote Working, Asamblea Nacional del Ecuador ↩
64. Supply Chain, Georgia National Guard ↩
65. Economic Recession, Blue Jay Day ↩
.jpg)
.jpg)