The Green Dot Effect: Neighborhood Recovery after Hurricane Katrina
On January 11th, 2006, the Times-Picayune ran an article that would dramatically alter the trajectory of reconstruction in New Orleans after Hurricane Katrina.
Source: ResearchGate
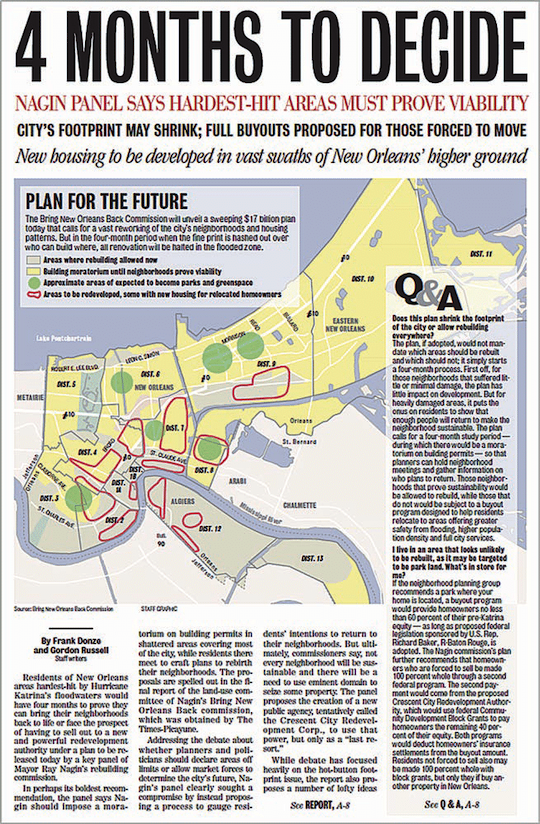
“4 MONTHS TO DECIDE,” blared the headline: “Nagin panel says hardest hit areas must prove viability.” The accompanying subtitles read “City’s footprint may shrink” and “Full buyouts for those forced to move.”
Thus, the infamous “Green Dot Map” entered the local lexicon, and for thousands of displaced New Orleanians, “this map represented the graphic manifestation of their worst fears of losing their homes and the right to return to their neighborhoods.” (Lamb 2019)
Today, the map is widely regarded as the major catalyst for transforming post-disaster planning in New Orleans from a top-down technocratic approach led by professional planners, to a bottom-up, community-driven approach as residents in heavily damaged areas mobilized to save their homes.
To better understand the considerable power of the map in shaping the reconstruction of New Orleans, we will explore the forces that created the map, and aim to answer the following questions:
- Who created it and what was their intention?
- How did it come to be published in the Times-Picayune?
- How did the visual rhetoric of the map lead residents to see it as the “manifestation of their worst fears?”
Next, we will explore the immediate and lasting implications of the map on New Orleans at a city-wide and neighborhood level. Using three neighborhood case examples, we will answer the following the questions:
- What overall demographic changes did New Orleans see in the wake of Katrina?
- How did the Green Dot Map align with these changes?
- How did recovery vary between neighborhoods, and what role did the Green Dot Map play?
History of the Green Dot Map
While the Green Dot Map first reached the public via the Times-Picayune, its origins lie before the article, in the Urban Planning Committee of the Bring New Orleans Back Commission (BNOBC), a group convened by the mayor, Ray Nagin, to guide the recovery and reconstruction of the city.
Source: ResearchGate
An earlier version of the Green Dot Map was created by the BNOBC, a single image in a 69-slide powerpoint presentation titled: “Action Plan for New Orleans: The New American City”. The slides supporting the graphic discussed having parks in every neighborhood, incorporated into the city stormwater management system, and the green dots appeared visually quite different - drawn with dashed green lines and no fill. Though the areas they covered were labeled “areas for future parkland,” they were intended to be approximate locations where parks could be incorporated into the neighborhood, not suggestions that entire neighborhoods be replaced by parks. The presentation proposed a series of next steps, including identifying properties that could be part of the system and securing funding for “park restoration.”
The second Green Dot Map - the one that reached the public - was created by the Times-Picayune staff, and condensed several graphics from the aforementioned presentation into a single map. The visual rhetoric of the map, and the vague language of its legend do not make it entirely clear what the different areas mean. Between the “areas where building is allowed,” “building moratorium until neighborhoods prove viability,” and “areas to be redeveloped,” some areas even seem to hold contradictions (e.g., areas flagged for redevelopment but also needing to prove viability).
But the most significant visual aspect of the map, and the piece the public responded to with the strongest opposition, were the solid green circles labeled “approximate areas to become park and greenspace.” The dashed green circles of the BNOBC map, intended to be tentative suggestions for areas that could become part of the stormwater protection system, were suddenly communicated as nearly definitive greenspaces that would wipe out entire neighborhoods. In conjunction with the bold headlines about “proving viability,” this is the aspect of the map that spurred the neighborhood response.
The Great Footprint Debate
Source: NOLA.com
However, while the initial Green Dot map was intended to be more provisional than the one that reached the public, both maps point to a larger debate occurring in planning circles at the time. This came to be known in New Orleans as The Great Footprint Debate.
As New Orleans worked to recover from the devastation left in Katrina’s wake, it was left with the difficult task of envisioning its future. With much of the city flooded, damaged, or destroyed, the city had to face the question: how should New Orleans be rebuilt and what would that process look like? Richard Campanella, one of the geographers involved in drafting the BNOBC Green Dot Map, explained the core question shaping this reconstruction process, which ultimately led to the vision articulated in the Green Dot Map:
“Should the entire city be restored…or should the city shrink its urban footprint, rebuilding on higher ground and depopulating far-flug, heavily damaged neighborhoods so that as “green space” they may buffer the urban core future storms?” (Campanella 2015)
“Greenspacing” had by this time gained favor among environmentally conscious types nationwide… Planners, ecologists, and geographers lectured on the dangers of hardening fluvial deltas with structural solutions, such as levees and canals, and the benefits of softening the urban periphery with multiple lines of defense. Tactics in that strategy included a vast apron of wetlands integrated with non-structural solutions, such as living in higher density on higher ground and building on piers above the grade. (Campanella 2015)
With the city flooded and in need of stronger flood mitigation strategies, greenspacing provided an attractive rationale for prioritizing the environmental resiliency of the city to withstand future disasters. But what this strategy ignored was how different communities were impacted - that is, who was covered by the green dots? And who would be allowed to return to the city? Or, as Michael Sorkin wrote:
“The idea of a massive, environmentally driven cordon sanitaire has been dropped as a master of planning policy, but the plan is (and perhaps can only be) mute about who, finally will be able to return.” (Sorkin 2014)
Others have reflected on the Great Footprint Debate in still less benign terms, situating the rationale for greenspacing New Orleans in a longer history of racism and racial tension. As Mike Davis wrote:
“In a nutshell, [the Great Footprint Debate] reframed the historical elite desire to shrink New Orleans’s socioeconomic footprint of Black poverty (and Black political power) as a crusade to reduce the city’s physical footprint to contours commensurate with flood safety and a fiscally viable urban infrastructure.” (Davis 2014)
Citywide Demographic Changes: 2000 to 2010
Following Hurricane Katrina, New Orleans saw a dramatic decrease of its overall population, from around 483,000 people in 2000, five years before Katrina,to 343,000 in 2010, five years after Katrina. Visualizing these shifts in total population using Census data from 2000 and 2010 shows that population decreases occurred across the city, as people were displaced from their homes and did not or could not return.
Yet while the city shrank in total population size, there was a distinctly racial component to the population change.
Change in New Orleans’ Black Population: 2000 to 2010
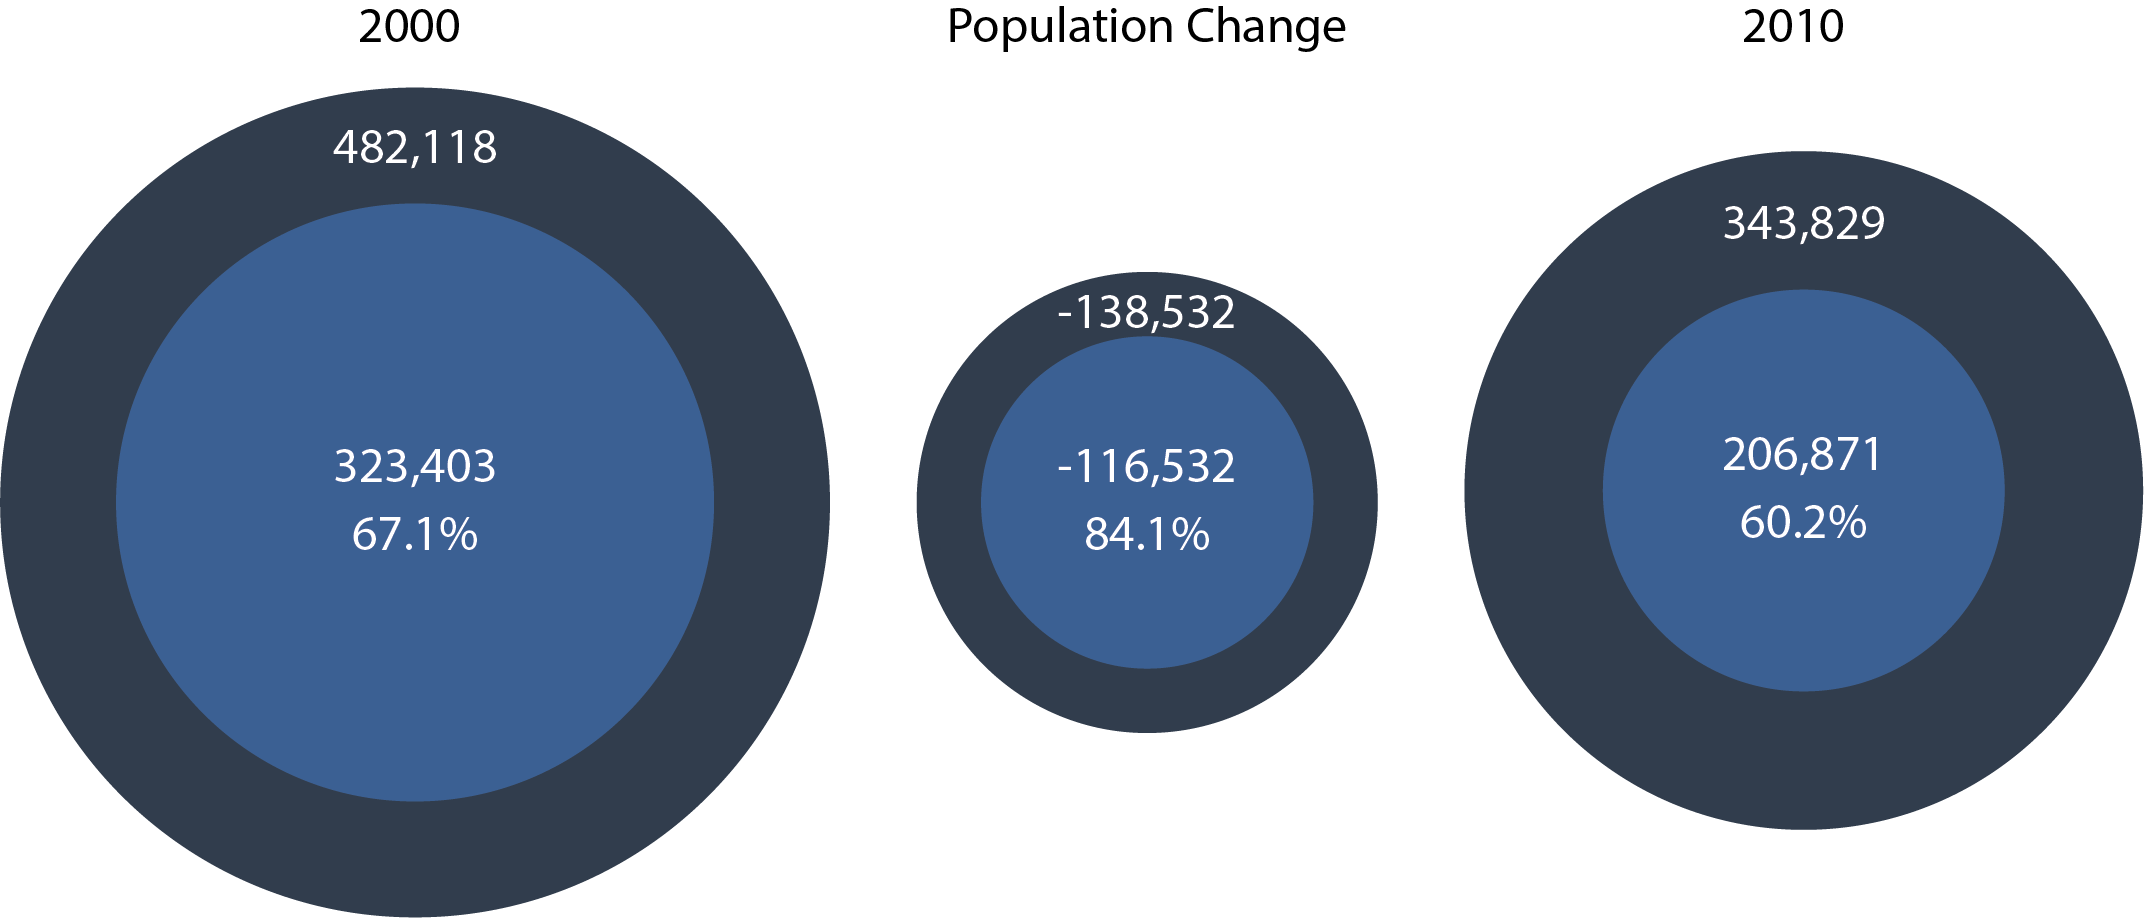
In 2000, over two thirds (67%) of the New Orleans was Black. But five years after Katrina, as thousands of residents left the city and were not able to return, New Orleans experienced a disproportionately high loss of Black residents. Of the total 138,000 people who did not return to the city by 2010, 116,000, or 84%, were Black. Five years after Katrina, the racial demographics of New Orleans had changed significantly - what was once a strongly majority Black city was now around 60% Black.
Layered on top of the racial shift was also a class dimension. Joseph C. Canizaro, a real estate mogul with close ties to Ray Nagin and George W. Bush, and who had heavy influence in shaping the rebuilding of New Orleans, remarked:
“As a practical matter, these poor folks don’t have the resources to go back to our city, just like they didn’t have the resources to get out of our city. So we won’t get all those folks back. That’s not what I want, it’s just a fact.”
Looking, then, at the median household income distribution in 2000, and Canizaro’s attitude towards the “poor folks” who simply wouldn’t be able to return to the city (“it’s just a fact”), it is not surprising that the green dots fell in predominantly low income, and middle income neighborhoods, never in the highest income neighborhoods. Poorer neighborhoods were deemed “less viable,” and thus eligible for greenspacing, while wealthier neighborhoods were deemed worthwhile investments for rebuilding homes, commercial businesses, and infrastructure.
By 2010, five years after Katrina, wealth became more concentrated in a few areas, while most low income areas did not see the same increases. Income inequality had increased across the city.
Changes at the Neighborhood Level
In order to understand the impact of the Green Dot Map at the neighborhood level, we will explore three neighborhoods that all saw significant levels of flooding and damage, but have had different recovery trajectories since 2005. Notably, two were covered by green dots in the Green Dot Map (Broadmoor, Lower Ninth Ward), while the third was not (Lakeview). Thus, we can not only begin to understand how the green dots had social and political implications in terms of where they were placed in the city, but also in terms of their social and political implications for catalyzing neighborhood-level responses.
Broadmoor
Broadmoor is generally regarded as one of the biggest “success stories” of post-Katrina neighborhood recovery, despite its location at the epicenter of New Orleans’ crescent and the extensive flooding and damage it endured due to the hurricane. This success has been widely understood as a response to the Green Dot Map, which covered the entire Broadmoor neighborhood, and led to a huge community-led planning effort headed by Latoya Cantrell, then president of the Broadmoor Improvement Association, and current 2020 mayor of the city of New Orleans. Cantrell worked with residents and religious leaders in the community to oppose the plan laid out in the Green Dot Map and prove the viability of the neighborhood, establishing a platform through which neighborhood residents could volunteer or voice their opinions. A system of “block captains” ensured that a point person for each block was responsible for contacting displaced residents across the country, asking about their needs, and persuading them to return, even as the neighborhood was still rebuilding. As part of the planning process, Cantrell facilitated the rebuild and renovation of Andrew H. Wilson Highschool and the reopening of Rosa F. Keller Library. With the reopening of the library came the inaguaration of a new cafe inside it - the defiantly named Green Dot Cafe, a testament to the neighborhood’s resiliency and the legacy of the Green Dot Map.
Source: Clinton Foundation, Neighborhood Partnerships Network
Lower Ninth Ward
The Lower Ninth Ward was one of the hardest hit neighborhoods because its location directly to the industrial canal, which failed during the storm. Not only did the neighborhood sustain huge damage in 2005, but its recovery efforts have been slow and ongoing, and many residents have still been unable to return to their homes, even in 2020.
Before the storm the neighborhood “was 98% African American, 59% of families owned their homes and more than half of them had no mortgage” (L9WHA 2020). Many non-profits and neighborhood groups emerged in 2006 to rebuild after the flood, such as lowernine.org, 9th Ward NENA, and L9WHA, and many of these organizations are still working to rebuild today. lowernine.org explains: “Rebuilding in the Lower Nine has lagged behind that of other neighborhoods as a result of poverty, the scale of the devastation and local, state and federal government inaction. Dealing first with toxic mold, then toxic FEMA trailers and toxic Chinese Sheetrock, then with unscrupulous contractors, insurance and mortgage companies, and finally struggling under a discriminatory governmental recovery program, it became clear that the Lower Ninth Ward would be much slower to recover than other areas of New Orleans.”
Source: Kevin Fujii, Ricky Carioti, L9WHA
Lakeview
In contrast with Broadmoor and the Lower Ninth Ward, Lakeview was not covered by a Green Dot, though the neighborhood faced extremely high levels of flooding (higher than Broadmoor, and similar to the Lower Ninth Ward). Also notably, Lakeview is one of the few neighborhoods in New Orleans that has come back richer than before Katrina. In this predominantly white, middle-to-upper class neighborhood, recovery and reconstruction began quickly as people “could pay rent on a temporary place while paying a mortage on a destroyed home. They could use private funds to improve those homes while waiting for government rebuilding subsidies. And they could hire lawyers, as needed, to navigate the sea of paperwork” (Robertson & Fausset 2015). Many neighborhood associations pre-existed Katrina and contributed to the neighborhood redevelopment effort, however the Lakeview Civic Improvements Association (LCIA), was the most prominent in steering the City’s District 5 recovery plan. The LCIA issued a $114 Million recovery plan which would revitalize greenspace, rebuild private residences, build infrastructure and much more.
Source: GoNOLA.com, Pinimg, Nolaplans.com
Concluding Thoughts
While our research focuses on the implications of the Green Dot for reconstruction of New Orleans after Katrina, there are lessons to be learned for other cities. As Rebecca Solnit wrote,
“The American Society of Civil Engineers said in 2007 that the U.S. had fallen so far behind in maintaining its public infrastructure—roads, bridges, schools, dams—that it would take more than a trillion and a half dollars over five years to bring it back up to standard. Instead these types of expenditures are being cut back. At the same time, public infrastructure around the world is facing unprecedented stress, with hurricanes, cyclones, floods, and forest fires all increasing in frequency and intensity. It’s easy to imagine a future in which growing numbers of cities have their frail and long-neglected infrastructures knocked out by disasters and then are left to rot, their core services never repairs or rehabilitated. The well-off, meanwhile, will withdraw into gated communities, their needs met by privatized providers.” (Solnit 2014)
As climate change increases the frequency and intensity of natural disasters, and urban inhabitants face displacement in their wake, post-disaster planning will only become more essential.
Sources
Richard Campanella, “A Katrina Lexicon,” Places Journal, July 2015. Accessed 07 May 2020. https://doi.org/10.22269/150727
Richard Fausset & Campbell Robertson, “10 Years After Katrina,” August 2015. Retrieved 11 May 2020, from https://www.nytimes.com/interactive/2015/08/26/us/ten-years-after-katrina.html
L9WHA: Lower Ninth Ward Homeownership Association. 2016. https://www.l9wha.org/about
Zachary Lamb, “Connecting the Dots: The Origins, Evolutions, and Implications of the Map that Changed Post-Katrina Recovery Planning in New Orleans,” November 2019. Accessed 07 2020. https://link.springer.com/chapter/10.1007/978-3-030-27205-0_3
Carol M. Reese, Michael Sorkin, Anthony Fontenot, “New Orleans Under Reconstruction: the Crisis of Planning,” Verso Books, July 2014.
Kristina Shevory, “A New Orleans Neighborhood Rebuilds,” February 2007. Retrieved 11 May 2020, from https://www.nytimes.com/2007/02/25/realestate/25nati.html
Images
ResearchGate, https://www.researchgate.net/publication/337225537_Connecting_the_Dots_The_Origins_Evolutions_and_Implications_of_the_Map_that_Changed_Post-Katrina_Recovery_Planning_in_New_Orleans
GoNOLA.com, https://gonola.com/things-to-do-in-new-orleans/history/nola-history-the-lakeview-neighborhood
Pinimg, https://i.pinimg.com/originals/a9/78/a9/a978a94a35ea1150bf8c6d7320e8c739.jpg
Nolaplans.com, https://nolaplans.com/plans/Lambert%20Intermediate/District_5_Plan_FINAL%20PLAN%20REPORT%20Lakeview%2010-04-06.pdf
Clinton Foundation, https://stories.clintonfoundation.org/bringing-sound-back-to-broadmoor-how-we-saved-our-new-orleans-neighborhood-8e3d54c5c81f
Neighborhood Partnerships Network, https://image.isu.pub/121115184932-2093e37a520b43f28f264849e42109e0/jpg/page_1.jpg
Kevin Fujii, http://www.kevinfujii.com/hurricanes
Ricky Carioti, https://ticotimes.net/2015/08/29/in-the-lower-ninth-ward-of-new-orleans-some-traditions-refuse-to-die
L9WHA, https://www.l9wha.org/single-post/2015/10/15/Detours-on-the-Road-Home