Webmaps Part 2 - Scrollytelling Map
Making a Scrollytelling map with Mapbox Storytelling
Now that you have learned QGIS, Git, html, css, javascript and some Mapbox libraries, let's make a custom story map using Mapbox GL JS and Scrollarama.
This is a format that has become exponentially more common over the past five years or so for telling stories through maps. While a number of newsrooms have used propietary tools built for this purpose for awhile, recently Mapbox implementation has lowered the barrier to entry a lot.
The below animation is a fairly simple rendition of what this can look like, but they can easily get pretty immersive. See this NYT interactive for the insanely fancy, and this WaPo story for a very clever use of a self-collected dataset to tell a much larger story.

Setup
Create a Mapbox Studio account
Because it reduces the complexity of our setup, we'll be adding our data layers through mapbox studio. Make an account if you don't have one already, or login if you do. Later on, we will style our data layers again in mapbox studio, and add them to our map using their layer-id.
While this method gets our maps up and running quicker, for those with a bit more experience and interested in a more flexible storytelling format, I recommend this tutorial from the GSAPP course Points Unknown (I also recommend taking the course!)
File Setup
We're going to build off of the last tutorial to build this, so make sure you have that up and running first, or download the completed repo here.
We'll start by creating a new repo called webmap_2_storytelling, cloning it to your local filesystem, copying over the contents of webmap_1 into it, and starting a live server. If you have any trouble with this - refer to the beginning of the previous tutorial.
By now, you should have the same file contents and result as you did from the last tutorial

To start, we will edit our index.html to include the correct setup for mapbox, and set up our map in a config.js instead of the map.js we were using earlier. We will be taking this code from the official Mapbox Storytelling repo.
It is important to note that if some of this is confusing, that is fine. using something copy pasted from the internet without fully understanding what it does is totally par for the course, especially when it comes to niche javascript libraries.
Editing index.html
Copy and paste the entirety of this into your index.html. If your curious, this code comes from the src > index.html in the Mapbox Storytelling repo:
<!DOCTYPE html>
<html>
<head>
    <meta charset='utf-8' />
    <title>Mapbox Storytelling</title>
    <meta name='viewport' content='initial-scale=1,maximum-scale=1,user-scalable=no' />
    <script src='https://api.tiles.mapbox.com/mapbox-gl-js/v2.0.0/mapbox-gl.js'></script>
    <link href='https://api.tiles.mapbox.com/mapbox-gl-js/v2.0.0/mapbox-gl.css' rel='stylesheet' />
    <script src="https://unpkg.com/intersection-observer@0.5.1/intersection-observer.js"></script>
    <script src="https://unpkg.com/scrollama"></script>
    <style>
        body {
            margin:0;
            padding:0;
            font-family: sans-serif;
        }
        a, a:hover, a:visited {
            color: #0071bc;
        }
        #map {
            top:0;
            height: 100vh;
            width:100vw;
            position: fixed;
        }
        #header {
            margin: auto;
            width: 100%;
            position: relative;
            z-index: 5;
        }
        #header h1, #header h2, #header p {
            margin: 0;
            padding: 2vh 2vw;
            text-align: center;
        }
        #footer {
            width: 100%;
            min-height: 5vh;
            padding-top: 2vh;
            padding-bottom: 2vh;
            text-align: center;
            line-height: 25px;
            font-size: 13px;
            position: relative;
            z-index: 5;
        }
        #features {
            padding-top: 10vh;
            padding-bottom: 10vh;
        }
        .hidden {
            visibility: hidden;
        }
        .centered {
            width: 50vw;
            margin: 0 auto;
        }
        .lefty {
            width: 33vw;
            margin-left: 5vw;
        }
        .righty {
            width: 33vw;
            margin-left: 62vw;
        }
        .fully {
            width: 100%;
            margin: auto;
        }
        .light {
            color: #444;
            background-color: #fafafa;
        }
        .dark {
            color: #fafafa;
            background-color: #444;
        }
        .step {
            padding-bottom: 50vh;
            /* margin-bottom: 10vh; */
            opacity: 0.25;
        }
        .step.active {
            opacity: 0.9;
        }

        .step div {
            padding:  25px 50px;
            line-height: 25px;
            font-size: 13px;
        }

        .step img {
            width: 100%;
        }

        @media (max-width: 750px) {
            .centered, .lefty, .righty, .fully {
                width: 90vw;
                margin: 0 auto;
            }
        }

        /* Fix issue on mobile browser where scroll breaks  */
        .mapboxgl-canvas-container.mapboxgl-touch-zoom-rotate.mapboxgl-touch-drag-pan,
        .mapboxgl-canvas-container.mapboxgl-touch-zoom-rotate.mapboxgl-touch-drag-pan .mapboxgl-canvas {
            touch-action: unset;
        }

        </style>
</head>
<body>

<div id="map"></div>
<div id="story"></div>
<script src="./config.js"></script>
<script>
var layerTypes = {
    'fill': ['fill-opacity'],
    'line': ['line-opacity'],
    'circle': ['circle-opacity', 'circle-stroke-opacity'],
    'symbol': ['icon-opacity', 'text-opacity'],
    'raster': ['raster-opacity'],
    'fill-extrusion': ['fill-extrusion-opacity'],
    'heatmap': ['heatmap-opacity']
}

var alignments = {
    'left': 'lefty',
    'center': 'centered',
    'right': 'righty',
    'full': 'fully'
}

function getLayerPaintType(layer) {
    var layerType = map.getLayer(layer).type;
    return layerTypes[layerType];
}

function setLayerOpacity(layer) {
    var paintProps = getLayerPaintType(layer.layer);
    paintProps.forEach(function(prop) {
        var options = {};
        if (layer.duration) {
            var transitionProp = prop + "-transition";
            options = { "duration": layer.duration };
            map.setPaintProperty(layer.layer, transitionProp, options);
        }
        map.setPaintProperty(layer.layer, prop, layer.opacity, options);
    });
}

var story = document.getElementById('story');
var features = document.createElement('div');
features.setAttribute('id', 'features');

var header = document.createElement('div');

if (config.title) {
    var titleText = document.createElement('h1');
    titleText.innerText = config.title;
    header.appendChild(titleText);
}

if (config.subtitle) {
    var subtitleText = document.createElement('h2');
    subtitleText.innerText = config.subtitle;
    header.appendChild(subtitleText);
}

if (config.byline) {
    var bylineText = document.createElement('p');
    bylineText.innerText = config.byline;
    header.appendChild(bylineText);
}

if (header.innerText.length > 0) {
    header.classList.add(config.theme);
    header.setAttribute('id', 'header');
    story.appendChild(header);
}

config.chapters.forEach((record, idx) => {
    var container = document.createElement('div');
    var chapter = document.createElement('div');

    if (record.title) {
        var title = document.createElement('h3');
        title.innerText = record.title;
        chapter.appendChild(title);
    }

    if (record.image) {
        var image = new Image();
        image.src = record.image;
        chapter.appendChild(image);
    }

    if (record.description) {
        var story = document.createElement('p');
        story.innerHTML = record.description;
        chapter.appendChild(story);
    }

    container.setAttribute('id', record.id);
    container.classList.add('step');
    if (idx === 0) {
        container.classList.add('active');
    }

    chapter.classList.add(config.theme);
    container.appendChild(chapter);
    container.classList.add(alignments[record.alignment] || 'centered');
    if (record.hidden) {
        container.classList.add('hidden');
    }
    features.appendChild(container);
});

story.appendChild(features);

var footer = document.createElement('div');

if (config.footer) {
    var footerText = document.createElement('p');
    footerText.innerHTML = config.footer;
    footer.appendChild(footerText);
}

if (footer.innerText.length > 0) {
    footer.classList.add(config.theme);
    footer.setAttribute('id', 'footer');
    story.appendChild(footer);
}

mapboxgl.accessToken = config.accessToken;

const transformRequest = (url) => {
    const hasQuery = url.indexOf("?") !== -1;
    const suffix = hasQuery ? "&pluginName=scrollytellingV2" : "?pluginName=scrollytellingV2";
    return {
      url: url + suffix
    }
}

var map = new mapboxgl.Map({
    container: 'map',
    style: config.style,
    center: config.chapters[0].location.center,
    zoom: config.chapters[0].location.zoom,
    bearing: config.chapters[0].location.bearing,
    pitch: config.chapters[0].location.pitch,
    interactive: false,
    transformRequest: transformRequest
});

if (config.showMarkers) {
    var marker = new mapboxgl.Marker({ color: config.markerColor });
    marker.setLngLat(config.chapters[0].location.center).addTo(map);
}

// instantiate the scrollama
var scroller = scrollama();

map.on("load", function() {
    if (config.use3dTerrain) {
        map.addSource('mapbox-dem', {
            'type': 'raster-dem',
            'url': 'mapbox://mapbox.mapbox-terrain-dem-v1',
            'tileSize': 512,
            'maxzoom': 14
        });
        // add the DEM source as a terrain layer with exaggerated height
        map.setTerrain({ 'source': 'mapbox-dem', 'exaggeration': 1.5 });

        // add a sky layer that will show when the map is highly pitched
        map.addLayer({
            'id': 'sky',
            'type': 'sky',
            'paint': {
                'sky-type': 'atmosphere',
                'sky-atmosphere-sun': [0.0, 0.0],
                'sky-atmosphere-sun-intensity': 15
            }
        });
    };

    // setup the instance, pass callback functions
    scroller
    .setup({
        step: '.step',
        offset: 0.5,
        progress: true
    })
    .onStepEnter(response => {
        var chapter = config.chapters.find(chap => chap.id === response.element.id);
        response.element.classList.add('active');
        map[chapter.mapAnimation || 'flyTo'](chapter.location);
        if (config.showMarkers) {
            marker.setLngLat(chapter.location.center);
        }
        if (chapter.onChapterEnter.length > 0) {
            chapter.onChapterEnter.forEach(setLayerOpacity);
        }
        if (chapter.callback) {
            window[chapter.callback]();
        }
        if (chapter.rotateAnimation) {
            map.once('moveend', function() {
                const rotateNumber = map.getBearing();
                map.rotateTo(rotateNumber + 90, {
                    duration: 24000, easing: function (t) {
                        return t;
                    }
                });
            });
        }
    })
    .onStepExit(response => {
        var chapter = config.chapters.find(chap => chap.id === response.element.id);
        response.element.classList.remove('active');
        if (chapter.onChapterExit.length > 0) {
            chapter.onChapterExit.forEach(setLayerOpacity);
        }
    });
});

// setup resize event
window.addEventListener('resize', scroller.resize);

</script>

</body>
</html>
Here we just established all of the overhead for the storymap. Once you are done with your map, if you want to change how any of the constituent parts of it look, like the title or chapter text boxes, you will do so in your index.html.
Making a config.js
In your webmap_2 directory, make a file called config.js, and open it in your text editor. Copy all of this code into it, this is from src > config.js.template at the same Mapbox Repo.
var config = {
    style: 'mapbox://styles/mapbox/streets-v11',
    accessToken: 'YOUR_ACCESS_TOKEN',
    showMarkers: true,
    markerColor: '#3FB1CE',
    theme: 'light',
    use3dTerrain: false,
    title: 'The Title Text of this Story',
    subtitle: 'A descriptive and interesting subtitle to draw in the reader',
    byline: 'By a Digital Storyteller',
    footer: 'Source: source citations, etc.',
    chapters: [
        {
            id: 'slug-style-id',
            alignment: 'left',
            hidden: false,
            title: 'Display Title',
            image: './path/to/image/source.png',
            description: 'Lorem ipsum dolor sit amet, consectetur adipiscing elit, sed do eiusmod tempor incididunt ut labore et dolore magna aliqua. Ut enim ad minim veniam, quis nostrud exercitation ullamco laboris nisi ut aliquip ex ea commodo consequat. Duis aute irure dolor in reprehenderit in voluptate velit esse cillum dolore eu fugiat nulla pariatur. Excepteur sint occaecat cupidatat non proident, sunt in culpa qui officia deserunt mollit anim id est laborum.',
            location: {
                center: [-122.418398, 37.759483],
                zoom: 8.5,
                pitch: 60,
                bearing: 0
            },
            mapAnimation: 'flyTo',
            rotateAnimation: false,
            callback: '',
            onChapterEnter: [
                // {
                //     layer: 'layer-name',
                //     opacity: 1,
                //     duration: 5000
                // }
            ],
            onChapterExit: [
                // {
                //     layer: 'layer-name',
                //     opacity: 0
                // }
            ]
        },
        {
            id: 'other-identifier',
            alignment: 'right',
            hidden: false,
            title: 'Second Title',
            image: './path/to/image/source.png',
            description: 'Copy these sections to add to your story.',
            location: {
                center: [-77.020636, 38.886900],
                zoom: 8.5,
                pitch: 60,
                bearing: -43.2
            },
            mapAnimation: 'flyTo',
            rotateAnimation: false,
            callback: '',
            onChapterEnter: [],
            onChapterExit: []
        }`
    ]
};
With those two added, you'll want to add your accessToken where it currently says accessToken: 'YOUR_ACCESS_TOKEN',.
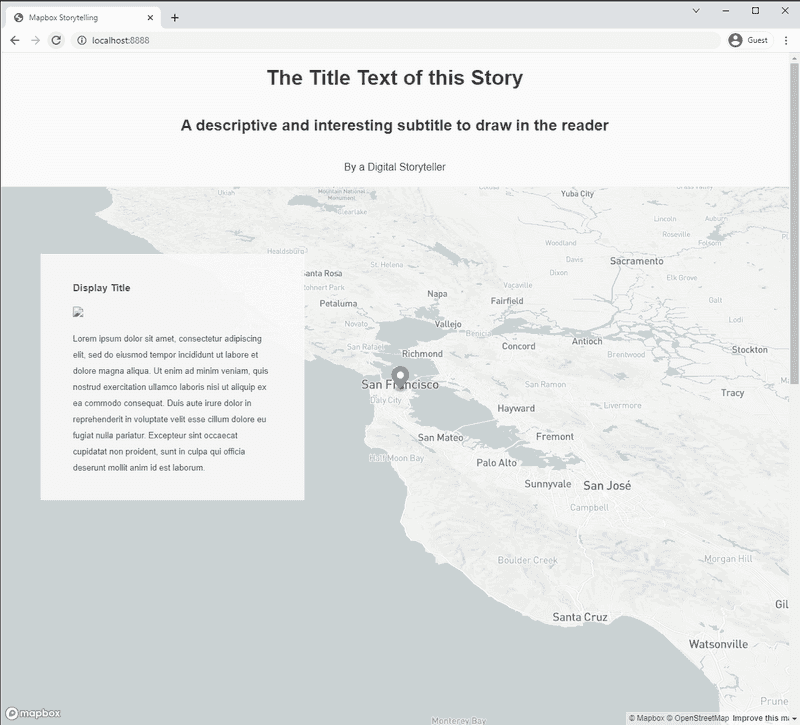
Once you do that, save and possibly refresh, you're all set up! Your map.js is no longer of any use to you, and you can feel free to delete it if you would like to keep your repo clean. You should have a template story with some basic animation in your browser, which looks something like this:
Adding your Content
Creating a Style and Adding it
Next we'll start adding our own content to the map - and by this I mean our datasets. For this we'll go back to Mapbox Studio.
In Mapbox Studio, click "New Style" and select your style. I'll go with Monochrome and the Light variation. One you make the map go ahead and give it a name, we'll only need one for the whole project, so I would name it the same thing, webmap_2_storytelling.
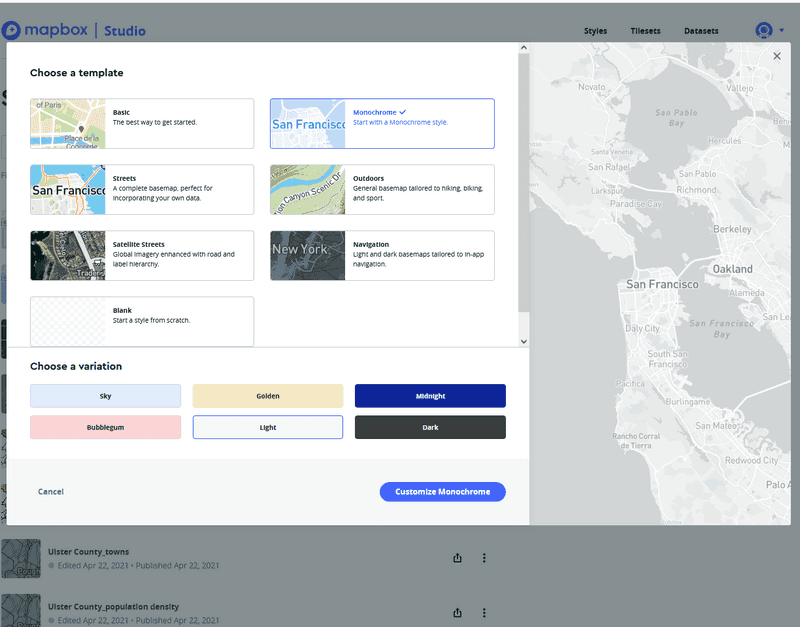
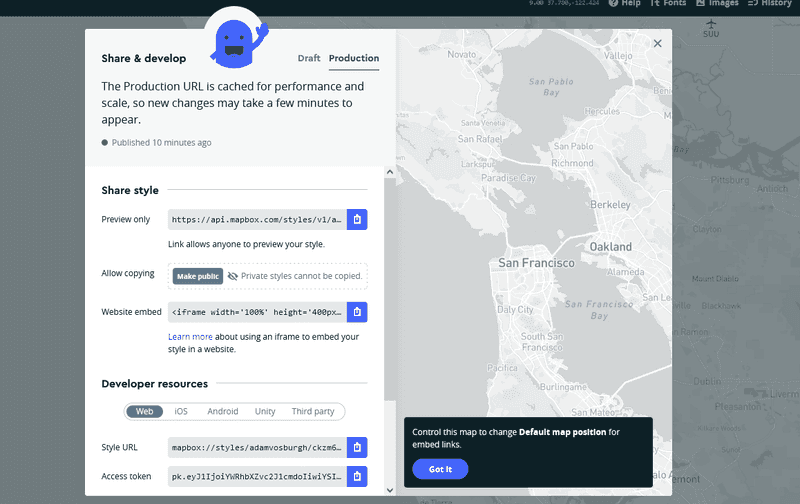
Now that we have our base style, let's go ahead and add it to our storymap. On the top right, click Publish, click through that menu, and then click the Share button immediately to it's left. There you can copy the Style URL for your map, and then put it in your config.js.
Now, any style changes that you make on your mapbox studio map will show in your storymap. Take note of the menus description of the difference between draft and production share urls - if you don't see change reflected right away on your map, that may be why. If you haven't done so yet, copy over your Access Token too. This should be the same one as you made earlier.
Adding and Styling data in Mapbox Studio
Let's add the data we used in the previous tutorial. Tab over to the Layers menu on the left-hand toolbox, and hit the plus icon. In the next menu hit Source and then Upload Data. Upload our blocks_joined_trees_um.gejson dataset.
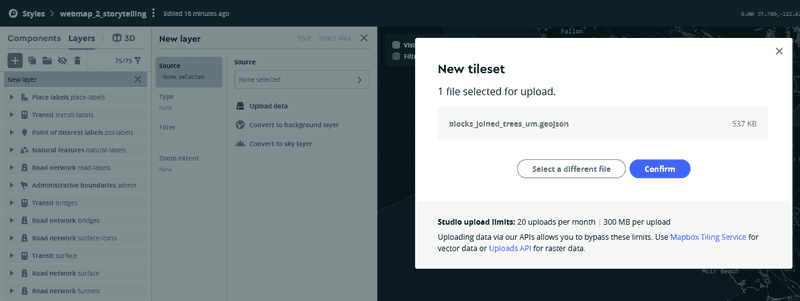
You should see the dataset being uploading in the bottom right-hand corner. Once it is done, enter the url under Add Source by ID, or by searching for it under Your Sources. If it doesn't work or you can't find it, give it a second until it is done processing. If you pan over to NYC, you should see the footprint of your dataset there.
Once your dataset is added as a layer, click back onto the Style menu for that layer, and click Color. Select Style Across Data Range in the menu, and then a pop-up will ask which variable in the data range, select avg_diamet, or however you have the variable named.
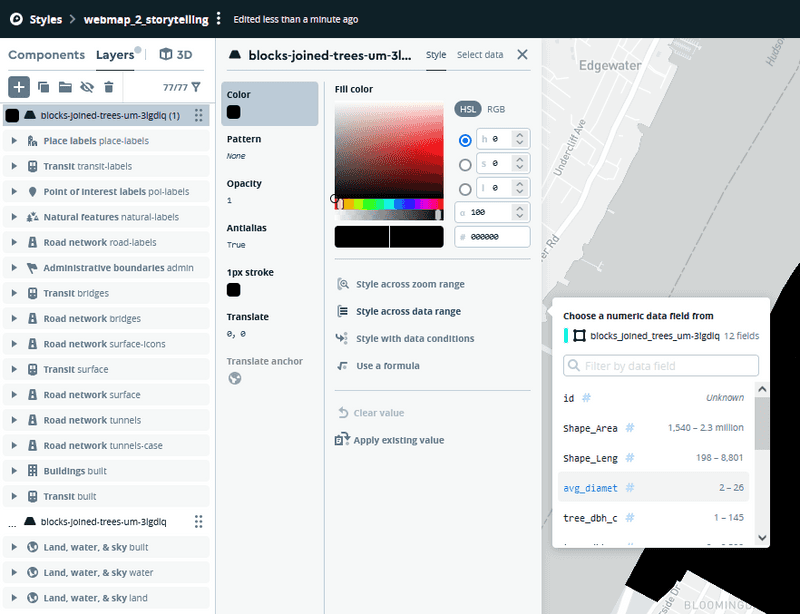
Now, in a very similar fashion to QGIS, we will style the data as a gradient from small to large average radius per block. Select + Add another stop until we have five - you'll notice that the radius will already be determined based on the number of stops and the linear rate of change we have selected above. Now that we have those, let's select our colors. I will use ColorBrewer2 again.
After we have our stops and colors added, lets drag our layer down so it is only above the Land, water & sky layers, so the other map data will be on top of the blocks. Lastly, you may notice that there are some black polygons left, if you remember in the last tutorial, we filtered these out by catching them with a null filter. However (to my knowledge) there is not a way of doing this in Mapbox Studio.
While it will work for now, this means that for your own projects, you should filter out the null values when in QGIS before exporting, so you don't have to deal with that styling issue here.
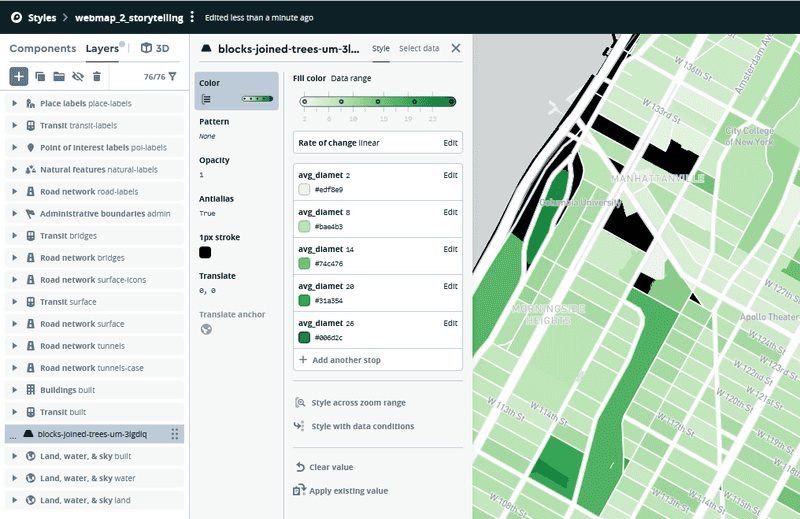
Now the Layer is added and ready to use. Lastly let's rename it so that it will be easy to reference in the storymap, I'm renaming it back to the dataset name, or blocks-joined-trees-um.
Adding and Styling Another dataset
Repeat the steps above but for your 2015_Street_Tree_Census_subset_um.geojson dataset. Instead of choosing Style across data range for color, we will select a single color and Style across data range for Radius, and use the tree_dbh variable.
This time, the default values mapbox will give us when adding stops will be way too large, on account of an outlier in the dataset. Reference your QGIS project for good stops, for me that was 2.615, 6.444, 9.379, 15.036, and 26.000. For my size I used 1 to 5 px.
Lastly, rename the layer so that it is easy to type, I did 2015-street-tree-census-subset, and move the layer so that it is below labels but above road geometries.
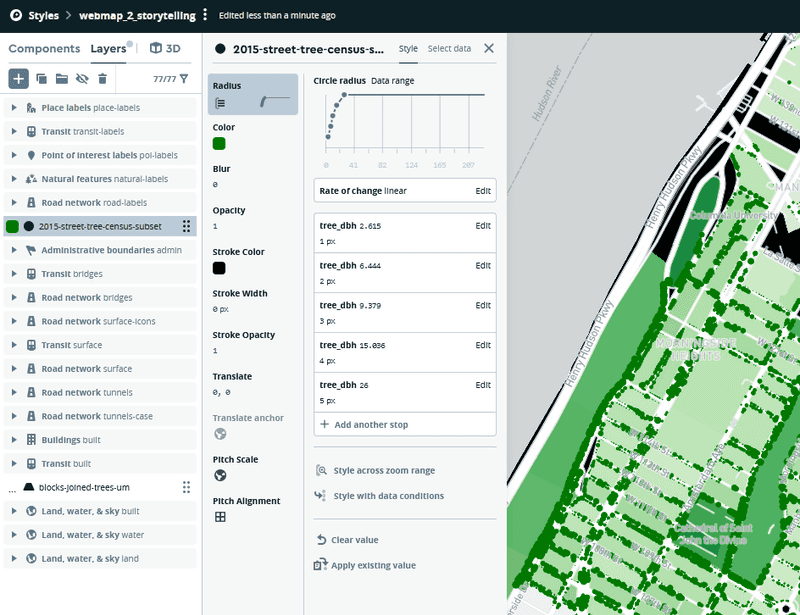
Make sure to hit Publish after you're finished with that. Okay, we're done with Mapbox Studio! Back to our text editor.
Making a storymap
Step 1: Finding a Story
This is probably the hardest part, and unfortunately not one that is possible for me to complete in the tutorial. For demo purposes, I'll tell a story about trees in uptown nyc. There are a lot of trees all over the world, so I think I'll start out at global scale, zoom in, and then turn on data layers one at a time. (Please make a story better than this.)
Now that I have my title, I'll start by editing the titles and bylines. In my config.js this is everything above chapters, which we'll get to next. This is also where global settings for the story are defined and while this template doesn't have all it has some, so pay attention to some of those, like showMarkers, for example. I set that to false because I think it is distracting, while I set use3dTerrain to true.
var config = {
    style: 'mapbox://styles/adamvosburgh/ckzm6ymoc001y15s707imeig0',
    accessToken: 'pk.eyJ1IjoiYWRhbXZvc2J1cmdoIiwiYSI6ImNrOGE5MDhudzAzcHozbW82cTRnY201ZWEifQ.SyIq-l5sw9Ew6mGRLgfp1w',
    showMarkers: false,
    markerColor: '#3FB1CE',
    theme: 'light',
    use3dTerrain: true,
    title: 'NYC Street Trees',
    subtitle: 'A Tale of Many Trees',
    byline: 'By Adam Vosburgh',
    footer: 'Source: source citations, etc.',
Step 2: Adding Chapters
Chapters are the manner by which you tell mapbox what information to show depending on how far a reader has scrolled. Every chapter has an id which must be unique, a camera (in the form of location/zoom/pitch,) and an onChapterEnter / `onChapterExit' event. Aside from these, there are lots of options that you may or may not need (some of which are included in the template), but those are the core.
Here are my chapters:
 chapters: [
        {
            id: 'chapter-1',
            alignment: 'left',
            hidden: false,
            title: 'Trees of the World',
            image: './img/tree.png',
            description: "There are a lot of trees in the world. Here is a picture of one of them. Let's look at one place in particular which has a lot of trees, but is not necessarily known for that.",
            location: {
                center: [0, 0],
                zoom: 2,
                pitch: 0,
                bearing: 0
            },
            mapAnimation: 'flyTo',
            rotateAnimation: false,
            callback: '',
            onChapterEnter: [
                {
                    layer: 'blocks-joined-trees-um',
                    opacity: 0,
                    duration: 3000,
                },
                {
                    layer: '2015-street-tree-census-subset',
                    opacity: 0,
                    duration: 3000,
                }
            ],
            onChapterExit: []
        },
        {
            id: 'chapter-2',
            alignment: 'left',
            hidden: false,
            title: 'New York City',
            image: './img/legend-tree.png',
            description: 'New York City has lots of street trees. In fact, trees are a super important part of NYCs resilient infrastructure, saving millions a year in drainage costs and providing heat relief to blocks in the summer. This dataset shown here is from the 2015 NYC Street Tree Census - where volunteers measure mark and identify trees.',
            location: {
                center: [-73.94834, 40.80899],
                zoom: 15,
                pitch: 0,
                bearing: 0
            },
            mapAnimation: 'flyTo',
            rotateAnimation: false,
            callback: '',
            onChapterEnter: [
                {
                    layer: '2015-street-tree-census-subset',
                    opacity: 1,
                    duration: 3000,
                },
            ],
            onChapterExit: []
        },
        {
            id: 'chapter-3',
            alignment: 'left',
            hidden: false,
            title: 'Not So Many Trees',
            description: 'In this dataset, there are areas with not so many trees...',
            location: {
                center: [-73.94834, 40.80899],
                zoom: 18.75,
                pitch: 60,
                bearing: -60
            },
            mapAnimation: 'flyTo',
            rotateAnimation: false,
            callback: '',
            onChapterEnter: [],
            onChapterExit: []
        },
        {
            id: 'chapter-4',
            alignment: 'right',
            hidden: false,
            title: 'Many Trees',
            description: 'And areas with lots of trees!',
            location: {
                center: [-73.96059, 40.80322],
                zoom: 19,
                pitch: 60,
                bearing: 15
            },
            mapAnimation: 'flyTo',
            rotateAnimation: false,
            callback: '',
            onChapterEnter: [
                {
                    layer: 'blocks-joined-trees-um',
                    opacity: 0,
                    duration: 3000,
                },
                {
                    layer: '2015-street-tree-census-subset',
                    opacity: 1,
                }
            ],
            onChapterExit: []
        },
        {
            id: 'chapter-5',
            alignment: 'right',
            hidden: false,
            title: 'Block Summary',
            image: './img/legend-block.png',
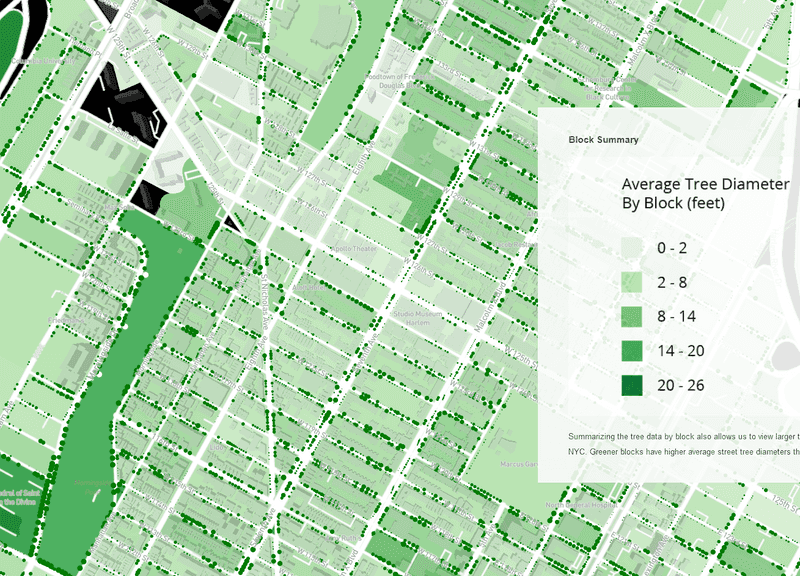
            description: 'Summarizing the tree data by block also allows us to view larger trends in tree cover in NYC. Greener blocks have higher average street tree diameters than lighter blocks.',
            location: {
                center: [-73.94834, 40.80899],
                zoom: 15,
                pitch: 0,
                bearing: 0
            },
            mapAnimation: 'flyTo',
            rotateAnimation: false,
            callback: '',
            onChapterEnter: [
                {
                    layer: 'blocks-joined-trees-um',
                    opacity: 1,
                    duration: 3000,
                },
                {
                    layer: '2015-street-tree-census-subset',
                    opacity: 1,
                }
            ],
            onChapterExit: []
        },
        {
            id: 'chapter-6',
            alignment: 'left',
            hidden: false,
            title: 'The End',
            description: 'Tutorial Created for Methods in Spatial Research, Spring 2022.',
            location: {
                center: [-73.96089, 40.80827],
                zoom: 19,
                pitch: 30,
                bearing: 115
            },
            mapAnimation: 'flyTo',
            rotateAnimation: true,
            callback: '',
            onChapterEnter: [
                {
                    layer: 'blocks-joined-trees-um',
                    opacity: 0,
                    duration: 3000,
                },
                {
                    layer: '2015-street-tree-census-subset',
                    opacity: 0,
                    duration: 3000,
                }
            ],
            onChapterExit: []
        }
    ]
};
Once you have that in and hit save, you should be able to read my story in it's entirety, it should look like this. If you still don't see anything, make sure that you hit publish on your map in Mapbox Studio, and then even after that it can take a few minutes to show up.
I'll note a few things going on here:
- Layers are added to the map using the Layer Name that we defined in Mapbox Studio. That is all we need to reference the data and its respective styling.
- All of the work is being done by
onChapterEnter, and setting the opactiy for that layer. I personally only useonChapterExitif I am switching a dataset out for every chapter. My approach is to define the opacity for a layer everytime that it changes - layers won't change unless you tell them to. - One thing you need to think about is what happens when your reader scrolls back up too - you'll want to plan for that so they don't break the site.
- A really useful tool for setting up the 'camera' is the Mapbox Location Helper.
- To get the images I added to work, you'll need to add them to your repo. I placed them in a folder called 'img'. Here is the download link.
- While you can add legends directly onto the map in html, the chapter image field is a really useful place to put legends.
Step 3: Fine-Tune your Story Map
Now that our map is up and running, we'll want to go back and spend some time styling our various html elements. This can all be done in your index.html, spefically under the <style> tag, where the css for each element is located.
If you're not familiar with css, don't stress about it too much, but if you would like to change anything in particular, you can figure out the vast majority of what you need to change just by googling around for it. Even the best of web developers look up whether text color is color or text-color on a daily basis. A classic resource for webdev fundamentals is w3 schools.
The End
Congratulations! You now have a story map. Just in case there is anything you're troubleshooting, here is a live demo of what it should look like, and here's the config.js in it's entiretly:
var config = {
    style: 'mapbox://styles/adamvosburgh/ckzm6ymoc001y15s707imeig0',
    accessToken: 'pk.eyJ1IjoiYWRhbXZvc2J1cmdoIiwiYSI6ImNrOGE5MDhudzAzcHozbW82cTRnY201ZWEifQ.SyIq-l5sw9Ew6mGRLgfp1w',
    showMarkers: false,
    markerColor: '#3FB1CE',
    theme: 'light',
    use3dTerrain: true,
    title: 'NYC Street Trees',
    subtitle: 'A Tale of Many Trees',
    byline: 'By Adam Vosburgh',
    footer: 'Source: source citations, etc.',
    chapters: [
        {
            id: 'chapter-1',
            alignment: 'left',
            hidden: false,
            title: 'Trees of the World',
            image: './img/tree.png',
            description: "There are a lot of trees in the world. Here is a picture of one of them. Let's look at one place in particular which has a lot of trees, but is not necessarily known for that.",
            location: {
                center: [0, 0],
                zoom: 2,
                pitch: 0,
                bearing: 0
            },
            mapAnimation: 'flyTo',
            rotateAnimation: false,
            callback: '',
            onChapterEnter: [
                {
                    layer: 'blocks-joined-trees-um',
                    opacity: 0,
                    duration: 3000,
                },
                {
                    layer: '2015-street-tree-census-subset',
                    opacity: 0,
                    duration: 3000,
                }
            ],
            onChapterExit: []
        },
        {
            id: 'chapter-2',
            alignment: 'left',
            hidden: false,
            title: 'New York City',
            image: './img/legend-tree.png',
            description: 'New York City has lots of street trees. In fact, trees are a super important part of NYCs resilient infrastructure, saving millions a year in drainage costs and providing heat relief to blocks in the summer. This dataset shown here is from the 2015 NYC Street Tree Census - where volunteers measure mark and identify trees.',
            location: {
                center: [-73.94834, 40.80899],
                zoom: 15,
                pitch: 0,
                bearing: 0
            },
            mapAnimation: 'flyTo',
            rotateAnimation: false,
            callback: '',
            onChapterEnter: [
                {
                    layer: '2015-street-tree-census-subset',
                    opacity: 1,
                    duration: 3000,
                },
            ],
            onChapterExit: []
        },
        {
            id: 'chapter-3',
            alignment: 'left',
            hidden: false,
            title: 'Not So Many Trees',
            description: 'In this dataset, there are areas with not so many trees...',
            location: {
                center: [-73.94834, 40.80899],
                zoom: 18.75,
                pitch: 60,
                bearing: -60
            },
            mapAnimation: 'flyTo',
            rotateAnimation: false,
            callback: '',
            onChapterEnter: [],
            onChapterExit: []
        },
        {
            id: 'chapter-4',
            alignment: 'right',
            hidden: false,
            title: 'Many Trees',
            description: 'And areas with lots of trees!',
            location: {
                center: [-73.96059, 40.80322],
                zoom: 19,
                pitch: 60,
                bearing: 15
            },
            mapAnimation: 'flyTo',
            rotateAnimation: false,
            callback: '',
            onChapterEnter: [
                {
                    layer: 'blocks-joined-trees-um',
                    opacity: 0,
                    duration: 3000,
                },
                {
                    layer: '2015-street-tree-census-subset',
                    opacity: 1,
                }
            ],
            onChapterExit: []
        },
        {
            id: 'chapter-5',
            alignment: 'right',
            hidden: false,
            title: 'Block Summary',
            image: './img/legend-block.png',
            description: 'Summarizing the tree data by block also allows us to view larger trends in tree cover in NYC. Greener blocks have higher average street tree diameters than lighter blocks.',
            location: {
                center: [-73.94834, 40.80899],
                zoom: 15,
                pitch: 0,
                bearing: 0
            },
            mapAnimation: 'flyTo',
            rotateAnimation: false,
            callback: '',
            onChapterEnter: [
                {
                    layer: 'blocks-joined-trees-um',
                    opacity: 1,
                    duration: 3000,
                },
                {
                    layer: '2015-street-tree-census-subset',
                    opacity: 1,
                }
            ],
            onChapterExit: []
        },
        {
            id: 'chapter-6',
            alignment: 'left',
            hidden: false,
            title: 'The End',
            description: 'Tutorial Created for Methods in Spatial Research, Spring 2022.',
            location: {
                center: [-73.96089, 40.80827],
                zoom: 19,
                pitch: 30,
                bearing: 115
            },
            mapAnimation: 'flyTo',
            rotateAnimation: true,
            callback: '',
            onChapterEnter: [
                {
                    layer: 'blocks-joined-trees-um',
                    opacity: 0,
                    duration: 3000,
                },
                {
                    layer: '2015-street-tree-census-subset',
                    opacity: 0,
                    duration: 3000,
                }
            ],
            onChapterExit: []
        }
    ]
};
Looking forward to seeing what you make!
Tutorial by Adam Vosburgh, Spring 2022.
Written for Methods in Spatial Research, Spring 2022.