Making Data from Field Observations
In this module you will be introduced to basic methods for field data collection through designing a method for recording information about your surroundings. Using the GPS capabilities of your cellphone you will turn this information into data that you can work with in GIS environment.
You will design a basic data collection protocol (a set of survey questions) and use a web-based tool called Kobo Toolbox to collect responses to your survey questions. Kobo Toolbox was developed by a network of researchers, computer scientists and humanitarian organizations to enable field data collection in remote environments. The tool is easy to learn and free to use.
The tutorial uses collecting information about NYCs trees as an example.
The assignment for this week asks that you design your own data collection protocol on a topic of your choice.
Free free to read through the module then complete the steps outlined adapted to your own data collection project.
On Simplification
The core task in this tutorial is to (1) think through what you are trying to observe and record about your environment; then (2) decide how you will collect that information, including what forms of abstraction and simplification are needed. The world is a complicated, beautiful, messy place and turning that into spatial data requires a great deal of simplification. Designing how you will simplify that world is a creative and subjective act.
Kobo Toolbox allows us to record point locations (vector data) using the GPS receiver of your phone. Thus the final form of your dataset will be a series of points, one for each observation you make. The attribute table will contain fields for each of the questions you define in your survey. This is a limitation of this type of data collection but can be used productively. Consider, how can you distill the kinds of information you wish to collect about your topic into questions that can be answered about a single point location? How might you later combine or group the point observations in QGIS? (n.b Kobo Toolbox does have an option to record a line or area based on observations, students with more advanced experience using Python for geospatial analysis may choose to explore these options and convert cells the containing sequential coordinates of line or polygon features to Well Known Text.)
Kobo Toolbox is one of several similar open source tools for field data collection -- others include EpiCollect5, OpenDataKit (ODK), Ohmage & Magpi. All of these tools allow you to easily collect GPS points in connection with a survey that can contain many types of questions. The data can be by multiple people and recorded in a central database. These are great tools for collecting standardized information, and can be used by many users. They all however, require that you decide on what information you will collect prior to starting to collect that information.
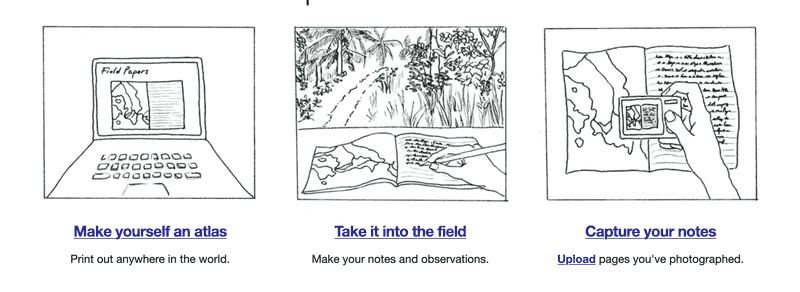 Field Papers is another field data collection tool that uses a very different approach. Instead of collecting GPS points and recording answers to pre-defined questions, Field Papers allows you to create a map or series of maps for an area you are interested in that you can print and take into the field to annotate and draw on. The platform allows you to re-upload photographs of your annotated maps. Using a custom barcode printed with the map they are automatically georeferenced and can be downloaded as georeferenced raster data with your annotations. This tool was developed by Stamen Design and has been used in many projects around the world. You can choose to digitize (see previous module) the annotations you recorded to convert them into vector based data. Field Papers is very easy to use and well documented.
Collecting data through field work can take multiple forms and always involves abstraction and simplification. The most thoughtful projects take this into account and consider the relationship between the form of abstraction/simplification they use and the subject of their work.
The remainder of this module walks you through the workflow required to work with Kobo Toolbox to collect data for a survey you have designed.
Setup & Survey Design
Create a Kobo Toolbox account. See the Sign Up button in top right of webpage.
Note: Kobo Toolbox works best on Google Chrome.
Once you have successfully created an account, log in and navigate to your Kobo Toolbox projects. It should look something like this but will not have any projects listed yet.

Select New and then to Build from scratch. Name your project and give it a short description.
You will now have a blank project within which you can design your survey.

Use the + icon to create a new question. Select the question type. If you are collecting point locations it is good to start with a point question so that you collect this location first. Click Save to save your in progress survey.

Continue to add all of the questions (and their question type) for which you hope to collect information.
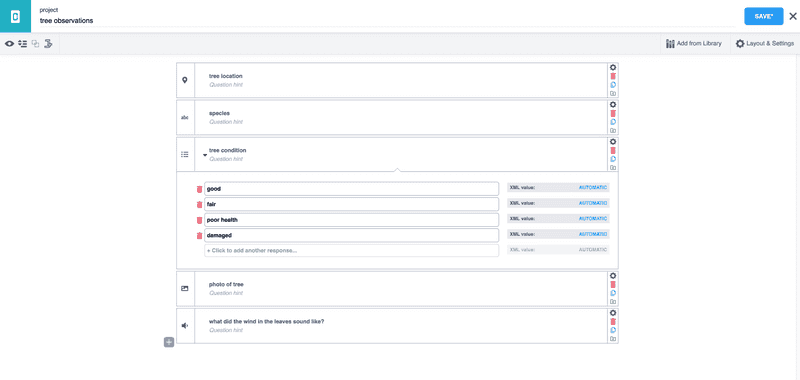
When you have finished click save and then the X icon at the top right of the page.
To begin collecting data using the form you just created click Deploy which will create a live link to the survey that you can use to collect data in the form you just designed.
After you have successfully deployed your survey you should see options for how to collect data:
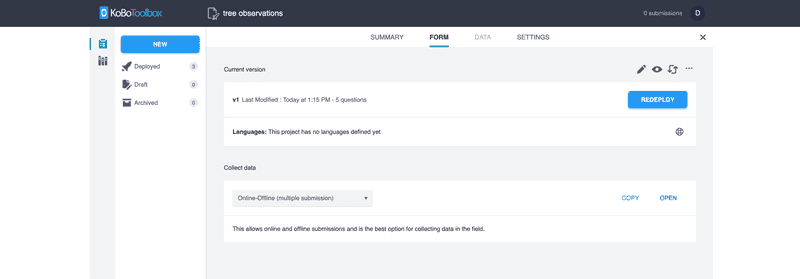
Choose Online-Offline(multiple submissions) as the collection method. As the site explains "This allows online and offline submissions and is the best option for collecting data in the field." The OPEN link allows you to open your survey in your computer's webbrowser. You can preview your data collection form this way.
Collect data
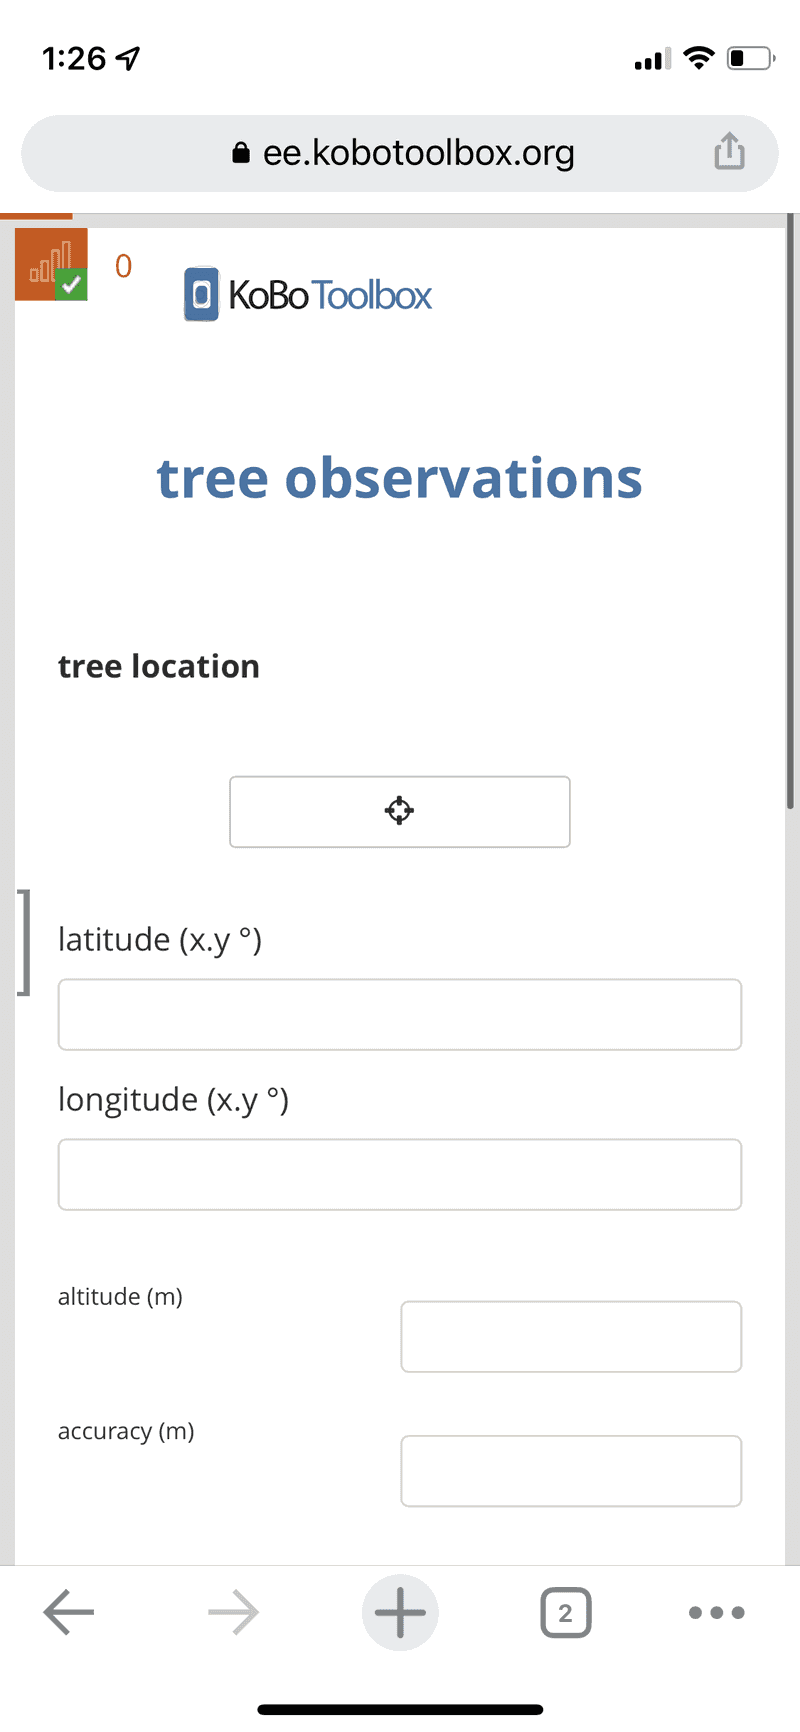 To begin collecting data in the field, copy the link to your survey (using the
 Copy button shown above) and send it to yourself so that you can open it on your smart phone.
Using the GoogleChrome browser on your phone (note you must use GoogleChrome, KoboCollect isn't supported on other browsers) open the link to your survey. You are ready to collect data. After collecting each entry click submit. The recorded data will be stored and will be uploaded to your Kobo Toolbox account whenever you phone has a working internet connection. So, if you have opened the Kobo Toolbox collection link on your phone but go out to collect data in the field in an area without cell service (or have turned off cellular data) you will still be able to collect observations which will then be uploaded once your phone is connected to the internet.
Review & download your data
Once you return from collecting your data you can review and export your recorded observations from the Kobo Toolbox website in the Data tab for your selected project.

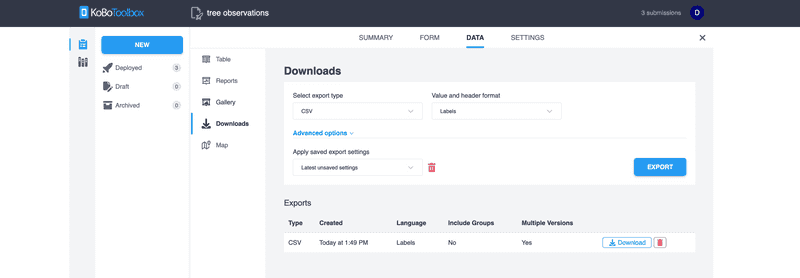
Iin addition to seeing the data collected in tabular form you can preview your points with the Map view, get summary statistics for each question with the Reports view, preview any photographs taken in the Gallery, or Download the data you collected. In the download tab make selections to download you data in CSV format, then click Export. When the export has finished processing use the download button (shown below) to download the data.
Open data in QGIS
Open a new QGIS project. The data you have created is in a CSV (i.e. delimited text) format and contains latitude and longitude coordinates for each point you have collected. So we can create a point dataset using QGIS based on these latitude and longitude coordinates (this process was also covered in the Mapping Where module).
Navigate to the Layer>Add Layer>Add Delimited Text Layer menu. Use the ... button next to the file name field to navigate to the location where you have saved the data downloaded from Kobo Toolbox.
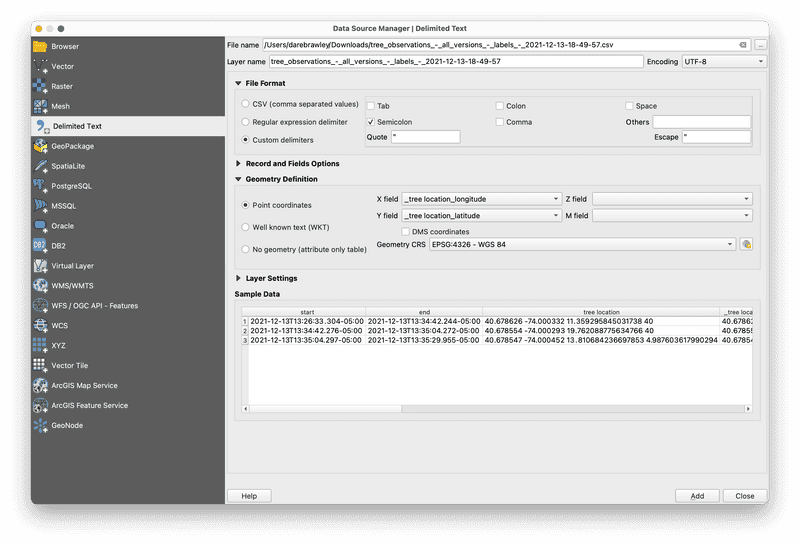
For file format select Custom Delimiters and then make the selections shown below. This step is required because the dataexported from Kobo Toolbox uses semicolons (;) to mark the breaks between columns rather than commas (,) which is the standard for CSV files.
Once you have made the selections shown for the custom delimiters you should see a preview of your collected data in the sample data window. For the geometry definition selct Point coordinates, adn then specify the field name containing longitude values for the X Field and then the field name containing latitude values for the Y Field (QGIS may have already done this for you automatically.).
Click Add and then Close your collected data points should be visible in your QGIS project. Open the attribute table for the new layer you have added to see all of the information you collected about each point.
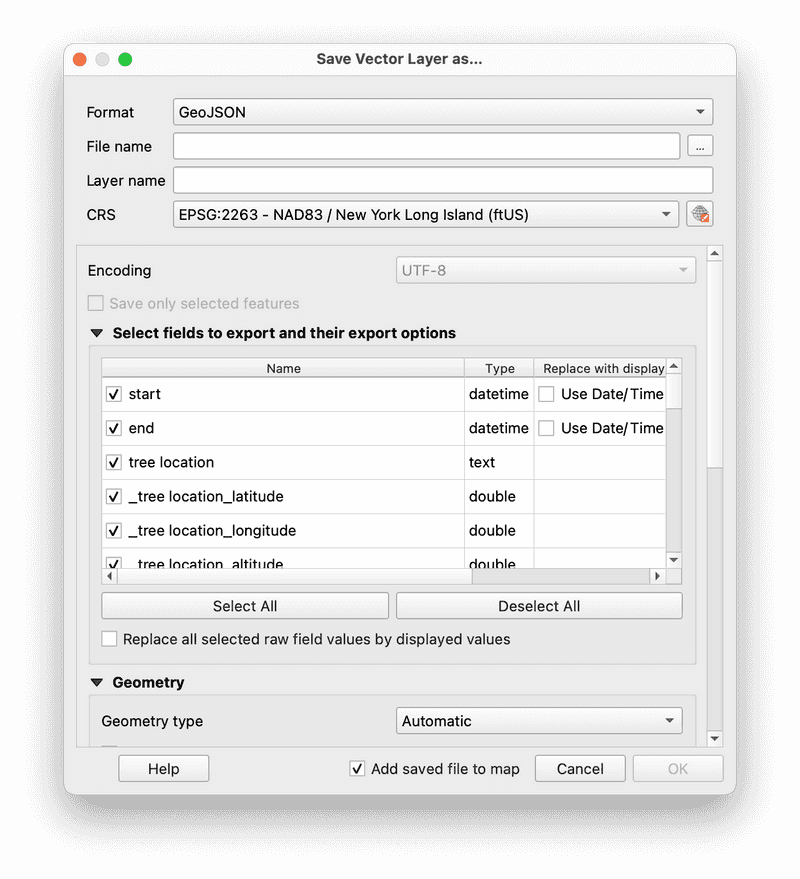
Remember from the Projections and Coordinate Reference Systems module that all GPS coordinates are collected in WGS84 coordinate reference system. If you look at the CRS for your newly collected data points you will see it is EPSG 4326, WGS84.
Before you continue to work with your newly collected data you should reproject it in a projected coordinate reference system that is well suited to the location you are mapping.
To do this right click the layer name in the layers panel, select Export then Save Features As specify the location where you will save this new dataset then use the select CSR button to choose the projected coordinate reference system that is best for your location.
You have now collected your own dataset and are ready to begin analyzing what you have collected, and to design a map that conveys a narrative based on your work.
Module by Dare Brawley, fall 2021.